FET/USDT — Symmetrical Triangle: Ready for Breakout or BreakdownSummary
The FET/USDT (1D) chart is forming a symmetrical triangle — a consolidation pattern where descending highs and ascending lows converge. Price is trading around 0.7020 inside a tight range, with volatility shrinking as it approaches the apex. Major resistance levels are 0.9089, 1.2319, 1.6173, 2.2200, while the key support lies at 0.3444.
---
Pattern Explanation
Pattern Name: Symmetrical Triangle.
Nature: Neutral; direction depends on breakout confirmation.
Context: Formed after a strong downtrend (Dec–Apr) followed by higher lows since April, suggesting possible accumulation.
Key Point: Breakout/breakdown probability increases as the price nears the apex. Always confirm with volume.
---
Measured Move Projection
Triangle height: 2.2200 – 0.3444 = 1.8756.
Breakout projection from ~0.7020 = 2.5776 (long-term measured move target).
Realistically, price will face major resistances first: 0.9089 → 1.2319 → 1.6173 → 2.2200.
---
Bullish Scenario
Confirmation:
Daily close above descending trendline and ideally 0.9089.
Volume expansion above average.
Retest of breakout zone turning into support.
Targets:
Conservative 1: 0.9089.
Conservative 2: 1.2319.
Aggressive: 1.6173 → 2.2200 → measured move ~2.58.
Trading idea:
Aggressive: enter on breakout with stop loss below breakout candle (~<0.65).
Conservative: wait for breakout + retest above 0.9089, enter on retest.
---
Bearish Scenario
Confirmation:
Daily close below ascending trendline.
Volume spike on sell-side.
Retest failure of broken support as resistance.
Targets:
Initial target: 0.3444.
Extended bearish levels: 0.30 → 0.20 if momentum accelerates.
Trading idea:
Short on retest after breakdown or enter on close confirmation.
Stop loss above retest level (e.g. >0.75 if breakdown occurs around 0.70).
---
Key Notes / Risk Management
Watch volume for confirmation, avoid fakeouts.
Confluence with indicators: RSI, MACD, MA 50/200.
Manage risk: use stop loss, avoid overexposure (1–3% per trade).
Keep an eye on fundamentals or project-related news that could trigger sudden volatility.
---
FET/USDT — forming a Symmetrical Triangle near the apex. A breakout above 0.9089 with strong volume could target 1.23 / 1.62 (ext. 2.22 → measured ~2.58). Breakdown below the rising support risks a drop toward 0.344. Always wait for confirmation and manage risk.
#FETUSDT #FET #CryptoAnalysis #TrianglePattern #Breakout #AltcoinAnalysis #SupportResistance #CryptoTrading #TechnicalAnalysis
FETUSDT trade ideas

FET SHORT1. Chart Type & Pair
Pair: FET/USDT Perpetual (Bitget)
Timeframe: 4-hour (H4)
Type: Candlestick chart
2. Main Levels Marked
MDY-H → Mid-day high
MDY-L → Mid-day low
QQ → Likely a liquidity or equilibrium zone
Weekly/Monthly Highs & Lows also appear marked in orange (higher time-frame S/R).
3. Trade Setup
Entry Zone: Around current price (~0.6775 USDT)
Stop Loss (SL): Just above 0.74 – 0.75 USDT (red zone). This protects against upside invalidation.
Take Profit (TP): Around 0.58 USDT (green zone). This targets the lower liquidity sweep/weekly low.
So this is a short (sell) setup.
4. Risk-to-Reward (R:R)
The red box = risk area (loss if price goes above resistance).
The green box = reward area (profit if price drops).
Visually, this looks like around 1:3 R:R, which is a solid short setup.
5. Strategy Logic
Price is retesting resistance around 0.68 – 0.70.
The trader expects rejection from this zone, leading to a move back down to 0.58.
The stop loss above 0.74 means if buyers push higher, the trade idea is invalid.
✅ In summary:
This is a short trade setup on FET/USDT expecting rejection near current levels (0.68) with a downside target at ~0.58. The trade uses a tight stop above resistance at ~0.74 for good risk/reward.

FETUSDT Resistance Lower High, Swing Low, Swing HigherRide The Next 2 Months of The AI Sector’s Corrections & Next Breakout, short the correction on a macro time frame ignoring the intraday noise. Take Profits & begin buying the dip, accumulating a sizable position to be long on throughout Q4.

Will FETUSDT Trap the Bulls Before a Brutal Drop?Yello Paradisers — is FETUSDT setting up the perfect bull trap before a sharp sell-off? The current market structure suggests danger ahead, and ignoring it could be costly.
💎FETUSDT remains in a clear bearish market structure. After taking inducement, price is now moving toward a key resistance zone while following an ascending channel — a combination that typically increases the probability of a downside reversal.
💎If price reaches this resistance zone and begins showing bearish reversal patterns — such as a double top or head-and-shoulders — the odds of a strong move down will rise significantly. For aggressive traders, an early entry could be taken on a confirmed breakdown of the ascending channel, but this is not the safest play, as the risk-to-reward would be poor.
💎However, if FETUSDT breaks and closes above the invalidation level, our bearish idea will be completely off the table. In that scenario, the smarter move is to wait patiently for a fresh setup with cleaner price action before committing capital.
🎖Strive for consistency, not quick profits. Treat the market as a businessman, not as a gambler.
MyCryptoParadise
iFeel the success🌴

#FET/USDT Preparing for a Major Rally ?#FET
The price is moving within a descending channel on the 1-hour frame and is expected to break and continue upward.
We have a trend to stabilize above the 100 moving average once again.
We have a downtrend on the RSI indicator that supports the upward break.
We have a support area at the lower boundary of the channel at 0.655, acting as strong support from which the price can rebound.
We have a major support area in green that pushed the price upward at 0.650.
Entry price: 0.665
First target: 0.688
Second target: 0.716
Third target: 0.750
To manage risk, don't forget stop loss and capital management.
When you reach the first target, save some profits and then change the stop order to an entry order.
For inquiries, please comment.
Thank you.

FET soon we might flight ha3ha3 :D Dear Traders
we are not so far from the explosion of fet lets see

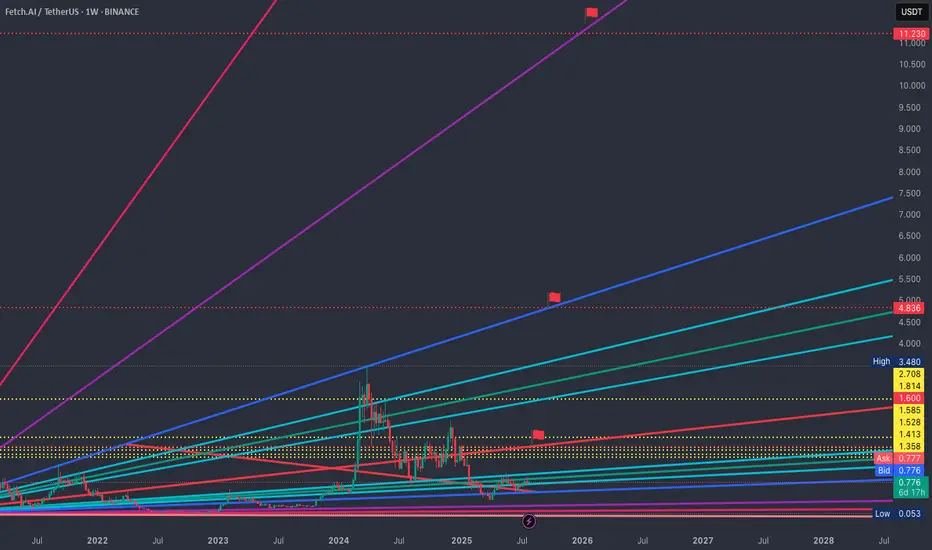
Realistic targets for fet Dear Traders,
Fet have a nice potential im also invested in , here the full targets and realistic ,
you can check my analysis on my profil and see how most of my analysis hit targets ,
fet may take time its too slow
FET/USDT LONG SET-UPBINANCE:FETUSDT
FET/USDT Long Set-up 🟢
Entry - 0.702
Avg - 0.680
SL - 0.637
Target - 0.850 , 0.95++
Lev & margin as per your risk capacity

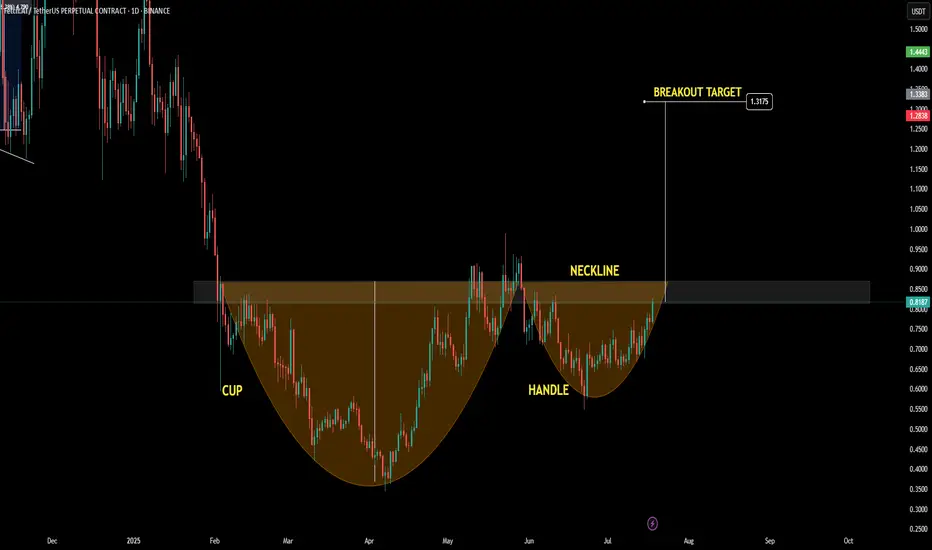
FETUSDT|C&H Setup +100% Breakout MA cluster-A High Quality BreakCup&Handle setup with a high quality breakout the confluent MA cluster—especially the 200-day— as the gatekeeper.
If price hold above the ma200 (and the nearby 20/50) cluster a high-quality breakout and more likely to break the handle and the cup rim.
Here is how I’d weigh it and trade it: DON'T WAIT FOR CUP RIM BREAKOUT
Priority of BUY signal strength indication:
1. Daily close & hold above the ma200 dynamic resistance the most institutions watch - follow BUY
2. Cup handle breakout watch for volume expansion on the break (> 20-day average)
3. Cup rim breakout with a golden cross ma20 reclaim > ma50 curl up is a follow-through BUY
Decision matrix:
- Breaks above key fib level - look for a shallow retest of the breakout line / MA bundle at key fib zone 38.2% - 61.8% liquidity zone for proper trailing stop / limit order.
Target
- TP1 100% fib zone (+50%)
- TP2 extended 161.8% (+100%)
SL slightly below previous low
RR: 3:1
Always trade with affordable risk and respect your stop!

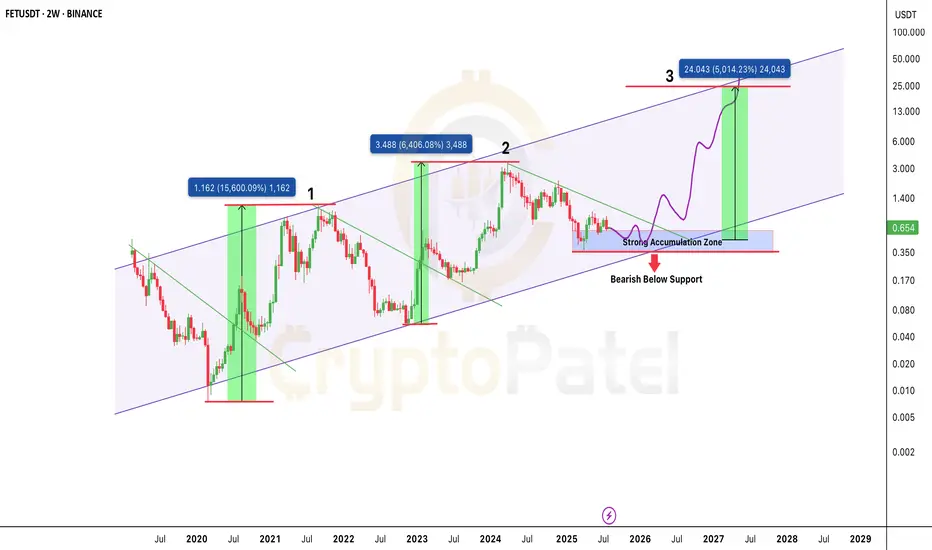
$FET is back in the zone that sparked 15,000%+ rallies?NYSE:FET is back in the zone that sparked 15,000%+ rallies. Same setup. 50x incoming?
FET continues to respect its multi-year ascending channel structure, active since 2020.
Price Action History:
🔹 Wave 1 (2020–2021): +15,600% rally from channel support to resistance
🔹 Wave 2 (2022–2024): +6,400% move following a similar breakout pattern.
🔹 Current Cycle (2025): Price is consolidating in the same accumulation range of $0.35–$0.65.
Key Demand Zone: $0.35–$0.65
Upside Target: ~$24.00 (5,000%+ potential)
🔻 Breakdown Level: Below $0.35 = Structure invalidation
Structure Insight:
Each macro move begins with:
🔹 Accumulation at channel support
🔹 Break of falling trendline
🔹 Aggressive expansion toward the upper boundary
The projected Wave 3 follows this same path if demand zone holds. The structure remains bullish as long as price stays above $0.35.
FET is trading at a high probability accumulation level within a valid macro trend. If history repeats, this could be the next major leg up.
✅ Favor long accumulation strategies
❌ Exit plan needed below $0.35
NFa & DYOR
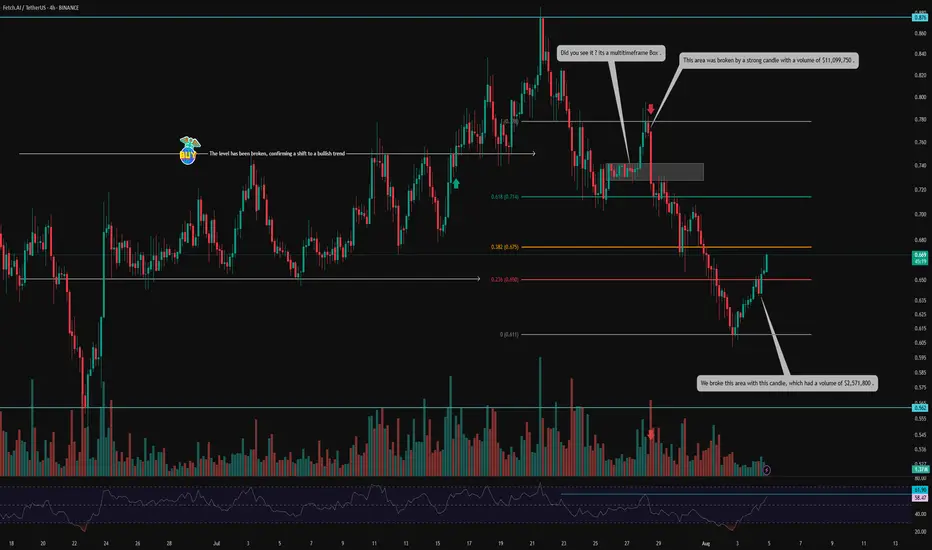
FET on Fire: Volume-Backed V-Pattern Breakout in 4H Structure💀 Hey , how's it going ? Come over here — Satoshi got something for you !
⏰ We’re analyzing FET on the 4-hour timeframe .
👀 After breaking out of its range around $0.75, FET experienced a solid upward move , reaching $0.876 . However , it was rejected from that level and faced heavy selling pressure , eventually forming a consolidation box on the multi-timeframe .
The break of this box, accompanied by rising volume and a total market structure break , led to a move toward the $0.778 resistance , where the price dropped again — this time with significant sell volume .
🎮 The Fibonacci levels in this chart are drawn based on volume-based market activity — specifically from the candle where the sell-off began to the candle where selling pressure ended and a reversal candle formed .
It may sound a bit technical , but the 0.236 Fib level acted as a key V-pattern resistance , which was beautifully broken with a strong $2,571,800 volume, and the candle closed above it .
Following that , traders showed reactions to this level , and the liquidity absorption can be seen in the form of wicks .
🔑 The next important zone is the 0.382 Fibonacci level at $0.675, where we see two possible scenarios :
Reaction and pullback , followed by a breakout .
Breakout first , then a pullback .
You can also place a buy stop at this level — just make sure to use a wider stop-loss .
⚙️ The structure is looking relatively good . The 61.9 RSI region could cause some noise in lower timeframes , but the key area is RSI 70 , which is the entrance to the Overbought zone .
🔼 Volume has been decent , especially considering today is Saturday and a weekend session . This adds more confirmation to the breakout of the V-pattern and the potential end of the correction .
🖥 Summary :
FET is one of those coins with strong recovery potential , operating in the AI sector . It tends to respect classic price action patterns , and with well-drawn Fibonacci levels , volume confirmation , and RSI moving into Overbought , it often activates buy-stop positions cleanly .
💡 Disclaimer :!!! .
Artificial Alliance (FET): Good Opportunities For Trades HereBINGX:FETUSDT.P can provide us with favorable risk-to-reward trades in both directions. We are looking for now for a bullish outcome here, where we are targeting upper zones of $0.77 and $0.88, but this game plan will be active only as long as we are above $0.60.
As if sellers take over that $0.60 zone, we are going to see a steep movement to lower zones, where again we can take a short position!
Swallow Academy

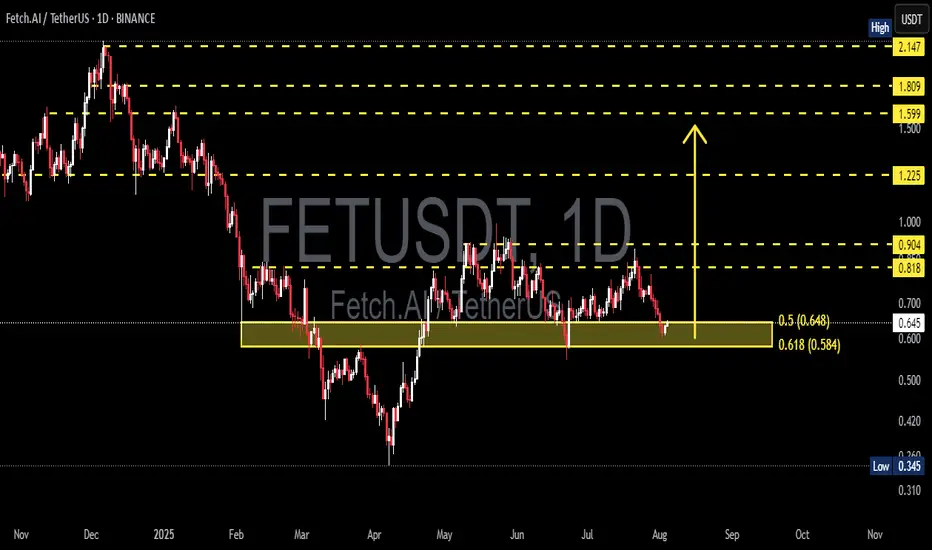
FET/USDT Testing Fibonacci – Bounce Incoming or Breakdown Ahead?📊 Technical Analysis Overview:
FET/USDT is currently testing a strong demand zone aligned with the Fibonacci Retracement 0.5 – 0.618 levels, specifically between $0.648 and $0.584. This “golden pocket” area is historically significant and often acts as a pivot zone for price reversals.
🔍 Chart Pattern:
The price formed a series of higher highs and higher lows from March to June, indicating a bullish structure.
Since July, momentum has weakened, and the price has corrected back into the key support zone that previously acted as a base for a rally.
---
📈 Bullish Scenario:
If price holds above $0.584 and forms a reversal candlestick (e.g., bullish engulfing or hammer), a strong rebound is likely.
Key upside targets:
$0.818 (minor resistance)
$0.904 (psychological level)
Potential breakout toward $1.225 if bullish volume returns.
📉 Bearish Scenario:
A decisive breakdown below $0.584 with high volume could trigger further downside toward:
$0.42 – $0.345 (next major support zone)
This move could confirm a bearish continuation pattern such as a descending triangle if resistance continues to hold.
---
🎯 Strategic Outlook:
The current zone is a make-or-break level, and the market is at a decision point. Traders should wait for a clear confirmation through price action and volume before committing to directional trades.
#FETUSDT #CryptoAnalysis #FibonacciSupport #AltcoinSetup #FetchAI #TechnicalOutlook #BullishOrBearish #SupportZone #GoldenPocket
Fet short to $0.6354Just opened this short on Fet. I think its highly probable that the market attempt to make another low.
DTT strategy applied to gauge the probability. Learn more on x.
Sl : 0.6354
Tp: 0.6029
2RR

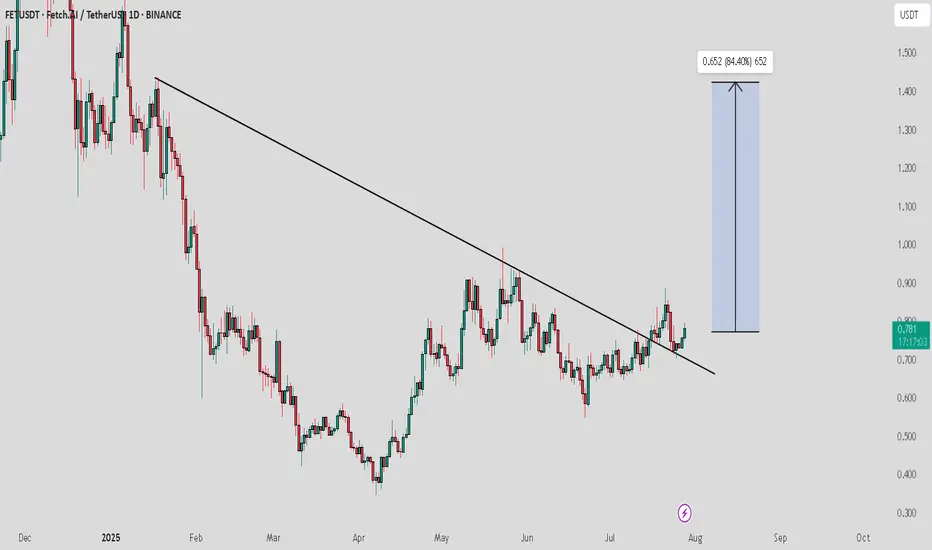
FET / USDT : Momentum building after successful retestFET/USDT has successfully broken out of the descending trendline resistance and is now holding strong after a successful retest. With momentum building, we are expecting a significant move towards the $1.5 level in the coming weeks.
Artificial Superintelligence (FET): Looking For Buy Entry 2We are shifting our focus currently to the 200EMA, where we are expecting the price to reach that area this week; after that, we will be looking for a proper breakout from that region.
In total we still got those 3 entry points we've been aiming for since last time so we wait patiently, not rushing.
It does not matter which entry will be triggered; once we see that, we will be opening a decent R:R position (more info once we reach certain zones).
Swallow Academy

FET — The AI narrative isn't over yetFET is still being held back by the 0.75–0.80 zone, but bulls are not giving up. On the daily timeframe, a trend reversal is emerging based on the moving averages. A breakout above resistance could send the price toward the $1 area — a potential 50–60% gain, which looks quite attractive for a spot long. Support lies at 0.67–0.70. With multiple attempts to break through, there’s a strong chance the next test of the 0.80 zone will lead to a breakout.
Entry on confirmation above $0.80, targeting $1.20

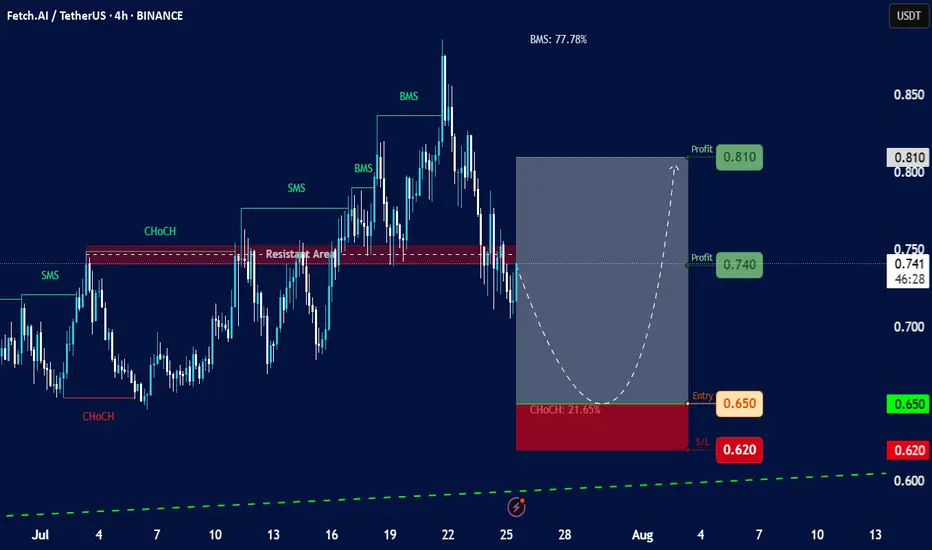
Fetch.AI (FET) against TetherUS (USDT)Chart Overview:
Asset: Fetch.AI (FET) against TetherUS (USDT).
Timeframe: 4-hour (4h) candles.
Current Price (approximate based on chart): Around 0.741 USDT.
Date and Time on Chart: July 25, 2025, 15:11 UTC+4 (This matches the current provided time context, so the chart is very recent).
Overall Trend: The chart shows a recent upward movement followed by a retracement. There are clear indications of "SMS" (Structural Market Shift) and "BMS" (Break in Market Structure) bullish movements, indicating an uptrend was in play.
Key Technical Observations and Labels:
"ChoCH" (Change of Character):
Initial Bullish ChoCH (early July): An initial "ChoCH" is marked early July, signaling a potential shift from bearish to bullish sentiment.
"SMS" (Structural Market Shift) & "BMS" (Break in Market Structure):
Several "SMS" and "BMS" points are identified, suggesting consecutive higher highs and higher lows, confirming an uptrend. The "BMS: 77.78%" label might refer to the percentage gain from a previous low to a recent high, or a percentage of the total movement.
"Resistant Area":
A significant horizontal red dashed line labeled "Resistant Area" is present around the 0.74-0.76 USDT level. This area previously acted as resistance, and the price is currently retesting or struggling with it.
Current Price Action:
The price has recently come down significantly from a peak around 0.88 USDT, retesting the "Resistant Area." It appears to have broken below some immediate support levels.
Proposed Trade Setup (Green Box & Red Box):
Entry (Green Line): 0.650 USDT. This is positioned below the current price, suggesting a "buy the dip" strategy.
Stop Loss (Red Line): 0.620 USDT. This is a tight stop loss, indicating a risk management level if the price drops further.
Profit Targets (Green Boxes):
Profit 1: 0.740 USDT (already very close to the current price, potentially hit or missed depending on execution).
Profit 2: 0.810 USDT.
"ChoCH: 21.65%" (near entry zone): This likely indicates the percentage retracement from the peak to the proposed entry zone, suggesting it's a significant pullback.
Projected Path (Dashed White Line): The curved dashed line shows an anticipated price movement: a dip down to the 0.650 entry zone, followed by a bounce back up towards the profit targets.
Analysis of the Proposed Trade:
Risk-Reward:
Risk: From 0.650 (Entry) to 0.620 (S/L) = 0.030 USDT risk.
Reward 1: From 0.650 (Entry) to 0.740 (Profit 1) = 0.090 USDT reward. (Ratio: 3:1)
Reward 2: From 0.650 (Entry) to 0.810 (Profit 2) = 0.160 USDT reward. (Ratio: approx. 5.3:1)
The risk-reward ratio appears favorable for this proposed trade.
Logic: The setup seems to be based on the idea of a significant retracement (pullback) to a key support level (the proposed 0.650 entry, potentially an order block or demand zone not explicitly marked but implied by the "ChoCH: 21.65%" label in that area) after a strong bullish run. The "Resistant Area" at 0.74-0.76 becomes the first target as the price would need to break back above it.
Considerations and Potential Risks:
Validity of Support: The effectiveness of the 0.650 level as strong support is crucial. If it breaks, the price could fall further.
Market Structure Shift (again): While the uptrend had strong "BMS" signals, the current deeper retracement could lead to a bearish "ChoCH" on a higher timeframe if the 0.650 support fails.
Liquidity: Ensure sufficient liquidity at the proposed entry and exit points, especially with a tighter stop loss.
Overall Market Conditions: The performance of Bitcoin (BTC) and the broader crypto market will significantly influence FET's price action.
Volume: The chart doesn't show volume indicators, which would provide additional insight into the strength of price movements.
Artificial Superintelligence Alliance (FET) Enters Bullish PhaseThere is always really high volume on this chart. FETUSDT trading is very active and this is always a good signal regardless of the overall picture. It means there is interest in this trading pair. Some pairs you can see have absolutely no volume and you know only bots are trading it. When volume is high, you know there are some people buying and selling behind the scenes and when the market goes on a trend, it tends to produce wild moves. So high volume is always good.
The trend is the uptrend next. We already saw a major downtrend starting March 2024. After a low in August 2024, the classic dead-cat-bounce led to a lower high in December and then the final bottom, just two months ago. This is the correction end and bottom and from this bottom we grow. Market conditions are changing.
The bearish phase is over and it lasted more than a year. One year and one month. We are now entering a new phase and it will be a bullish cycle. How long will it last? Can the bullish cycle last just 3 months while the bearish cycle lasted 13 months? These are good eye opening questions. It shows that we might be setting ourselves up for an entire year of growth.
Actually, can be 4 months, 6 months, 8 months, 12 months or more... It doesn't matter, we are going up. Artificial Superintelligence Alliance —FET.
Namaste.

Artificial Superintelligence (FET): Seeing Buying OpportunitySeeing a good opportunity for buying forming here, where we are seeing a proper overturn of trend happening.
We are not going to rush but wait for a proper break of structure to form, which would give us our last confirmation for upcoming bullish movement on FET so focus your attention on the buy entry for now.
Swallow Academy

FET Secondary trend 19 07 2025Logarithm. Time frame 1 week for clarity.
Main trend is an ascending channel.
Secondary trend is a descending channel
Local trend is a Ross hook, at the median resistance. Reversal zone.
By the way, the trading idea from 2022 FET/BTC is still relevant. Pay attention to where the price is.
FET/BTC Main trend. Pump zone cycles . 2022 06

FET Setup: Reclaim, Retest, RallyScenario:
Price reclaimed the 1W order block (OB), confirming strong support in the $0.60–$0.70 area.
If price consolidates above this weekly OB, expect continuation toward the $0.96 equilibrium/resistance zone.
A pullback to retest the 1W OB as support (especially in August) is possible and would be a high-probability entry zone for longs.
Failure to hold the 1W OB would invalidate the bullish setup, so stops should be placed below this level.
Reasoning:
The successful reclaim of the weekly order block signals a structural shift from bearish to bullish. Holding above this area invites further upside, as demand is confirmed. A retest and bounce from the 1W OB would provide a strong confirmation for additional upside, while failure to hold would indicate the move was a deviation. Patience for a clean retest is likely to reward, with targets toward the equilibrium near $0.96.

$FET possible Cup & Handle pattern forming!🚨 NYSE:FET possible Cup & Handle pattern forming!
Price is currently at resistance (neckline), a small correction could come before the breakout.
Let’s hope CRYPTOCAP:BTC continues to pump or at least move sideways for this to play out. If BTC dumps, most altcoins will follow.