FILUSDT trading ideaFILUSDT broke down from a bearish formation and has since been trading within a descending channel, carving out what appears to be a 3-wave corrective structure (ABC) to complete wave W of a broader corrective pattern.
Price is now approaching a critical zone where wave X is expected to develop. If

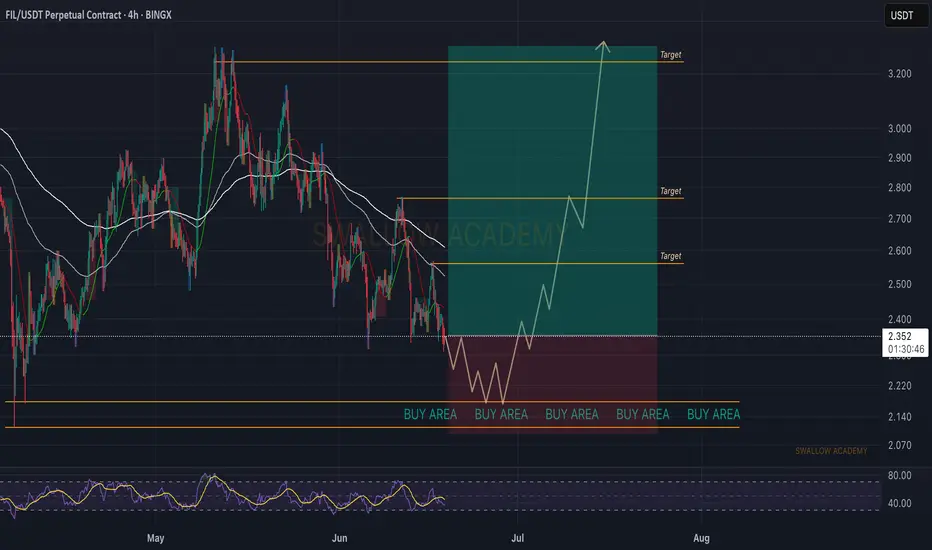
Filecoin (FIL): Approaching Support Area | Good Buy OpportunityFilecoin is approaching a local supprot area or more of a liquidity area, where we have seen liquidity sweeps before bigger upward movement (and that's mainly because this is the local bottom).
So we are looking for upward movement from here, similar to all the previous times.
Swallow Academy
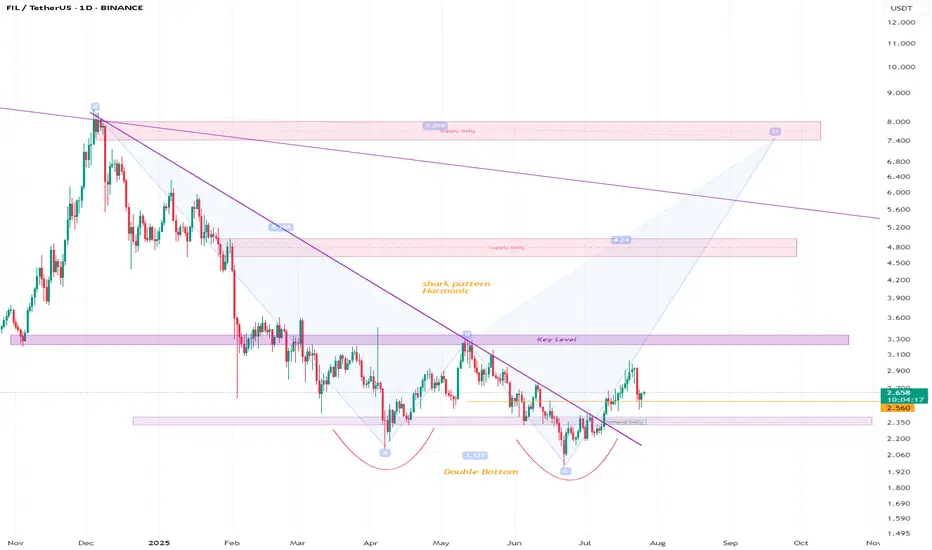
filusdtHello friends, I think Filecoin has a shark pattern and a classic twin bottom. I think it can grow well if important resistance levels are broken (good luck). Check it out for yourself.
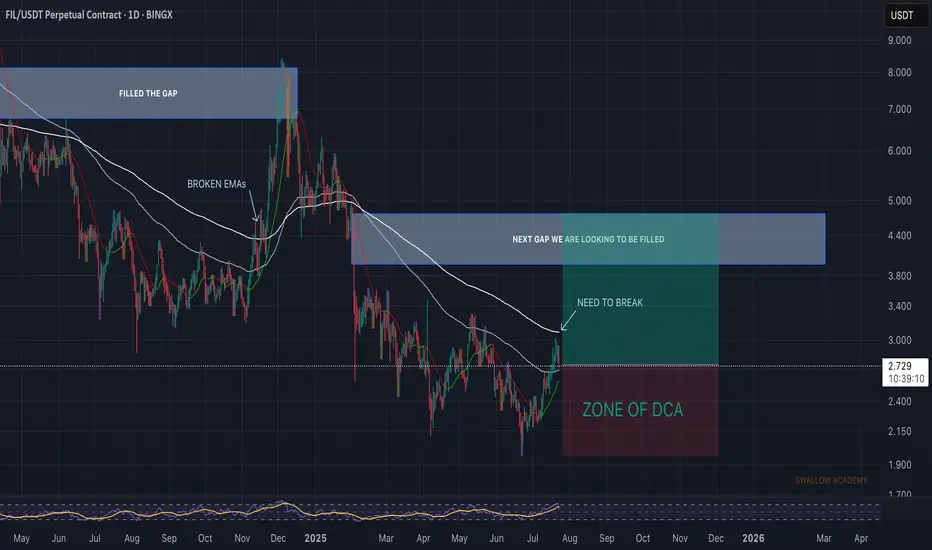
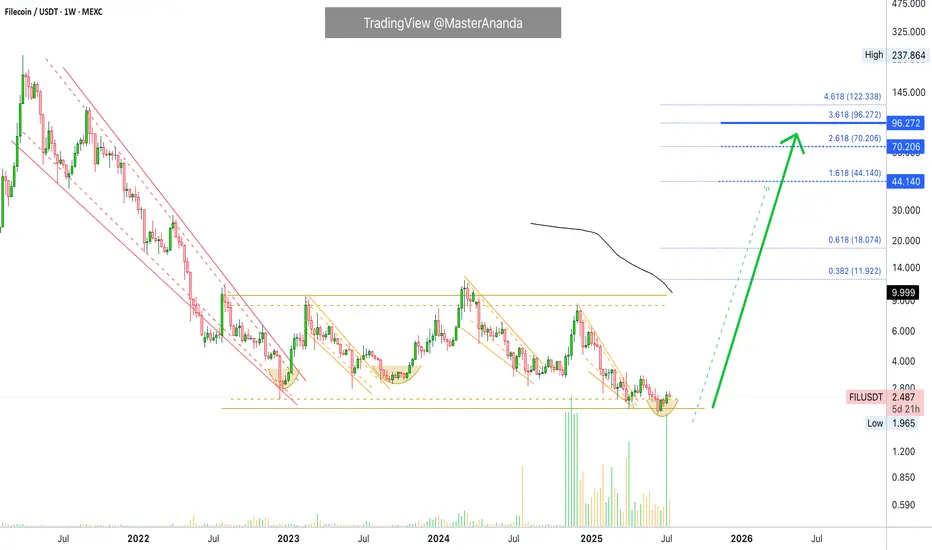
Filecoin (FIL): We Are About To Explode | Repeat of HistoryWe are seeing a good buyside movement to happen very soon, where we are seeing similar things to happen like last time, when we left a huge unfilled gap with downward movement.
We are seeing a good movement happening to upper zones so we are going to look for long from here.
Swallow Academy
FILUSDTFormation of the Wyckoff structure and the beginning of the upward trend
BINANCE:FILUSDT
ARAM PISHBIN

filusdt is in uptrend i think it will be a very good trade and its a good point to risk my money
consider your own decision
it is just my own trade not your trade
hope it will hit the tp
Is there growth ahead?!Hello friends...
Filecoin is one of the high-potential cryptocurrencies in the market, it is currently in an attractive area.
It is suitable for a step purchase.
The growth of altcoins is happening one after another, I don't know if you have noticed it yet?
You have to be patient because it may star

Filecoin Hits Bottom · 3 Years Long BD · Volume Signal · MACD &I think what is really nice about MEXC is that it truly reveals the bottom through volume. The changes in trading volume in this exchange are so pronounced that you can never go wrong. Look at Filecoin, extremely high volume in November 2024, right before a bullish wave. Then again, incredibly high
FIL Secondary trend. Channel zone. 31 03 2025Logarithm. Time frame 3 days (less is not needed).
Main trend. Time frame 1 week.
Published more than 2 years ago 22 01 2023
FIL/USD Main trend. From the maximum of $237 -99%
In the specified range, a horizontal channel with a large % step (exactly 370%) was formed earlier (2.590 - 7.157/10.7)

FILUSDT_1D_BuyFILUSDT Cryptocurrency Analysis Daily Medium and Long Term Time Frame Main Support 2.320 Targets 3.486 and 5.948

See all ideas
Summarizing what the indicators are suggesting.
Oscillators
Neutral
SellBuy
Strong sellStrong buy
Strong sellSellNeutralBuyStrong buy
Oscillators
Neutral
SellBuy
Strong sellStrong buy
Strong sellSellNeutralBuyStrong buy
Summary
Neutral
SellBuy
Strong sellStrong buy
Strong sellSellNeutralBuyStrong buy
Summary
Neutral
SellBuy
Strong sellStrong buy
Strong sellSellNeutralBuyStrong buy
Summary
Neutral
SellBuy
Strong sellStrong buy
Strong sellSellNeutralBuyStrong buy
Moving Averages
Neutral
SellBuy
Strong sellStrong buy
Strong sellSellNeutralBuyStrong buy
Moving Averages
Neutral
SellBuy
Strong sellStrong buy
Strong sellSellNeutralBuyStrong buy
Displays a symbol's price movements over previous years to identify recurring trends.