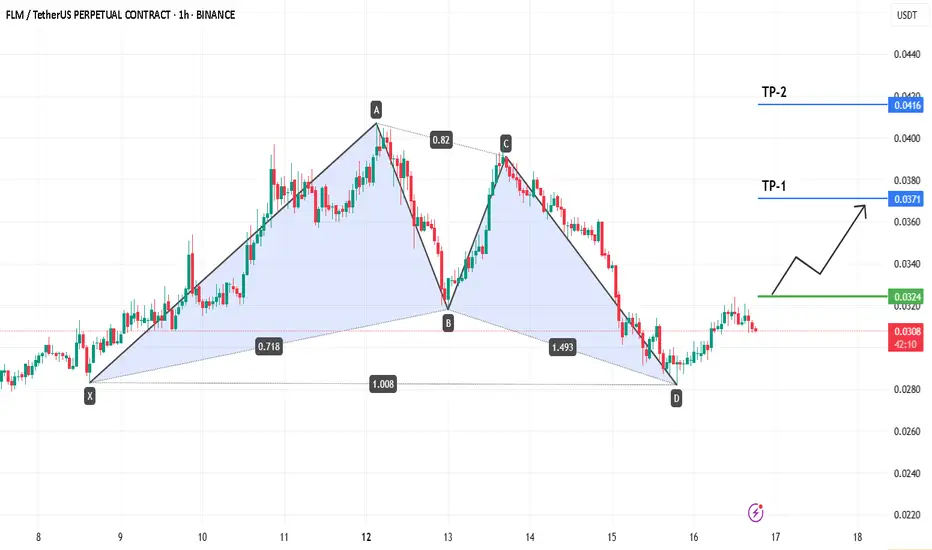
FLM/USDT | 1H Timeframe FLM has recently completed a Bullish Butterfly Harmonic Pattern on the 1-hour chart, signaling a potential reversal from the D point. "
✅ Trade Idea:
Entry Zone: 0.0324 – 0.0330
Stop Loss: Below 0.0300 (structure invalidation)
Take Profit 1 (TP-1): 0.0371
Take Profit 2 (TP-2): 0.0416
⚠️ Risk Ma
FLM/USDT – Bullish Reversal Opportunity | 1H Chart AnalysisFLM has completed a bullish harmonic pattern and formed a strong base around $0.0300–$0.0324, showing signs of accumulation. A breakout above the range suggests a potential bullish move.
📌 Entry: $0.0324
🎯 Target (TP-1): $0.0371
🎯 Final Target: $0.0414
🛡️ Stop Loss: $0.0279
RSI shows bullish dive

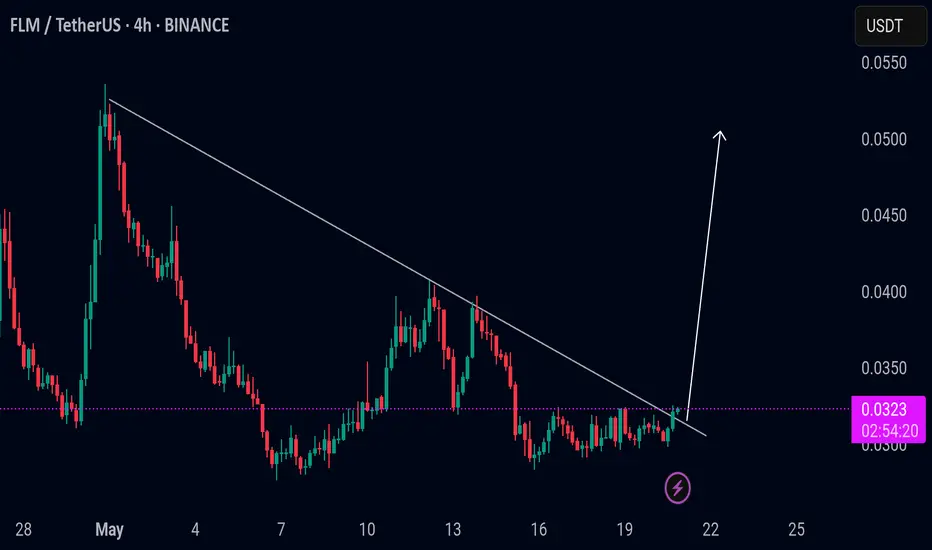
Flm/Usdt BreakoutFLMUSDT:
FLM is now trading around $0.0323. FLM already broke out of the trend line on the 4-hour timeframe and looks bullish. So, the possible scenario, according to the pattern, is bullish momentum in FLM, and it could pump up to 20–30%. Otherwise, if it dumps and trades inside the triangle agai
$BINANCE:FLMUSD : new setup flamingo tokenBINANCE:FLMUSD flamingo token is brok first resistance and we can see next level of resistance in pitchfork

FLM/USDTKey Level Zone: 0.0360 - 0.0370
HMT v8.1 detected. The setup looks promising, supported by a previous upward/downward trend with increasing volume and momentum, presenting an excellent reward-to-risk opportunity.
HMT (High Momentum Trending):
HMT is based on trend, momentum, volume, and market str

$FLM/USDT Breakout AlertAfter a strong accumulation phase, CSE:FLM just broke out of a descending trendline with volume confirmation!
Entry: 0.0154
SL: 0.0137
Target: 0.0269
Price broke above the trendline + 50ema, signalling a potential trend reversal.
Bullish momentum is building; eyes are on the next key level!
Are

FLMUSDT CHART ANALYSİS - EDUCATIONAL POSTHow NFT Technology Developed
NFT technology was created in 2017 based on Ethereum smart contracts. Since then, we have witnessed many successful NFT projects and deals. Stories like these perfectly describe the current and future possibilities of the technology.
The development of blockchain tech

FLMUSDT 1WFLM ~ 1W
#FLM If you still have Conviction on this coin, buy it gradually from here with a minimum target of 20%++

FLMUSDT: Watching for Buyer Activity in the Blue Box FLMUSDT: Watching for Buyer Activity in the Blue Box 🚨
FLMUSDT is in an interesting spot, folks. Here’s what we know:
Active Sellers: Currently, sellers are dominating, but this could change quickly.
Stops at 0.039: This level is key for managing risk and planning entries.
Blue Box Opportu

$FLM pay attentionJust pay attention at FLM it could breakout resistance
Price at 200EMA and 61fibo it's a good point but also look at the CRYPTOCAP:BTC becuase it's leader of market

See all ideas
Summarizing what the indicators are suggesting.
Oscillators
Neutral
SellBuy
Strong sellStrong buy
Strong sellSellNeutralBuyStrong buy
Oscillators
Neutral
SellBuy
Strong sellStrong buy
Strong sellSellNeutralBuyStrong buy
Summary
Neutral
SellBuy
Strong sellStrong buy
Strong sellSellNeutralBuyStrong buy
Summary
Neutral
SellBuy
Strong sellStrong buy
Strong sellSellNeutralBuyStrong buy
Summary
Neutral
SellBuy
Strong sellStrong buy
Strong sellSellNeutralBuyStrong buy
Moving Averages
Neutral
SellBuy
Strong sellStrong buy
Strong sellSellNeutralBuyStrong buy
Moving Averages
Neutral
SellBuy
Strong sellStrong buy
Strong sellSellNeutralBuyStrong buy
Displays a symbol's price movements over previous years to identify recurring trends.