FLOKI on Fire! Bullish Summer for FLOKIUSDTDuring the two-month period from July to August, it's unclear what the specific catalyst might be, but Floki appears poised for a price surge between 75% to 133%. The June low at 0.00005923 seems to mark a solid bottom, and from here, I anticipate a bullish trend in Floki’s price.
Related pairs

Caution is requiredA test was made near the last minor peak and it could not break it and fell and there is a fifth side left to close wxyxxz
*In principle, I am not a supporter of any direction, but I am only giving my point of view, which may be right or wrong. If the analysis helps you, then this is for you. If you

FLOKI ANALYSIS🔮 #FLOKI Analysis 🚀🚀
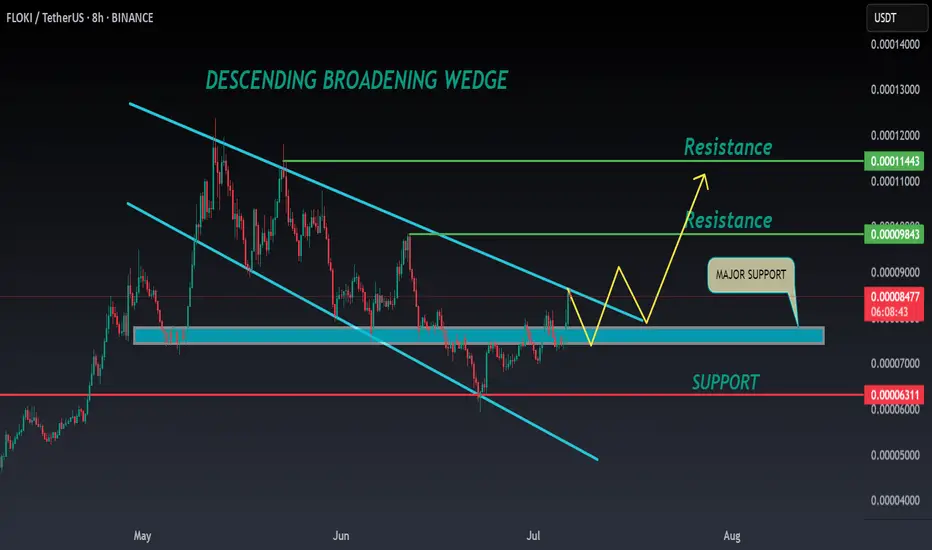
💲💲 #FLOKI was trading in a Descending Broadening Wedge Pattern, and trying to breakout the pattern. Also there is a instant support zone and after the breakout of resistance zone we will see a bullish move. 📈📈
💸Current Price -- $0.00008540
📈Target Price -- $0.00009840
⁉️
FLOKI/USDT – 4H Chart Analysis#FLOKI is showing a clear bullish structure on the 4-hour timeframe, aligning with its upward momentum on the daily and monthly charts. The price has formed a series of higher lows (HL) and higher highs (HH), indicating strength in the current trend.
📈 Breakout Zone: The pair has successfully broke

$FLOKI Breakout Ahead?SEED_DONKEYDAN_MARKET_CAP:FLOKI has broken out of a rising wedge on the 4H chart and is now retesting the breakout zone.
If this support holds, a move toward 0.00010200 is likely to offer up to 23% upside.
DYRO, NFA

FLOKIUSDT Forming Descending ChannelFLOKIUSDT is attracting serious attention as it breaks out of a clear downward channel, showing strong signs of a potential reversal with significant upside. The recent price action indicates that FLOKI has overcome key resistance within the descending channel, hinting at a trend shift supported by

FLOKI Correction done?The Price has reached Weekly1 support and a lot of stop-losses have been liquiditated(orange lines). There is one more major insufficient area FVG3 (Fair Value Gap) remaining and some stop-losses to take out around 0.00006568 price. This is very high probability buy-side liquidity area providing ver

#FLOKI/USDT#FLOKI
The price is moving within a descending channel on the 1-hour frame and is expected to break and continue upward.
We have a trend to stabilize above the 100 moving average once again.
We have a downtrend on the RSI indicator, which supports the upward move by breaking it upward.
We have a

Floki (FLOKI): Possible H&S Pattern Forming | Neckline Area Floki coin is pressuring the local neckline area, which could give us a good opportunity for a breakdown and 33% of market price movement to lower zones.
For now, we are not rushing, as the breakdown has not yet happened but we are seeing great chances for it so we are looking for further movement

BuyWe reach a demand zone and then break last lower high and then pullback to the area and then we enter.

See all ideas
Summarizing what the indicators are suggesting.
Oscillators
Neutral
SellBuy
Strong sellStrong buy
Strong sellSellNeutralBuyStrong buy
Oscillators
Neutral
SellBuy
Strong sellStrong buy
Strong sellSellNeutralBuyStrong buy
Summary
Neutral
SellBuy
Strong sellStrong buy
Strong sellSellNeutralBuyStrong buy
Summary
Neutral
SellBuy
Strong sellStrong buy
Strong sellSellNeutralBuyStrong buy
Summary
Neutral
SellBuy
Strong sellStrong buy
Strong sellSellNeutralBuyStrong buy
Moving Averages
Neutral
SellBuy
Strong sellStrong buy
Strong sellSellNeutralBuyStrong buy
Moving Averages
Neutral
SellBuy
Strong sellStrong buy
Strong sellSellNeutralBuyStrong buy
Displays a symbol's price movements over previous years to identify recurring trends.
Curated watchlists where FLOKIUSDT is featured.

Memecoins: Top meme tokens
10 No. of Symbols
See all sparks
Frequently Asked Questions
The current price of FLOKI / Tether US (FLOKI) is 0.00008215 USDT — it has risen 0.04% in the past 24 hours. Try placing this info into the context by checking out what coins are also gaining and losing at the moment and seeing FLOKI price chart.
FLOKI / Tether US price has risen by 8.56% over the last week, its month performance shows a 4.14% increase, and as for the last year, FLOKI / Tether US has decreased by −45.95%. See more dynamics on FLOKI price chart.
Keep track of coins' changes with our Crypto Coins Heatmap.
Keep track of coins' changes with our Crypto Coins Heatmap.
FLOKI / Tether US (FLOKI) reached its highest price on Jun 5, 2024 — it amounted to 0.00034855 USDT. Find more insights on the FLOKI price chart.
See the list of crypto gainers and choose what best fits your strategy.
See the list of crypto gainers and choose what best fits your strategy.
FLOKI / Tether US (FLOKI) reached the lowest price of 0.00001521 USDT on Sep 11, 2023. View more FLOKI / Tether US dynamics on the price chart.
See the list of crypto losers to find unexpected opportunities.
See the list of crypto losers to find unexpected opportunities.
The safest choice when buying FLOKI is to go to a well-known crypto exchange. Some of the popular names are Binance, Coinbase, Kraken. But you'll have to find a reliable broker and create an account first. You can trade FLOKI right from TradingView charts — just choose a broker and connect to your account.
Crypto markets are famous for their volatility, so one should study all the available stats before adding crypto assets to their portfolio. Very often it's technical analysis that comes in handy. We prepared technical ratings for FLOKI / Tether US (FLOKI): today its technical analysis shows the buy signal, and according to the 1 week rating FLOKI shows the sell signal. And you'd better dig deeper and study 1 month rating too — it's sell. Find inspiration in FLOKI / Tether US trading ideas and keep track of what's moving crypto markets with our crypto news feed.
FLOKI / Tether US (FLOKI) is just as reliable as any other crypto asset — this corner of the world market is highly volatile. Today, for instance, FLOKI / Tether US is estimated as 10.05% volatile. The only thing it means is that you must prepare and examine all available information before making a decision. And if you're not sure about FLOKI / Tether US, you can find more inspiration in our curated watchlists.
You can discuss FLOKI / Tether US (FLOKI) with other users in our public chats, Minds or in the comments to Ideas.