FLOKI/USDT – Big Rebound or Structural Breakdown?Timeframe: 5 Day
Market Condition: After a strong parabolic rally, FLOKI has entered a macro correction and distribution phase
Price is currently trading at a critical decision zone that will determine whether the macro bullish trend continues or shifts into a bearish structure
---
🟨 Key Support Zone (Yellow Block)
0.0000335 – 0.0000270
This zone represents:
Strong historical demand area
Previous accumulation base before a major impulsive move
High-probability buyer reaction zone
The last line of defense for long-term bullish structure
As long as price holds above this zone, FLOKI remains structurally bullish on a macro scale.
---
📐 Market Structure & Pattern Analysis
🔹 1. Market Structure
Formation of Lower Highs (LH) and Lower Lows (LL) → short-to-mid term downtrend
However, no confirmed major support breakdown yet
This move is still classified as a deep correction within a larger bullish cycle
---
🔹 2. Supply & Resistance Zones (Dashed Yellow Lines)
Key resistance levels:
0.0000730
0.0001125
0.0001380
These zones act as:
Major supply areas
Former support turned resistance
Potential distribution zones if price fails to break above them
---
🔹 3. Price Action Pattern
Current structure suggests:
Descending structure / falling channel
Potential development into:
Double Bottom (Bullish Reversal)
or Bearish Continuation Breakdown
Confirmation depends heavily on price reaction at the key support zone.
---
🟢 Bullish Scenario (Primary Reversal Setup)
Key conditions:
Strong rejection and sustained price action above 0.0000335 – 0.0000270
Presence of bullish candles with long lower wicks or impulsive moves
Bullish progression:
1. Strong rebound from key support
2. Formation of Higher Low (HL)
3. Break of minor structure
4. Upside targets:
🎯 0.0000730
🎯 0.0001125
🎯 0.0001380
📈 Bias: Buy on confirmation and reaction, not blind entries.
---
🔴 Bearish Scenario (Structural Breakdown)
Key conditions:
Strong 5D candle close below 0.0000270
Lack of meaningful buyer rejection
Implications:
Macro bullish structure becomes invalid
Previous support flips into resistance
Potential continuation toward:
0.0000200
Or a full retest of previous macro lows
📉 Bias: Breakdown favors trend continuation to the downside.
---
🧠 Technical Conclusion
FLOKI is currently sitting at a macro decision zone
The yellow support block is the critical level
Price reaction here will define:
🔄 Major bullish reversal
or ⛔ Extended bearish continuation
> “It’s not about predicting direction, it’s about reacting to confirmation at key levels.”
---
⚠️ Risk Management Note
Wait for candle confirmation
Avoid emotional entries
Always apply proper risk management
---
#FLOKI #FLOKIUSDT #CryptoAnalysis
#TechnicalAnalysis #PriceAction
#SupportResistance #Altcoins
#BullishScenario #BearishScenario
#TradingView #CryptoTrading
#MarketStructure #SupplyDemand
Market insights

Long trade 🟢 FLOKIUSDT — Institutional Buyside Expansion Setup (1H)
Market: FLOKIUSDT Perpetual
Timeframe: 1H
Session: Tokyo PM → London → NY
5.00 pm
Model: AMD (Accumulation → Manipulation → Distribution)
📌 TRADE DETAILS
Type: Buyside Trade
Entry: 0.00004768
Stop: 0.00004719 (-1.03%)
Target: 0.00005290 (+10.94%)
Risk–Reward: 10.65R
🧱 1. STRUCTURAL CONTEXT
Price is trading inside a high-confluence discount zone formed after a completed bearish leg.
Multiple sell-side liquidity sweeps occurred below 0.000045, followed by structural stabilisation and BOS.
Key observations:
HTF downtrend paused
Sell-side liquidity fully engineered
Price re-accepted above key discount
Structure transitioned from distribution → re-accumulation
🔁 2. AMD MODEL APPLICATION
A-Leg (Accumulation):
Repeated liquidity sweeps below prior lows with diminishing downside follow-through.
M-Leg (Manipulation):
Final spring below demand during low-liquidity session, confirmed by volume expansion.
D-Leg (Distribution / Expansion):
Clean BOS + FVG formation → controlled pullback → expansion leg initiated.
This trade executes inside the early D-Leg.
📊 3. VOLUME SPREAD ANALYSIS (VSA)
Stopping volume visible at the lows
Wide-spread down bars closing off the lows → absorption
Subsequent rallies occurred on lower relative volume (supply exhaustion)
No-supply tests confirmed inside demand
✔ VSA supports a markup phase, not continuation lower.
🧠 4. FOOTPRINT & DELTA CONFIRMATION
Repeated green delta clusters at the entry zone
Buyers absorbing offers on each pullback
No stacked red delta at highs (no distribution signal)
Delta expansion aligned with BOS
✔ Flow confirms buyside dominance, not retail chasing.
📐 5. FIBONACCI ANCHORING
Anchors: High → First BOS Down → Swing Low
Confluence:
Entry aligned with 0.382–0.5 retracement
Expansion targets align with 1.0 → 1.272 extensions
Target 0.00005290 sits inside premium liquidity
🧭 6. SESSION LOGIC
Tokyo: Accumulation + liquidity build
London: Manipulation & BOS
New York: Expansion & delivery.

Long trade
🟦 TAB 1 — TRADE DETAILS
Pair: FLOKIUSDT
Direction: 🟩 Buy-side
Entry: 0.00004531
Take Profit: 0.00005294 (+16.84%)
Stop Loss: 0.00004475 (-1.23%)
Risk–Reward: 13.62R
Session: NY PM
2️⃣ TAB 2 — AMD MODEL (
A-Leg — Accumulation
Sell-side liquidity taken at 0.0000417
Volume climax + stopping action
Session accumulation across Tokyo → London
M-Leg — Manipulation
Sharp wick into deep discount
Re-test FVG at 0.00004520
Footprint absorption confirms the manipulation phase
D-Leg — Distribution / Expansion
Now active:
7️⃣ TAB 7 — VOLUME SPREAD ANALYSIS (VSA)
High-volume stopping bars at lows
No-supply tests before breakout
Rising volume on BOS
Falling volume on pullback = re-accumulation
1️⃣7️⃣ TAB 17 — MACRO REGIME CONFIRMATION
US indices recovering
BTC risk-on
ETH strength increasing
Liquidity rotation into meme assets
Volatility compression → expected breakout
1️⃣8️⃣ TAB 18 — BUBBLES VOLUME (DELTA PRO)
Current Bubble Read:
Large green delta clusters during retest
No major red bubbles capping highs
Increasing positive delta during markup
Volume-normalised bubble expansion → acceleration phase
This confirms continuation, not distribution.
Bullish Flow = Intact
Smart Money = Still buying dips
Next Delta Burst Expectation = 0.000049–0.000050

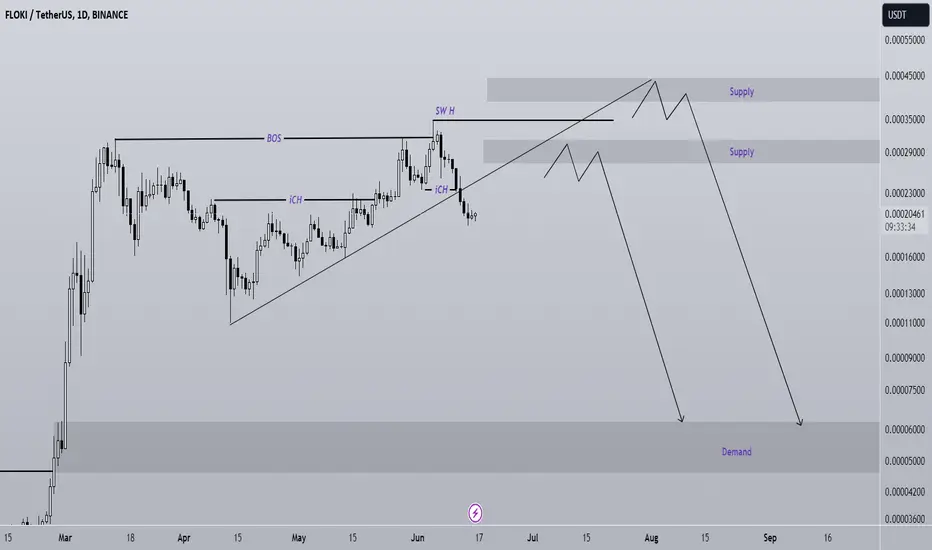
FLOKI analysisAfter the bearish iCH in the internal structure, the price has created an internal pullback.
A trend line has also been broken, but the bullish momentum is very high. FLOKI's bearish trend is expected to be created from one of the two specified supplies.
By maintaining the resistance swap range, it can drop towards the targets.
The target can be demand at the bottom of the chart
Note that the financial market is risky, so:
Do not enter any position without confirmation and trigger.
Do not enter a position without setting a stop.
Do not enter a position without capital management.
When we reach the first TP, save some profit and try to move the stop continuously in the direction of your profit.
If you have any comments please post them, comments will help us improve our performance
Thanks
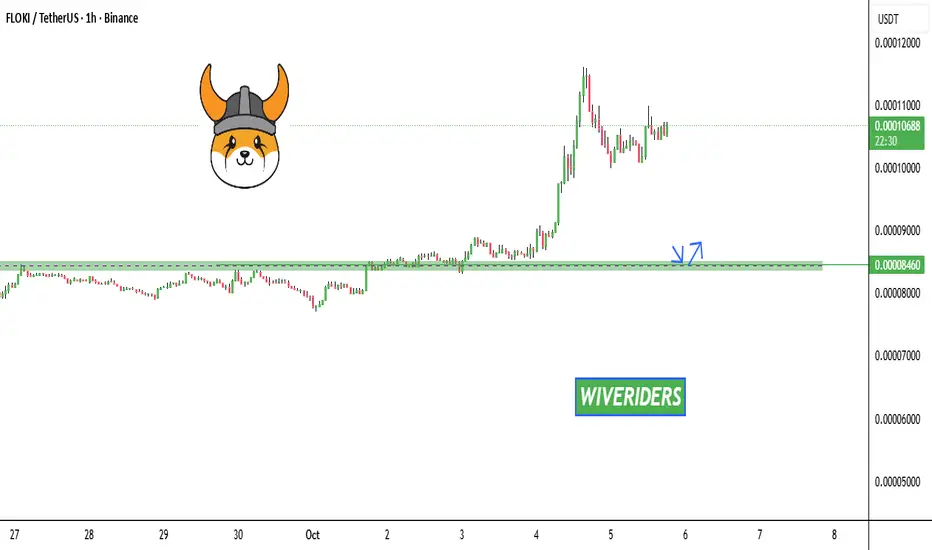
Floki (FLOKI): Buyers Showing Some Kind of Reaction Near SupportFLOKI is showing a decent reaction near the local support zone, which again confirms the validity of this area. As long as buyers keep holding this zone, the game plan stays the same.
If they manage to pull off a clean BOS from here, we’ll be looking for a long setup and aim for a retest of the 100 & 200 EMA. Until then, we just monitor how price behaves around this support and whether buyers can maintain control.
Swallow Academy

#FLOKI/USDT – Trading Signal & Technical Analysis#FLOKI
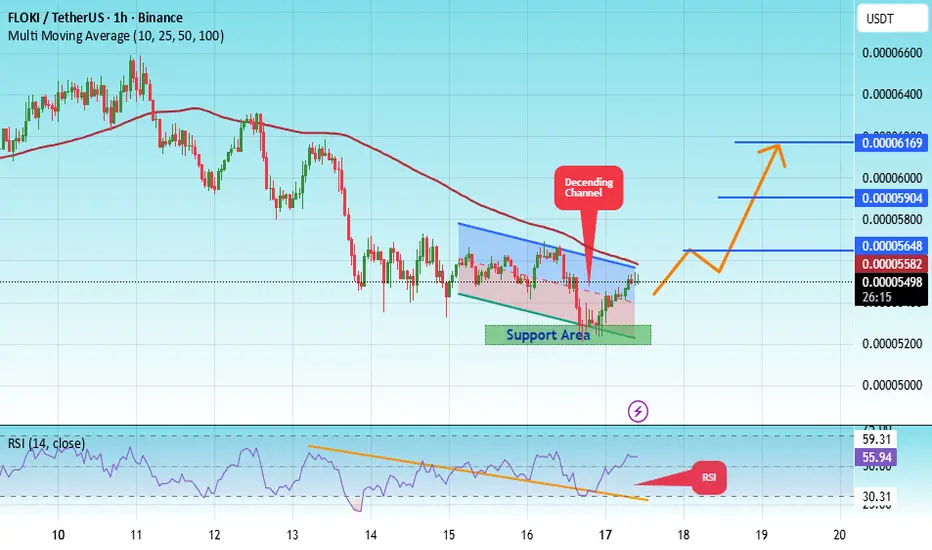
The price is moving within an ascending channel on the 1-hour timeframe and is adhering to it well. It is poised to break out strongly and retest the channel.
We have a downtrend line on the RSI indicator that is about to break and retest, which supports the upward move.
There is a key support zone in green at 0.00005200, representing a strong support point.
We have a trend of consolidation above the 100-period moving average.
Entry price: 0.00005500
First target: 0.00006450
Second target: 0.0005904
Third target: 0.00006170
Don't forget a simple money management rule.
Place your stop-loss order below the green support zone.
Once you reach the first target, save some money and then change your stop-loss order to an entry order.
For any questions, please leave a comment.
Thank you.
FLOKI : BUY MARKETHello friends
According to the technical analysis carried out, we can say that with the entry of buyers, it is possible to enter into a transaction with risk and capital management and move towards the specified goals.
*Trade safely with us*

Wave 3 Loading? FLOKI Prepares for Potential Upside ContinuationFLOKIUSDT is trading within an ascending channel, recently rejecting from the upper boundary near $0.00034416. Price has since entered a prolonged consolidation phase, forming a descending broadening wedge.
The current focus remains on the $0.00020188 region; a breakout from this level would validate a potential wave 3 extension. Overall structure still targets a revisit to the channel’s upper boundary, supported by the recent bounce from the lower channel trendline.
Key levels and targets are illustrated on the chart.

Floki (FLOKI): Waiting For Breakout from EMAsFLOKI is showing a clear turnover here — buyers are slowly switching the trend and testing the EMAs again. What we want to see now is a clean EMA reclaim; that would confirm buyers have proper control. If that happens, the next upside move could aim toward the liquidity zones above.
Good momentum building up here, just need that solid confirmation before the push.
Swallow Academy

FLOKIUSDT 3D#FLOKI is moving inside a descending channel on the 3-day timeframe chart and is currently trading above the midline of the channel, which increases the likelihood of a bullish move. Consider buying here and near the support level at $0.00005967.
In case of a breakout above the channel resistance and the Ichimoku cloud, the potential targets are:
🎯 $0.00011190
🎯 $0.00014258
🎯 $0.00017182
🎯 $0.00020105
🎯 $0.00024267
🎯 $0.00029569
⚠️ Always remember to use a tight stop-loss and maintain proper risk management.

floki daily trendline potential of more gain toward 0.00008686$hey
the support and resistances on the chart are based on the previous data and weekly candlesticks if BINANCE:FLOKIUSDT holds this last supports and the daily trendline the potential of 25% gain is logical toward 0.00008686$

$FLOKI (6-HOUR): SHORT closed in small PROFIT ($0.0000739)Closing my SEED_DONKEYDAN_MARKET_CAP:FLOKI short in small PROFIT, 4% down in price, 40% + on leverage, not tragic, not what I wanted, but due to CRYPTOCAP:BNB strenght and HIDDEN bullish RSI divergences, even on the 8-hour chart.
OBV showing good accumulation, so no point in holding this short, it was pretty close to TPs, but now making a higher low with thr divergence.
Also reclaimed and retested 50 MA, so definitely BULLISH at least short-term.
👽💙

$FLOKI (DAILY): SHORT position opened yesterday, CORRECTSEED_DONKEYDAN_MARKET_CAP:FLOKI SHORT yesterday ($0.0000775) while 99% of crypto twitter was BULLISH just based on one tweeting-session by Elon. That's how stupid this industry is.
8% down in price, obviously this is leverage, so it needs to be managed as new data flows in.
My STOP LOSS remains at $0.0000852, but I close manually if we see a strong candle close above $0.00008.
Capital protection is key as markets are on the brink of a collapse due to CRYPTOCAP:BTC weakness.
HIDDEN bearish OBV divergence on the HOURLY chart, a good sign.
Not far away from my TP's now.
👽💙

$FLOKI (DAILY): SHORT position triggered ($0.0000775) post TWEETSEED_DONKEYDAN_MARKET_CAP:FLOKI has triggered my SHORT position, and this is my first short since the collapse on 10/10.
Not looking good, yesterday's DAILY candle had a huge rejection wick after Musk's joke, a lot of people got trapped by this silliness, just looking at the tallest volume candle in 2025, crazy.
And the LIQUIDATIONS HEATMAP, attached, showing clearly how leverage traders joined the action very late and got all luquidated within a couple of hours.
I warned about this twice, and currently in this SHORT. Stop loss set on my chart, two TAKE PROFIT levels: at the falling SUPPORT and around the previous swing low, let some run and see.
The WEEKLY chart versus CRYPTOCAP:BTC is super interesting, FLOKI at long-term support and possibly looking to start an UPTREND or at least a relief-rally.
It's a long-term chart vs BTC though (on X, cannot add more images here) , promising, but not short-term.
Short-term, the continuation of medium-term decline is the most likely.
💙👽

$FLOKI (DAILY): one ELON'S tweet right at LONG-TERM SUPPORT...SEED_DONKEYDAN_MARKET_CAP:FLOKI had some nice BULLISH OBV divergences recently, I talked about them last SATURDAY as last hopium as the price was retesting 'LAST-DITCH' long-term horizontal support ($0.0000591).
I was going to cut losses below the support only, and woke up to a +25% on my SPOT position today due to a tweet by Musk.
It looks like he might have been into #FLOKİ for a longer while, too, never knew that. The timing of this tweet is suspicious at best, right at the long-term support.
Huge volumes today and if this pump persists, there might be much much more upside, due to the first BULLISH Market Structure change for 3 months.
At resistance now, a lot of obstacles (DEATH-CROSSED 50 and 200 MAs, the GOLDEN POCKET from below).
Overheated RSI, under resistances, post-tweet sell-off comes next, imo.
9 out of 10 times.
I will become fully BULLISH above the GOLDEN POCKET and these 2 key moving averages as support after a HIGHER HIGH.
Chasing pumps never worked for me, a retracement to $0.0000805 would be a potential entry too based on the reclaimed trendline retest (and fib 0.786).
Major resistance at $0.0000108, fib 0.5 and a zone with many previous rejections.
Selling my SPOT soon, will post a set-up to sell well.
💙👽

Floki price analysis🚀 Elon Musk is back to his old tricks!
With one tweet — he pumped #FLOKI 🐶 again.
⚠️ The bad: pure manipulation, nothing good for the market long term.
✅ The good: Elon clearly feels that this is the “window of opportunity” when just one sentence can spark a +30–50% pump 😏
📊 On the global OKX:FLOKIUSDT chart, the price has been moving in a huge channel for nearly two years.
Now it’s right in the middle zone.
✅ To confirm strength, buyers must break above the midpoint and secure a hold in the upper half of the range.
❌ Otherwise — expect a pullback to the launch rocket zone, or even lower.
🤔 What do you think — another hype tweet, or the start of a new memecoin season?
______________
◆ Follow us ❤️ for daily crypto insights & updates!
🚀 Don’t miss out on important market moves
🧠 DYOR | This is not financial advice, just thinking out loud

$FLOKI (DAILY): last-ditch SUPPORT tested, ready to exit SPOTWell, I'm properly stuck with my pre-collapse SEED_DONKEYDAN_MARKET_CAP:FLOKI SPOT buys. And things aren't looking so great after a weak bounce on FRIDAY 17...
50 MA crossing below 200 MA, so obviously a DEATH CROSS on the DAILY chart. It's just bearish, and only the last serious support that worked a few times this year - $0.000591.
Close below, and it could get much uglier. It's a BEAR MARKET coin at the moment, in a DOWNTREND, below 200 MA, bearish RSI, selling volumes increasing.
Since the 'trend is your friend', obviously not interested in this, no reason to. BULLISH OBV divergence is hopium, no distribution signs yet.
I will pull the plug on my SPOT bleeding bag of #floki below the yearly SUPPORT. Better to cut a loss than to hold thru a bearmarket, it hurts but has to be done.
💙👽

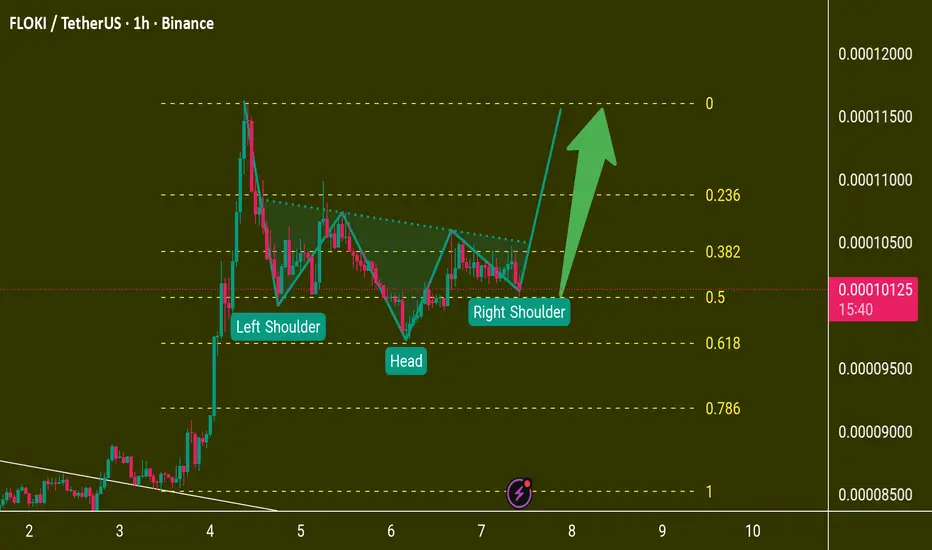
Head and shoulders pattern can perform Hi . Its seems floki is performing an head and shoulders pattern, also from the Elliott's wave theory floki is completing its micro wave 3 . I think FLOkI will attack to 0.000115 and maybe higher levels. Thank you
$FLOKI (1-D): GOLDEN POCKET - I'm buying SPOT ($0.0000995) SEED_DONKEYDAN_MARKET_CAP:FLOKI right above the GOLDEN POCKET on the DAILY chart. Buying SPOT at @ $0.0000994.
Betting on the biggest memecoin (actually not a true memecoin, more like a hybrid due to a growing ecosystem) on CRYPTOCAP:BNB is no-brainer.
I really like the chart, the FALLING WEDGE breakout (with a text-book VOLUME spike as well) , the price above both 50 and 200 SMA, RSI at 56, lots of room to start going up, even the fact that all liquidity below has been swept with plenty overhead (see attached: LIQUIDATIONS heatmap for details) to go for.
I will definitely add more once we establish an UPTREND (above $0.00011) properly, but I don't want to risk missing out as these FLOKI pumps tend to be violent.
So this is my 1st batch and there will be one more, most likely. STOP LOSS for the spot - if the falling wedge BREAKOUT fails. Simple as.
I opened a LONG position already yesterday ($0.00017), and keeping that, quoted post for details. STOP LOSS under the 200 SMA.
💙👽

FLOKIUSDT UPDATE#FLOKI
UPDATE
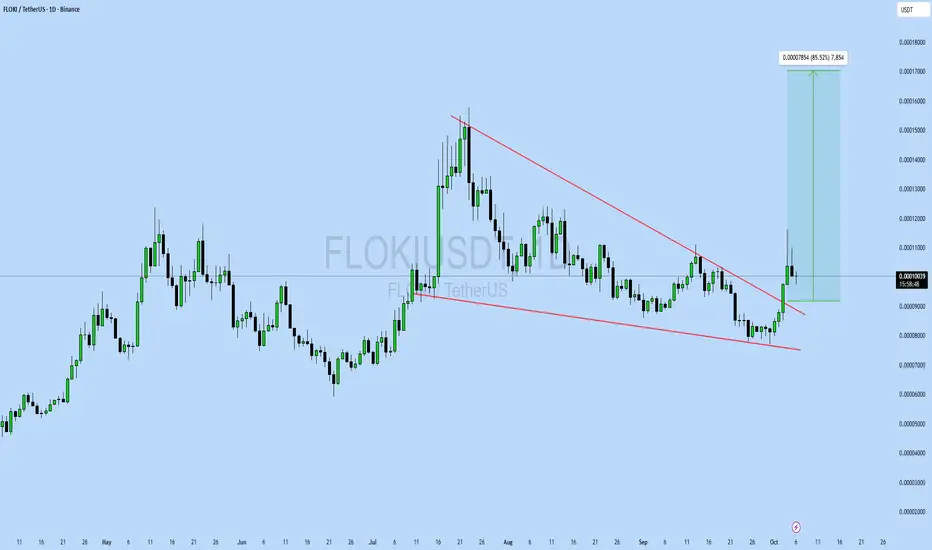
FLOKI Technical Setup
Pattern: Bullish falling wedge pattern
Current Price: $0.00014
Target Price: $0.00026
Target % Gain: 85.27%
SEED_DONKEYDAN_MARKET_CAP:FLOKI is breaking out of a falling wedge pattern on the 1D timeframe. Current price is $0.00014 with a target near $0.00026, showing about 85% potential upside. The breakout confirms strong bullish momentum with structure supporting continued upward movement. Always use proper risk management.
Time Frame: 1D
Risk Management Tip: Always use proper risk management.
$FLOKI (1-week): huge FALLING WEDGE; can this coin do 250-400%?SEED_DONKEYDAN_MARKET_CAP:FLOKI is the biggest 'memecoin' on CRYPTOCAP:BNB and now would be the best time to pay attention to it as the #Binance coin finds itself in Price Discovery.
BNB's marketcap is above $162B, meanwhile FLOKI is under a billion. Can we expect it to decisively outperform BNB in Q4?
I definitely think so. Let's have a look at the WEEKLY chart first to see where we are.
First of all, it has lost 67% of marketcap value since the ATH made last year in June ($0.000347).
Which means that if the memecoin (apparently much more than just a meme, it's a whole ecosystem in itself) only hits the current record price, it will have done 250% from here. Not bad.
The WEEKLY chart reveals a huge FALLING WEDGE pattern with the current price trading roughly at mid-point after a rejection from the 50 MA.
Also right inside a resistance zone (which acted as a support zone throughout the whole 2024).
Bullish market structure was established last July and this past week FLOKI might have put in another higher low.
Based on this macro chart, I will wait until we clear the resistance zone ($0.0001250) first. No rush, I don't long inside resistance zones.
DAILY chart next, trading view alerts set at $0.0001160 (50 MA).
Need to pay attention to this as FLOKI pumps are always explosive. 👽💙

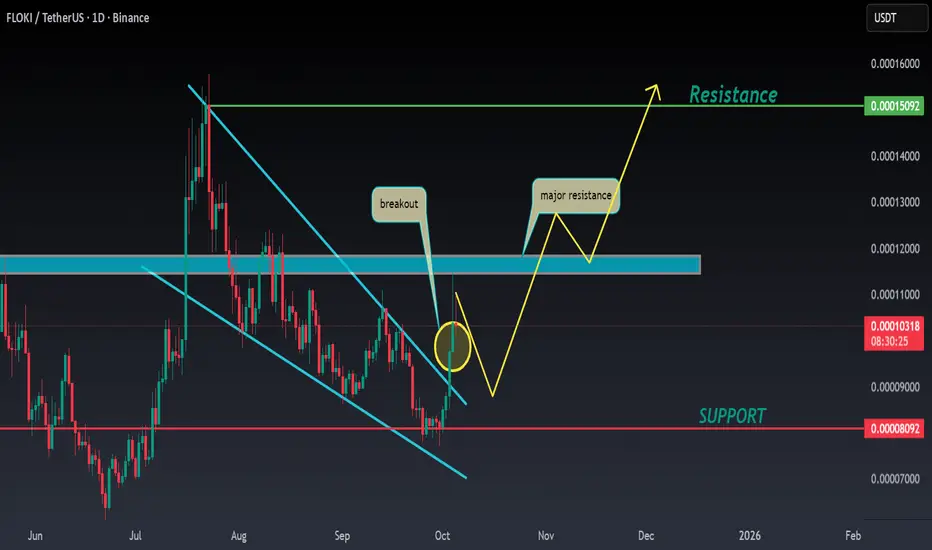
FLOKI ANALYSIS📊 #FLOKI Analysis
✅There is a formation of Falling Wedge Pattern on daily chart with a breakout and currently pullback from its major resistance zone 🧐
Pattern signals potential bullish movement incoming in few days
👀Current Price: $0.00010
🚀 Target Price: $0.00015
⚡️What to do ?
👀Keep an eye on #FLOKI price action and volume. We can trade according to the chart and make some profits⚡️⚡️
#FLOKI #Cryptocurrency #TechnicalAnalysis #DYOR
FLOKI Update📊 FLOKI Update
FLOKI is currently in an uptrend 🔥
If you’re planning to accumulate more or enter a new position, don’t rush —
💡 Wait for the price to retrace to the green zone (support area) and look for confirmation before entering long.
✅ Trade smart, not blind — patience = profits.