Long trade
4Hr TF overview
Trade Journal Entry
Pair: FLOKIUSDT
Direction: Buyside Trade
Date: Tue 30th Sept ’25
Time: 12:30 PM
Session: London to NY Overlap (PM)
Trade Parameters
Entry: 0.00007775
Profit Level (TP1): 0.00012234 (+57.35%)
Stop Level: 0.00007694 (-1.40%)
Risk-Reward (RR): 55.05
Chart & Structural Analysis
1. Market Context
Trade initiated during LND → NY overlap, a high liquidity window.
The market had already swept downside liquidity into the 0.000075xx zone, then reversed sharply.
Entry aligns with bullish orderflow + FVG targeting.
2. Price Action & Liquidity
Liquidity Grab: Previous Tokyo & London lows taken before the upside move.
Support Zone: Key demand confirmed around 0.000077xx.
Stop: Placed just under liquidity pool at 0.00007694, making invalidation tight.
3. Fair Value Gaps (FVGs)
Multiple stacked FVGs above entry:
First magnet: 0.000091xx
Mid-term magnet: 0.000103xx
Expansion target: 0.000118xx → 0.000122xx
4. Moving Averages
50 EMA (blue) curling upward post-consolidation.
200 WMA (yellow) flattening, preparing for bullish crossover.
5. Trade Narrative
This position is positioned as a high-conviction asymmetric long:
Small downside exposure (1.40% stop).
Large expansion potential (+57%).
Clear inefficiencies above to draw price.
In-Session Update (as of 4th Oct ’25)
Price trading ~0.000112xx, already +44% from entry.
Structure shows bullish continuation, with higher lows forming after the breakout.
As long as price sustains above 0.000096xx (mid-structure support), TP1 remains highly probable.
Market insights

Floki will hit 0.00016 very soon , bulls are ready !!!Floki is ready for pump to 0.00016 , Elliott waves theory also telling us that we are completing micro wave 3 from main wave 3 . Be Ready for high levels. See the chart for more details.

Flokiusdt is now near major weekly supports wait for gainTake a look at chart two major weekly support + that major support which is green trendline now are ahead and pump from here is expected like green arrows and easy +200% may cook soon.
DISCLAIMER: ((trade based on your own decision))
<<press like👍 if you enjoy💚

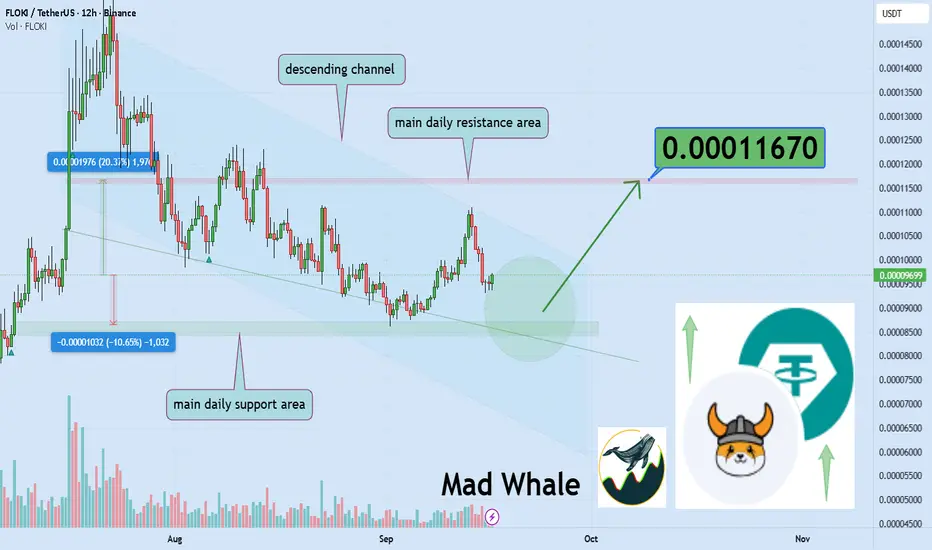
Floki Eyes Key Support: Potential 20% Upside Toward 0.000116Hello✌️
Let’s analyze Floki’s price action both technically and fundamentally 📈.
🔍Fundamental analysis:
FLOKI’s Valhalla game already hit over 1M transactions and 125K NFTs.
With more players and a $75K tournament, FLOKI could see more real use, not just meme hype 🎮
📊Technical analysis:
Floki is trading inside a descending channel, approaching key support and the daily trendline 📉.
If these levels hold, a potential upside of ~20% could push the price toward 0.000116 🚀.
✨We put love into every post!
Your support inspires us 💛 Drop a comment we’d love to hear from you! Thanks , Mad Whale
Floki (FLOKI): About To Explode Strongly | BullishFLOKI is still moving inside the bullish channel where buyers are keeping the structure clean. The game plan remains the same; as long as channel support holds, we expect continuation toward higher levels.
Swallow Academy

$FLOKI is building strong momentum.📊 SEED_DONKEYDAN_MARKET_CAP:FLOKI Respecting the trendline support with a perfect retracement, last week’s FVG fill confirmed by a doji candle. OB zone also holding firmly, adding more confluence to this bullish setup.
📈 Next key resistance is at $0.15770. A breakout above this level could open the door for a massive rally. This setup is not one to miss.

# $ FLOKIUSDT Trade Plan & Price ProjectionFLOKI/USDT Trade Plan & Price Projection
🕐 Time Frame: 1 Hour
📊 Trend: Bullish
🔎 Divergence: None
📅 Chart Date: September 14, 2025
🔹 Market Structure:
FLOKI is currently forming a bullish market structure on the 1H chart.
Price has been consistently making Higher Highs (HH) and Higher Lows (HL), confirming an uptrend.
A fresh HL has recently formed at support, indicating potential for another leg up.
🔹 Trade Setup:
Buy Stop: 0.00010544
Stop Loss: 0.00010302
Take Profit 1 (TP1): 0.00010764
Take Profit 2 (TP2): 0.00011005
Price is currently consolidating within a support zone marked in blue, offering a low-risk entry near structure. The stop loss is placed just below the support area to protect capital if the bullish structure fails.
🔹 Indicators & RSI:
RSI is currently hovering around 44.95, below the 50 mark, showing mild bearish momentum but still within a neutral range.
Previous Bearish Divergences were observed but have played out.
No divergence is currently present, which aligns with the bullish continuation possibility.
🔹 Key Notes:
Break above 0.00010544 would confirm bullish continuation.
Targets align with previous swing highs and Fibonacci extensions.
A break below 0.00010302 would invalidate this setup and suggest reevaluation.

FLOKI --> +30% I forgot this one too: SEED_DONKEYDAN_MARKET_CAP:FLOKI +30% 🔥📈
My setup accuracy is unreal!!!

FLOKIUSDT UPDATE#FLOKI
UPDATE
\ SEED_DONKEYDAN_MARKET_CAP:FLOKI Technical Setup
Pattern: Bullish Falling Wedge
Current Price: $0.00010439
Target Price: $0.00012500
Target % Gain: 30%+
Technical Analysis: FLOKI has broken out of a bullish falling wedge pattern on the 4H timeframe with strong momentum. Price is holding above resistance turned support, confirming breakout strength with potential for upside continuation.
Time Frame: 4H
Risk Management Tip: Always use proper risk management.

FLOKI/USDT Weekly Analysis
🔹 Current Price: 0.00009710 USDT
FLOKI is trading inside a short-term ascending channel. However, price has already tested the channel’s upper boundary three times without a successful breakout, which increases the probability of a breakdown to the downside.
📊 Key Supports:
• 0.00008000 USDT – first major support inside the channel
• 0.00005986 USDT – critical support (losing this level could trigger a deeper sell-off)
📊 Key Resistances:
• 0.00013882 USDT – first resistance
• 0.00023000 USDT
• 0.00035000 USDT
📈 Bullish Scenario:
If price holds above 0.00008000, buyers may push FLOKI toward 0.00013882. A breakout above this resistance could confirm strength and open the way to higher levels (0.00023000 – 0.00035000).
📉 Bearish Scenario (more likely at this stage):
Multiple rejections from the channel top suggest weakness. If 0.00008000 breaks, price could retest 0.00005986. Losing this level would expose FLOKI to further downside, potentially toward 0.00004000 – 0.00003000.
⸻
✍️ Conclusion:
FLOKI is at a decisive zone.
• Holding above 0.00008000 keeps the bullish scenario alive.
• Breaking below 0.00008000 increases the risk of a strong bearish move.
⸻
📌 #FLOKI #Crypto #Altcoins #TradingView #TechnicalAnalysis #CryptoTrading

FLOKI - Accuracy on point again! SEED_DONKEYDAN_MARKET_CAP:FLOKI - setup shared few days ago! Accuracy - on point! 🔥
Almost 2 Month downtrend breakout ✅
Price might continue to climb toward 0.00010800 - 0.0001100$ (previous view) 📈
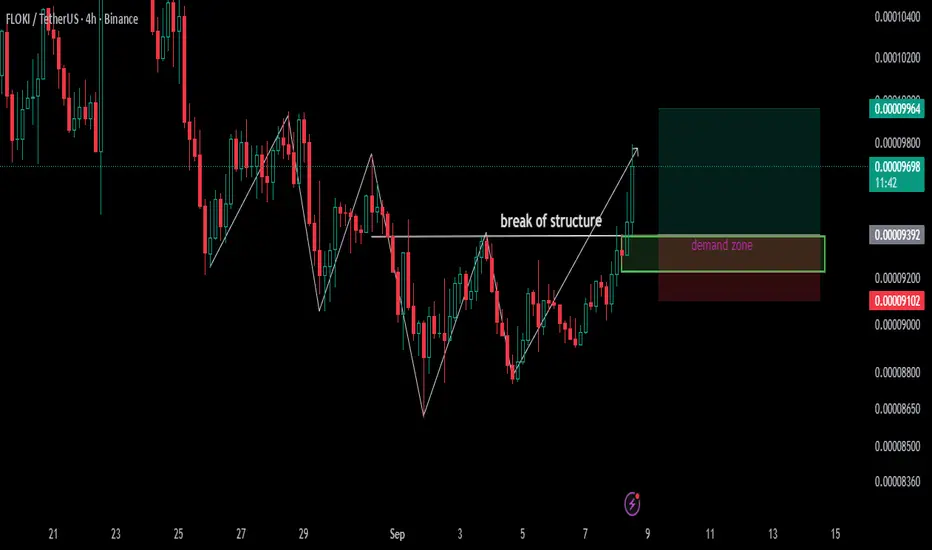
break of structure didn't lie it time for BULLS. wait for retestFlokiustd ,, market structure shifted form lower highs , lower lows to higher high and higher lows , if you want to a pin point trade wait for retest on DEMAND zone, then go for it but put stop loss on below demand
Floki coin (FLOKI): Looking For Good Bounce From HereFLOKI is still moving cleanly inside the ascending channel, with each touch on the trendline giving us a solid reaction. Once again, price is holding the lower trendline support, which has been tested multiple times and respected every single time.
As long as buyers hold this structure, the game will be to look for entry which would be ideal once we see MSB (market structure break) — we are looking for trend reversal to the upside. Our target is upper side of bullish channel, where we expect the next strong reaction.
Swallow Academy

FLOKIUSDT — Demand Zone Retest: Major Rebound or Breakdown?Full Analysis:
FLOKI is currently facing a make-or-break moment as price revisits the daily demand zone at 0.000085–0.000091 (yellow box on the chart). Historically, this zone has acted as a strong launchpad, pushing FLOKI higher multiple times in the past few months.
However, this time the context is different. Since late July, the structure has been printing lower highs, signaling persistent selling pressure. This descending momentum forms a structure similar to a descending triangle, where repeated support tests often weaken the level. In other words, this demand zone is not just a bounce opportunity, but the ultimate battleground for FLOKI’s next trend.
---
🔹 Bullish Scenario
As long as FLOKI holds above 0.000085–0.000091, the chance for a rebound remains alive.
First bullish trigger: a daily close above 0.0001024 (key S/R flip). This would confirm strength and shift short-term momentum.
If confirmed, upside targets are layered at 0.0001209 → 0.0001534 → 0.0002006, with an extended move potentially reaching 0.0002639.
Invalidation: A daily close below 0.000085 would cancel this setup.
---
🔹 Bearish Scenario
A clear daily close below 0.000085 would confirm breakdown of the demand zone.
In this case, FLOKI could extend lower toward 0.000070 → 0.000052 → 0.0000455 (historical low).
Even weak bounces that get rejected at 0.0001024 or 0.0001209 would reinforce bearish continuation and confirm sellers’ dominance.
---
🔹 Pattern & Structure
FLOKI is showing descending pressure into a flat support — a structure often seen in descending triangles.
Statistically, this pattern leans bearish. But traders must watch closely:
A false breakdown below support, followed by a sharp recovery, could trigger a short squeeze rally.
A clean reclaim of 0.0001024 would strongly shift sentiment back to the bulls.
---
🔹 Strategy & Risk Management
Long idea: Aggressive entries inside the demand zone with a tight stop below 0.000085. Conservative entries wait for confirmation above 0.0001024.
Short idea: Either wait for a confirmed daily close below 0.000085, or look for strong rejections at 0.0001024/0.0001209.
Keep in mind: FLOKI is a high-volatility asset, so position sizing and stop placement are critical.
---
📌 Conclusion
FLOKI is at a critical crossroads. The 0.000085–0.000091 demand zone is the last stronghold that separates a potential major rebound from a deeper breakdown. The market’s reaction here will likely define FLOKI’s mid-term trend for the coming weeks.
#FLOKI #FLOKIUSDT #Altcoin #Crypto #TechnicalAnalysis #PriceAction #SupportResistance #DemandZone #BullishScenario #BearishScenario

FLOKI: Keep an eye on this level! Trading Setup
If you’re considering trading FLOKI, here’s a quick setup that may help you.
The idea is: Buy when the price breaks above $0.0001135 and take profits at the levels shown in the chart.
Targets:
1. $0.0001152
2. $0.00012
3. $0.000124
-------------------------------------------
About our trades:
Our success rate is notably high, with 10 out of 11 posted trade setups achieving at least their first target upon a breakout price breach (The most on TW!). Our TradingView page serves as a testament to this claim, and we invite you to verify it!

Floki- Symmetrical Triangle, Big Move aheadFLOKI has been consolidating for months inside a symmetrical triangle on the daily chart. The range is getting tighter, suggesting a large breakout move is near.
🔹 Pattern
Higher lows + lower highs forming a triangle structure.
Volume gradually declining, a typical pre-breakout signal.
🔹 Key Levels
Support (lower trendline): 0.0000100 – 0.0000105
Resistance (upper trendline): 0.0000125 – 0.0000130
🔹 Targets on Breakout
Bullish breakout: 0.0000140 → 0.0000160 → 0.0000185
Bearish breakdown: 0.0000090 → 0.0000075
📌 Outlook:
FLOKI is in a make-or-break zone. A daily close above 0.0000130 with volume could fuel a strong bullish rally. Failure to hold support at 0.0000100 may lead to downside.


$FLOKI: my green zones are back. Time to refill our bags.SEED_DONKEYDAN_MARKET_CAP:FLOKI is a solid meme coin backed by a long-standing, loyal community and an actively developed metaverse/GameFi project.
With strong tokenomics and a medium-cap profile, SEED_DONKEYDAN_MARKET_CAP:FLOKI is capable of delivering explosive upside bursts.
If it re-enters my green buy zone, wait for it to touch the bottom before entering — historically, this level has produced strong bounces and solid profit opportunities.
⚠️ Reminder: Always take profits on the bounce. Meme coins like SEED_DONKEYDAN_MARKET_CAP:FLOKI are better suited for short- to mid-term trades, not long-term holding, as they often retrace sharply after a pump.
------------------------
The altcoin market just saw a solid pump, following the massive CRYPTOCAP:BTC and CRYPTOCAP:ETH institutional billion-dollar purchases.
On the Daily timeframe, we’re actually printing higher lows, showing clear market strength. The top of the range was rejected, and now it’s highly probable that the crypto market will enter a consolidation phase — a move that could push several altcoins into my buying zones.
💡 Reminder: My buying zones are areas where it’s statistically safer to buy and hold, with an almost guaranteed chance of making a solid profit on the next bounce.
What could spark the infamous Altseason?
Many altcoins share one thing in common: a major resistance line (marked in yellow). For them to pump to the moon, this line needs to be broken.
We’re also seeing a price compression — meaning the breakout could be imminent. This pullback might be your last chance to enter a long position before the real Altseason kicks off.
Possible Altseason catalysts:
📉 FED Interest Rate Cut of 1% or more.
📈 Institutional adoption through altcoin index ETFs — imagine BlackRock launching ALT10, ALT50, ALT100 ETFs, attracting massive institutional money into the altcoin market.
I believe both events could happen before the end of the year.

loki Tests Last Support, Could Rally 30% Toward 0.000135Hello✌️
Let’s analyze Floki’s price action both technically and fundamentally 📈.
🔍Fundamental analysis:
FLOKI's Valhalla game just hit 1M+ transactions and burns tokens with each NFT use. If daily players grow past 50K, FLOKI’s supply could shrink faster and that might boost demand.
Just like what we saw with AXS back in the day. 🎮🔥
📊Technical analysis:
BINANCE:FLOKIUSDT has lost key Fibonacci supports, with daily support as its last defense. Holding this level could lead to a 30% rally targeting 0.000135. 📉🔥
✨We put love into every post!
Your support inspires us 💛 Drop a comment we’d love to hear from you! Thanks, Mad Whale

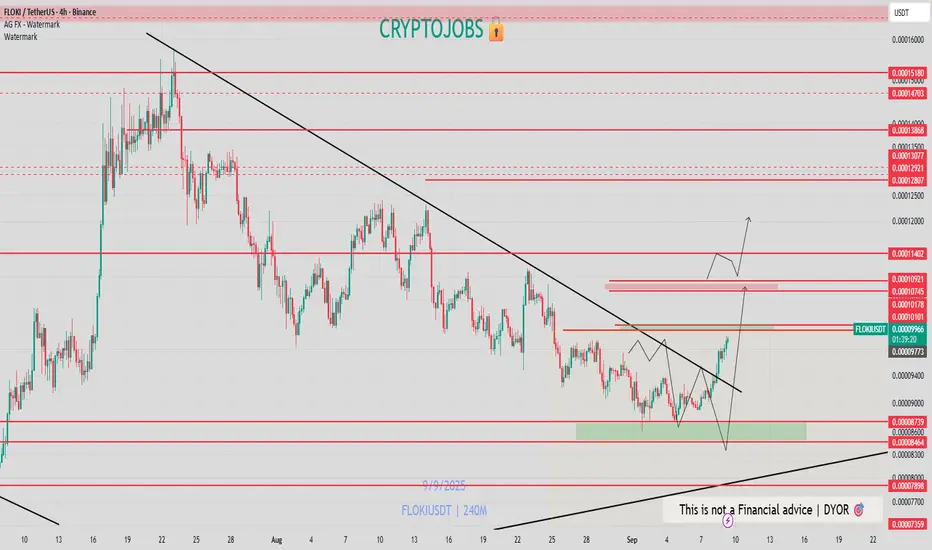
FLOKIUSDT near major daily support & pump hard after breakoutMajor resistances which stop the price from more pump now are 1.Red trendline 2.0.00020$ resistance zone and i think both can soon break and after that market would be extremely bullish after a while.
DISCLAIMER: ((trade based on your own decision))
<<press like👍 if you enjoy💚

FLOKI : Will growth continue or will prices be dumped?Hello friends🙌
✅Well, this meme coin grew well when it was first created and surprised everyone, and now that some time has passed since its creation, it has been listed on an exchange and we are going to examine together what effect it has on its price.
✅Well, when this meme coin was first created, it grew well and has given good profits to its holders so far. Now that it is listed on an exchange and more transactions are taking place, it will definitely be impressive, but the chart always has the final say.
So what does the chart tell us?
✅In the 30-minute time frame, which is considered a short-term time frame, we had a decline due to the decline in the entire market, and the price was supported in the specified support area, but not definitive support.
✅Several channels have been drawn so that in the event of a break from above or below, we can understand whether the power is in the hands of buyers or sellers.
Now, if the buyers show their strength, which they did to some extent (a trendline break and a strong pullback), we can buy in the specified areas with risk and capital management and move with it to the upcoming goals.
📉If buyers cannot dominate the price and sellers dominate more, we should wait for lower support areas.
⚠Don't forget risk and capital management, friends.⚠
🔥Follow us for more signals🔥
*Trade safely with us*

FLOKI ready to strike after big accumulationWe see a nice full correction phase on this token, also big buyside liquidities which can cause an impulsive upside move and distribution near ATH prices

Examples of Conditions for Starting a Trade
Hello, fellow traders!
Follow us to get the latest information quickly.
Have a great day!
-------------------------------------
This time, I'm going to talk about when to start and when to close a trade.
Trading has no beginning or end.
In other words, you can start a trade at any time and close it at any time.
The only question is whether you can profit from the time you start the trade and when you close it.
Therefore, it's best to be clear about why you need to start trading.
In other words, you need to be able to explain why you need to start trading now.
If you can't, it's best not to start trading.
You should also be able to explain why you're closing the trade now or selling in installments.
If you can't, it's likely that you don't have a well-established trading strategy.
A trading strategy should be developed from a broad perspective.
After that, you should develop a detailed response strategy that stabilizes your psychological state according to price volatility and guides your trading accordingly.
Therefore, a basic trading strategy is essential.
This basic trading strategy may vary depending on your investment style, so it's important to establish a basic trading strategy that suits you.
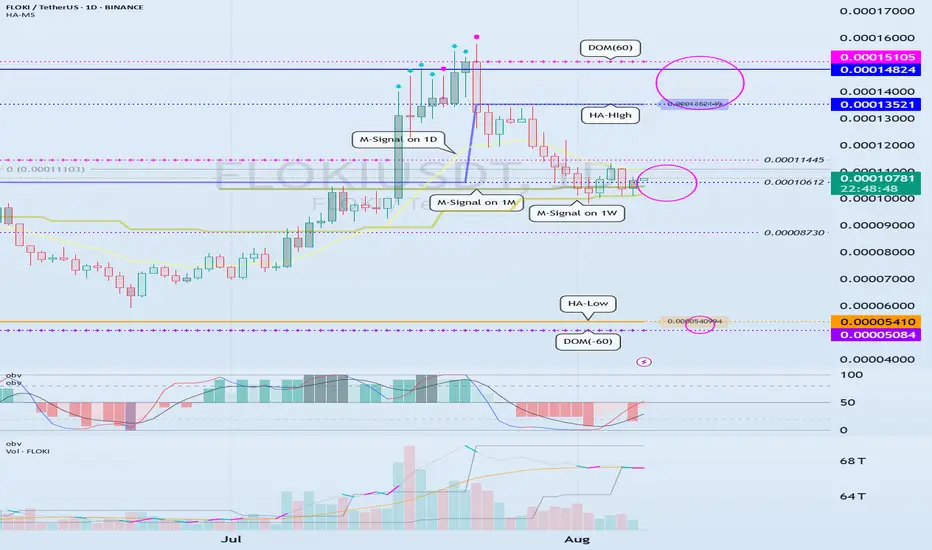
My basic trading strategy is to buy in the DOM(-60) ~ HA-Low range and sell in the HA-High ~ DOM(60) range.
------------------------------------------------------------------------------
To initiate a trade, you can determine whether support is available at important support and resistance levels or areas.
The optimal range for this is when support is found and the price rises in the DOM (-60) ~ HA-Low range.
This corresponds to the conditions for trading on the Heikin-Ashi chart.
-
Next, the M-Signal indicators on the 1M, 1W, and 1D charts converge and break upward, sustaining the price.
In other words, the price rises when support is found around the current price range of 0.000010612-0.00011445.
This represents an important turning point from a trend perspective.
-
If you bought in the above range, the sell range would be 0.00013521-0.00014824.
This sell zone corresponds to the high point, HA-High ~ DOM(60).
This means that a stepwise uptrend, or a full-blown uptrend, is likely to begin only when the price rises above the HA-High ~ DOM(60) range.
-
If you start trading at other support and resistance points or zones, it can be difficult to respond to price volatility.
Therefore, it's best to check for support and initiate trading within the DOM(-60) ~ HA-Low and HA-High ~ DOM(60) zones, if possible.
From a trend perspective, if the M-Signal indicators on the 1M, 1W, and 1D charts converge, and the price breaks upward and sustains, as is currently the case, trading is possible if support is found at the support and resistance levels near those points.
While this trading method cannot guarantee profit, it is worth developing a trading strategy and attempting it.
-
Thank you for reading to the end. I wish you successful trading.
--------------------------------------------------