FLOKIUSDT trade ideas

FLOKI: Keep an eye on this level! Floki had a nice cool-off, and it could be ready to bounce back harder! If you're looking to trade FLOKI at the moment, here's a quick setup that you might find helpful!
The idea is: Buy when the price breaks above 0.000268$ and take profits at the levels shown in the chart.
Targets:
1. 0.000279$
2. 0.0002315$
3. 0.00034$
4. 0.0004$
-------------------------------------------
About our trades:
Our success rate is notably high, with 10 out of 11 posted trade setups achieving at least their first target upon a breakout price breach (The most on TW!). Our TradingView page serves as a testament to this claim, and we invite you to verify it!

#FLOKI/USDT#FLOKI
We have a descending channel pattern on the 4-hour frame, the price is moving inside it and adhering to its borders well
We have a support area in green at a price of 0.000150 after the price touched it and rebounded from it
We have a trend to stabilize above the moving average 100
We have a downtrend on the RSI indicator that supports the price upwards
Entry price 0.0001641
First target 0.0001914
Second target 0.0002530
Third target 0.0002970

Double Top on $Floki Chart?We can clearly see the MACD lines crossing and this week's candle looking to close below the EMA 50 line, coupled with the double top; all signs call bearish for the next few weeks. Looking to open a short on floki.

FLOKI FLOKI sweep the channel pattern high side liquidity. So downside movement was high possible.
Or If FLOKI moving countinues upside, next mitigate orderblock (1&2) to moving downside is high possible.
Because the trend was still bearish.

FLOKI FLOKI sweep the channel pattern high side liquidity. So downside movement was high possible.
Or If FLOKI moving countinues upside, next mitigate orderblock (1&2) to moving downside is high possible.
Because the trend was still bearish.

⚜️FLOKI: Dogs Of ValhallaFloki is a cryptocurrency that initially started as a meme-coin inspired by Elon Musk's Shiba Inu dog but has evolved into a fully-fledged web3 project that spans across decentralized finance (DeFi), NFTs, and the Metaverse. It operates on both the Ethereum and Binance Smart Chain (BSC) blockchains, making it an ERC-20 and BEP-20 compliant token. Floki has a 3% tax imposed on buying and selling the token, which is directed towards the Floki Inu treasury to develop the ecosystem further and increase its adoption. The project aims to educate the growing audience on crypto through its metaverse university while also establishing Floki as a payment alternative to traditional currencies and other cryptocurrencies. Despite its ambitions, Floki faces challenges in gaining widespread adoption on other DeFi platforms and NFT marketplaces. The total supply of FLOKI tokens is 10 trillion, and the community regularly votes to buy back and burn tokens to preserve the asset's value. BINANCE:FLOKIUSDT

FLOKI FLOKI was moving sideway range. No any further movements and creating channel pattern.
So FLOKI is hunting channel pattern high side liquidity to moving downside is high possible.

FLOKIUSDT 1DAn ascending channel formation is visible on the #FLOKI daily chart. It has bounced off the ascending support line, indicating a potential continuation of its upward movement. The targets are:
$0.00021955
$0.00025342
$0.00028729
$0.00033552
$0.00039695

FLOKI FLOKI chart showing short term upside momentum. FLOKI mitigating orderblock (1&3) to moving upside.
It's indicating trend reversel. But still order block (2) and Inducement (💎) was available.
So FLOKI moving definitely upside and mitigating orderblock (2) to moving some downside is high possible.

FLOKI TIME TO RECOVER?Floki is approaching main trendline and it's showing a potential bullish pattern. In order to pump, .158 must hold. I expect the price to range for the next hours, and to look for a long i would like to see the price to break above the main trendline and retest it. First possible target the resistance area at .205

#FLOKI arrives at the buying area📊#FLOKI arrives at the buying area✔️
🧠After completing the daily level target, we made corresponding level corrections and have now reached the buying zone. From a structural perspective, if we move higher from here and continue above the previous high, it will create a bullish cup-and-handle structure. If all goes as expected, the ultimate target could see 0.00061250-0.00079705.🎯
Let's see 👀
⚠️Don’t forget risk management⚠️
✔️Trade Security✔️
🤜If you like my analysis, please like 💖 and share 💬
💕 Follow me so you don't miss out on any signals and analyze 💯
BINANCE:FLOKIUSDT

FLOKI - Retesting 200ema 4h timeframe before going up?Hello guys,
welcome to my new FLOKIUSDT Analyse.
After the last highs, its possible that we will retest our 4h 200ema on 0.00022-0.00024 before we going up again.
If the 200ema is broken downward, we can get lower prices.
Check out the next days and watch for the new FED Data on wednesday this week.

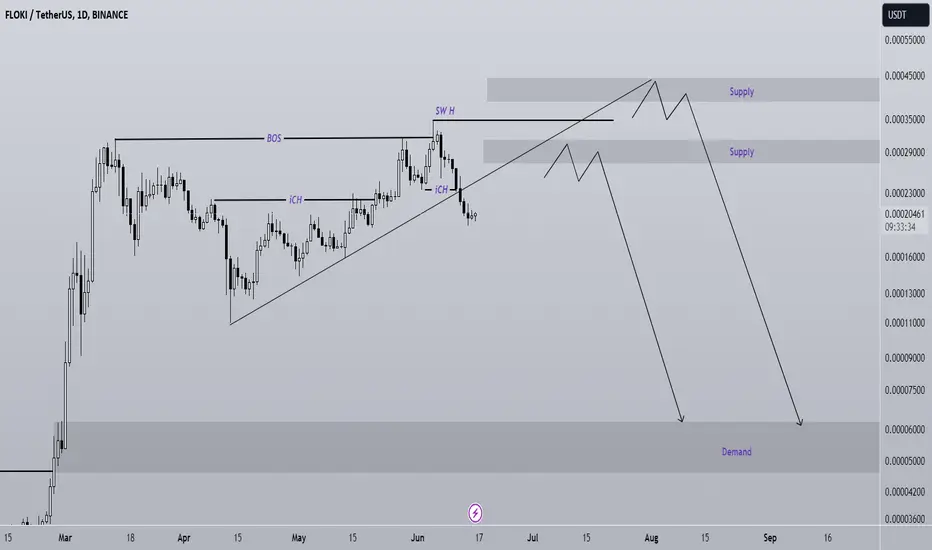
FLOKI analysisAfter the bearish iCH in the internal structure, the price has created an internal pullback.
A trend line has also been broken, but the bullish momentum is very high. FLOKI's bearish trend is expected to be created from one of the two specified supplies.
By maintaining the resistance swap range, it can drop towards the targets.
The target can be demand at the bottom of the chart
Note that the financial market is risky, so:
Do not enter any position without confirmation and trigger.
Do not enter a position without setting a stop.
Do not enter a position without capital management.
When we reach the first TP, save some profit and try to move the stop continuously in the direction of your profit.
If you have any comments please post them, comments will help us improve our performance
Thanks

FLOKI: A big bounce is coming!FLOKI has seen a rapid cool-off in the past few days, and a more significant bounce could be around the corner! If you're looking to trade FLOKI at the moment, here's a quick setup that you might find helpful!
The idea is: Buy when the price breaks above 0.0002533$ and take profits at the levels shown in the chart.
Targets:
1. 0.000265$
2. 0.000283$
3. 0.0003$
-------------------------------------------
About our trades:
Our success rate is notably high, with 10 out of 11 posted trade setups achieving at least their first target upon a breakout price breach (The most on TW!). Our TradingView page serves as a testament to this claim, and we invite you to verify it!

FLOKIUSDT.4HExamining the 4-hour chart for FLOKI/USDT offers a detailed glimpse into its current technical landscape, allowing for an informed analysis.
Price Action: FLOKI/USDT is currently trading at 0.00024018, showing a slight increase of 1.99%. The chart indicates a pattern of higher lows, which could be viewed as a bullish signal. However, the price is presently near the support level S1 at 0.00018637, which needs to hold to maintain the upward trajectory.
Resistance Levels: The immediate resistance level R1 at 0.00033719 appears to be a significant barrier from past price interactions. The upper resistance R2 is set along an upward trendline, suggesting that if the price breaks above R1, it may find dynamic resistance as it ascends along this line.
Support Levels: The noted support at S1 is crucial; a breach below this could signal a shift in market sentiment to bearish, potentially leading to further declines. The support levels are critical for determining where buyers repeatedly enter the market, stabilizing the price.
Moving Average Convergence Divergence (MACD): The MACD indicator is below the zero line, which traditionally suggests bearish momentum. However, the MACD line is converging towards the signal line, indicating that the downward momentum may be losing strength, and a potential bullish crossover could occur if the trend continues.
Relative Strength Index (RSI): The RSI stands at 37.22, which is close to the oversold territory (below 30). This suggests that there might be potential for a bullish reversal as the market perceives FLOKI as undervalued.
Conclusion:
The technical outlook for FLOKI/USDT suggests cautious optimism. The near-oversold RSI and the converging MACD indicate potential for a reversal, but the key will be whether the support at S1 holds. If the price sustains above S1 and experiences a bullish MACD crossover, there could be an opportunity to target R1 as the next resistance level. However, if S1 fails, the sentiment might turn bearish, leading to a further decline. Traders should consider setting stop-losses below S1 to manage risk while preparing for a possible ascent towards R1 if upward momentum gains confirmation through technical indicators.

Sniper Entry For $FLOKIWas stopped out of my previous entry but this should be a good price to get into the CRYPTOCAP:FLOKI train as the price should push higher from here. CPI news should restore bullish sentiments to the crypto space and we should see CRYPTOCAP:BTC try and break the $72k resistance.

FLOKIUSDT.1DAnalyzing the FLOKI/USDT daily chart, I can see that the price recently peaked at a resistance level marked as R1 and is now retracing. I have drawn a green upward trendline that has been supporting the price movement; however, the current price action suggests a potential test of this support.
If the support holds, I anticipate a rebound towards the R1 level and potentially a move higher to R2. The Moving Average Convergence Divergence (MACD) shows a negative divergence as the MACD line is below the signal line, suggesting bearish momentum in the short term. Additionally, the Relative Strength Index (RSI) is around 54, indicating neither overbought nor oversold conditions but nearing the median, which aligns with a possible consolidation or retracement phase.
Based on the technical indicators and recent price behavior, my conclusion is that the market might experience further downward pressure in the near term. However, the support level delineated by the trendline and the S2 support zone should be monitored closely. A break below these could confirm a bearish trend, while a rebound from them could lead to a recovery back towards R1. The key will be how the price reacts to the trendline in the coming days.

$FLOKI is only Meme Showing strengthHello everyone,
Scanned through all meme coins between CRYPTOCAP:SHIB FWB:PEPE $FLOKI and Floki shows best strength.
Checkout chart. 📈
Stop loss is your best friend and good luck 🙏

#FLOKI/USDT is trying to break the Diagonal Trendline in 1-Hour #FLOKI/USDT is trying to break the Diagonal Trendline in 1-Hour TF!
In case of breakdown/retest to long it. Wait for bullish momentum to open a long position. The local resistance level is PDH 0.000287.

FLOKIUSDTFLOKIUSDT is in strong bullish trend.
As the market is consistently printing new HHs and HLs.
currently the market is retracing a bit after last HH, which is 50% Fib retracement level and local support as well. if the market successfully sustain this buying confluence the next leg up could go for new HH.
What you guys think of this idea?

FLOKI is Ready To Push Higher!Hello TradingView Family / Fellow Traders. This is Richard, also known as theSignalyst.
📈 FLOKI has been overall bullish, trading within the rising wedge in orange.
Currently, FLOKI is undergoing a correction phase and it is currently approaching the lower bound of the wedge.
Moreover, it is retesting strong demand zone marked in gray.
🏹 Thus, the highlighted blue circle is a strong area to look for trend-following buy setups as it is the intersection of the gray demand zone and lower orange trendline acting as a non-horizontal support.
📚 As per my trading style:
As #FLOKI approaches the blue circle zone, I will be looking for bullish reversal setups (like a double bottom pattern, trendline break , and so on...)
📚 Always follow your trading plan regarding entry, risk management, and trade management.
Good luck!
All Strategies Are Good; If Managed Properly!
~Rich
