Re evaluation of the US2000Re evaluation of the US2000
Ive entered a big short now with aim of 1400.
Small break through bottom of channel today and feel FED pumping will stop but continue nearer election.
But if it carries on climbing past 1610-1620 then re-access next week.
US2000 trade ideas


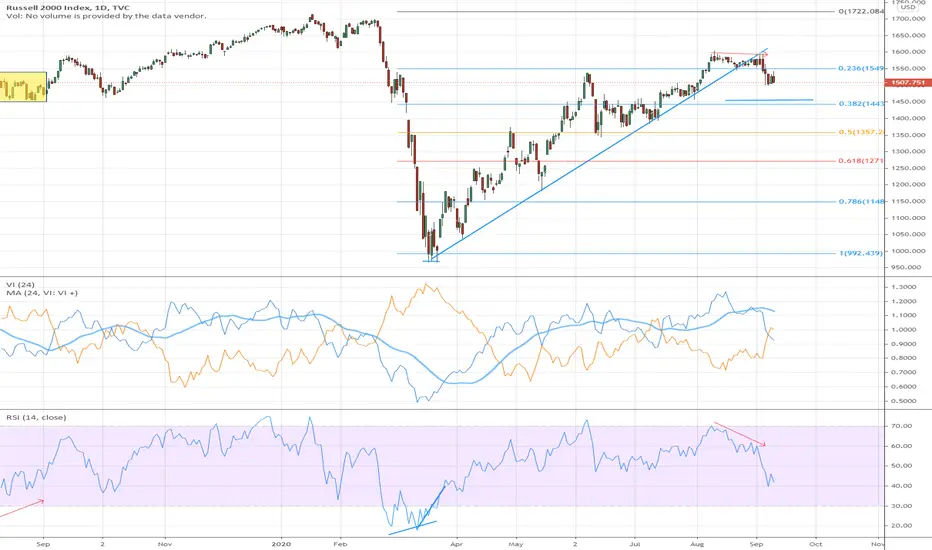
RUT Russell Small CapsSmall caps have not been as enthusiastic about the rally as tech and SPX in the run up since March. We see that it's been making lower lows and lower highs since August 11 peak, and RSI has been showing continuing weakness on the daily chart. If SPX is going to have a meaningful sustainable rally, it's going to need the small caps and financial sector to follow suit. This has not been the case.

RUT End Of Week EvaluationTrend Analysis:
The current trend is defined by the last price and it's relationship to specific moving averages.
Check the MA strategy for more specific suggestions.
Weekly: The relationship to the primary trend MA is bullish. The price in relationship to the other averages suggest hold current position but prepare to close, ensure stops are placed.
Price Action:
Weekly: The average price range currently is 86.25 points/ticks/pips. Prices are currently .70x the normal trading range. Prices are trading within the mean range for activity. This generally indicates a consolidation of strength/indecision in the market regarding direction.
Prices are currently caught in consolidation between 1483.37 and 1603.60.
While in consolidation the trade range may decrease to 53.147999999999996 points/ticks/pips.
Standard Deviation
Weekly: Standard deviation suggests a range from 1443.52 to 1630.04 for the following week.
Calculated Price Strength:
The strength of the trend in conjunction with specific averages
Weekly: Trend strength suggests a trade range of 1483.48 to 1590.08 for the following week.
Price Projection:
The price action has generated a projection signal for the underlying.
Weekly: Price currently displays (if strength and attitude continue) a desire to move toward 1590.61
If strength and attitude continue, it could take between 1 to 2 trade periods (weeks) to reach the projection.
Indicators Summary.
A collection of technical indicators whose directional attitude has been summarized.
Weekly: Out of the cumulative indicators monitored, 80.00% are bullish, 0.00% are bearish, 20.00% are neutral
The CCI indicator trading strategy suggest the following:
Weekly: Bullish - cover longs.
Confirmation Signal
6 indicators combined to confirm entry/exit.
Weekly Bullish - Open directional trades

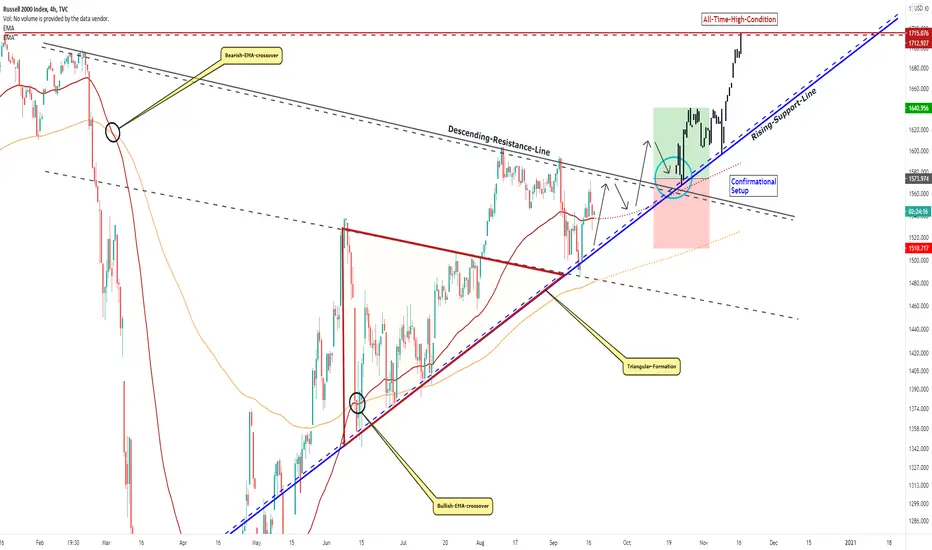
RUSSELL 2000, Above Preliminary Level, These Steps Can Follow!Hello Traders Investors And Community, Welcome to this analysis where we are looking at the RUSSELL 2000 index 4-hour timeframe perspective, the recent events, the current formational structure and what we can expect the next times. The main market and other indices like the SPX or DOW recovered steeply from the heavy corona-breakdowns and lows established this year where they already managed to form new all-time-highs, in this case, the RUSSELL 2000 is still below the major all-time-highs established before the corona-breakdowns, this does not mean it can change, however, therefore, it is important that the index shows up with the proper price-action and don't invalidates the possible bullish scenario substantially, therefore I detected all the important levels and possible outcomes we should consider for the index and its destinies.
Looking at my chart you can watch there the triangle-formation marked in orange which already broke out to the upside where it also bounced already from the upper boundary and the blue rising-support-line marked in my chart, what is also a good sign is that the index formed a bullish-EMA-crossover already before the triangle-breakout occurred, currently, as you can watch marked in my chart the index has still resistance at the descending-resistance-line marked in grey above the level, when the index manages to move above it this will cause a decent entry setup as the index has taken out its major resistance, as you can watch in my chart, this mechanism can be entered immediately aggressive in the current price-action or conservative when the breakout occurred, although the aggressive approach is also possible the conservative should be preferred.
In this manner, thank you for watching, support for more market insight, good day to you, and all the best!
“Trading effectively is about assessing possibilities, not certainties.”
Information provided is only educational and should not be used to take action in the markets.
Russell 2000 Index update Russell trading at 1536 level
Unexpected news will come
Sell at any rally's target intact 1475.....1384 and below levels


ridethepig | Small Caps Breaking DownA timely update to the Russell 2000 after running into sellers at the 1600 resistance which was previously support. Small caps have seen a huge uptick in selling interest and momentum is starting to kick in.
Buyers giving up the diagonal support is opening up a world of trouble and asking for sellers to apply more pressure. The V shapers and naysayers that its not different this time will continue with the necessary text, the question is whether real money decides to step in and stop the bleeding. After losing support the next key level in play is 1350, and a deeper extension towards 1,175.
Thanks as usual for keeping the feedback coming 👍or 👎

RUT End Of Week EvaluationTrend Analysis:
The current trend is defined by the last price and it's relationship to specific moving averages.
Check the MA strategy for more specific suggestions.
Weekly: The relationship to the primary trend MA is bullish. The price in relationship to the other averages suggest hold current position but prepare to close, ensure stops are placed.
Price Action:
Weekly: The average price range currently is 85.851 points/ticks/pips. Prices are currently .30x the normal trading range. Prices are trading within the mean range for activity. This generally indicates a consolidation of strength/indecision in the market regarding direction.
Prices are currently caught in consolidation between 1393.89 and 1603.60.
While in consolidation the trade range may decrease to 52.53 points/ticks/pips.
Standard Deviation
Weekly: Standard deviation suggests a range from 1393.13 to 1601.42 for the following week.
Calculated Price Strength:
The strength of the trend in conjunction with specific averages
Weekly: Trend strength suggests a trade range of 1444.21 to 1550.33 for the following week.
Price Projection:
The price action has generated a projection signal for the underlying.
Weekly: Price currently displays (if strength and attitude continue) a desire to move toward 1455.21
If strength and attitude continue, it could take between 1 to 2 trade periods (weeks) to reach the projection.
Indicators Summary.
A collection of technical indicators whose directional attitude has been summarized.
Weekly: Out of the cumulative indicators monitored, 60.00% are bullish, 20.00% are bearish, 20.00% are neutral
The CCI indicator trading strategy suggest the following:
Weekly: Bullish - cover longs.
Confirmation Signal
6 indicators combined to confirm entry/exit.
Weekly Bullish - Close/Cover directional trades

$RUT Small CapsQuick look at the small caps - RUT hasn't been as enthusiastic as the SPX and the Nasdaq. We see that, while it's had its own run since the March bounce, this upward trend line has been broken below in the past few sessions. Next major support is 1450 area. As i've mentioned in my previous post, look to small caps and financials to act as a drag to any bull rallies in the SPX and tech. For the time being, technical indicators doesn't seem to support a bounce or a rally in small caps.


US2000 long (1 hour bullish pin bar reversal signal)there is an massive 1 hour bullish pin bar signal reacting with the long term bullish trendline. Put stop loss below the pin bars wick and ride to the recent highs or even higher (assuming this thing is going to ride itself to the upside with its current momentum)

Russell2000 levelsThe Russell 2000 is showing a neutral posture. A strong market has all main indices alligend if not they will allign at some point. With end of month insight funds looking for performancce might chase index components as they are lagging. Strength in the oil price would help a lot.

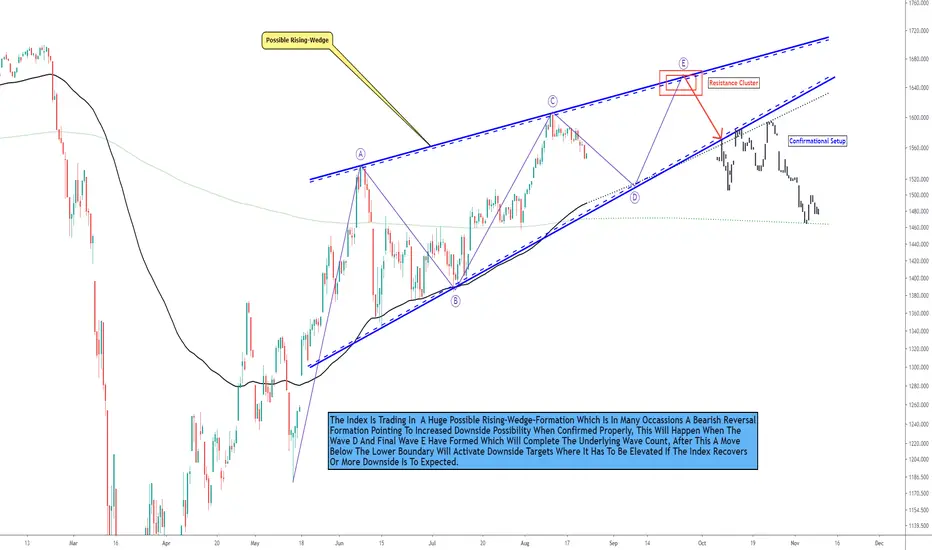
RUSSELL 2000, Possible Wedge Forming, These Are Important Level!Hello Traders Investors And Community, welcome to this analysis where we are looking at the RUSSELL 2000 Index 4-hour timeframe perspective, the recent events, the current formational structure, what to expect the next times and how to handle the upcoming situation appropriately. Similarly to other major indices, the RUSSELL 2000 has recovered from its corona-breakdowns seen this year but it is still below its all-time-high where the SPX already formed new highs which are still waiting here, furthermore we have the divergence between the real economy and stock-market already going as well as people already talking about second lock-down measures which can affect the market similarly to these breakdowns seen this year because the real economy will decrease which can have an effect on the stock market as well, therefore, I detected the importances which we should consider in the current index structure here.
Looking at my chart you can watch there that the index is getting slower with its upside volatility which can indicate a reversal into the other direction, furthermore, the index is forming a possible rising-wedge-formation which is often a bearish reversal formation pointing for more downside to be reached in the schedule, the formation is marked in blue within my chart and the index already touched the lower and upper boundary several times to form a coherent wave-count here which will be completed with the final wave E marked in my chart where also strong resistance is lying which can be a turning point in this environment when bearish pressure increases there this can lead to a test of the lower boundary again and a final confirmation of this possible rising wedge formation which will be fully confirmed when the price closes below the lower boundary as it is marked within my chart.
Although such formations can sometimes invalidate bullish to the upside the bearish case should be more expected here as the other factors with slower momentum and resistance coming together. When the index confirms this more likely scenario and activates downside targets at 1300 in the structure it has to be elevated how the index continues from there and if a possible recovery with back-up is possible or more decline will follow. When a back-up is considered it is from high importance that corona decreases and real economy begin to grow again otherwise this will lead to a speculative environment as many retailers coming into the market while smart-money staying on the sidelines, these facts make it clearer that we should not fully underestimate the bearish breakdown scenarios here in order to be prepared on when changes occur to take appropriate action.
In this manner, thank you for watching, support for more market insight, all the best!
"The market is a procrastinator looking forward."
Information provided is only educational and should not be used to take action in the market.
Could the RUT bull put spread be at risk here?For those trading aggressive weekly/monthly options on the RUT beware or get WHACKED :)


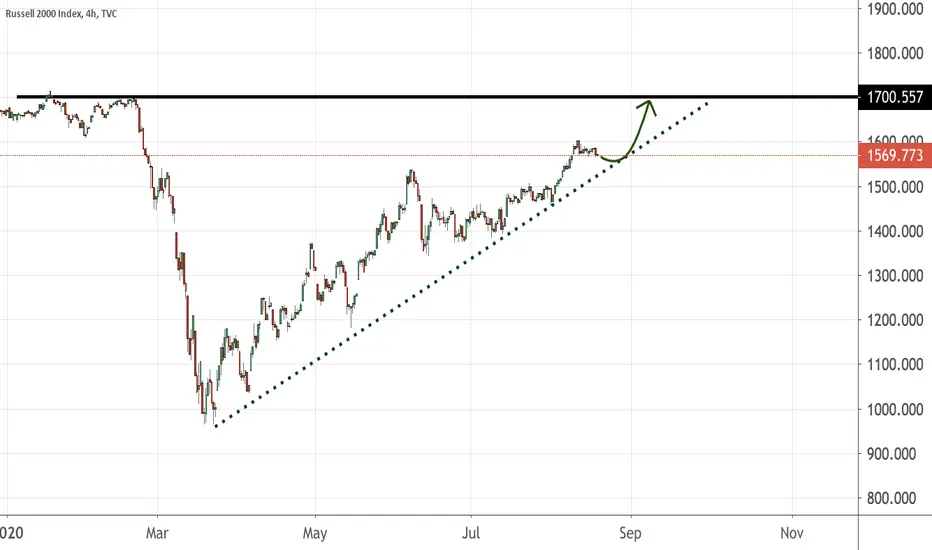
Buying opportunity for Russell 2000See chart
Wait for the price to fall towards the bullish trend line first, establish bullish signals then place your long positions. If it breaks down from the trend line, the trade plan is called off.
Apocalypse Us Stock Index...We are in for a massive ride to the downside..
Weekly Macro Levels are in play and on the 4H the market is already making LowerLows & LowerHigs..
Wait until the market has left the Setup Structure and keep this trade until the very end!
Only shorts from now on!!
Trade Safe & Buckle up!!


Market correction I’m shorting small caps here. VIX is on an uptrend. All indexes/ assets starting to top out momentarily IMO. In combination of the stimulus package fallout and important economic data coming out soon plus a lot of highs being reached across most markets I have turned bearish for the time being. I have opened up a short on small caps as I believe they’ll be hit the hardest in a correction. I also have opened some long VIX calls, will most likely post something on that later. I am using this as a sort of hedge for my crypto portfolio. I am still Bullish long term on crypto’s but we’re due for a correction. This is NOT investment advice. My published ideas are my own opinions. I use them to hold myself accountable and to try and improve upon my investing strategy.
