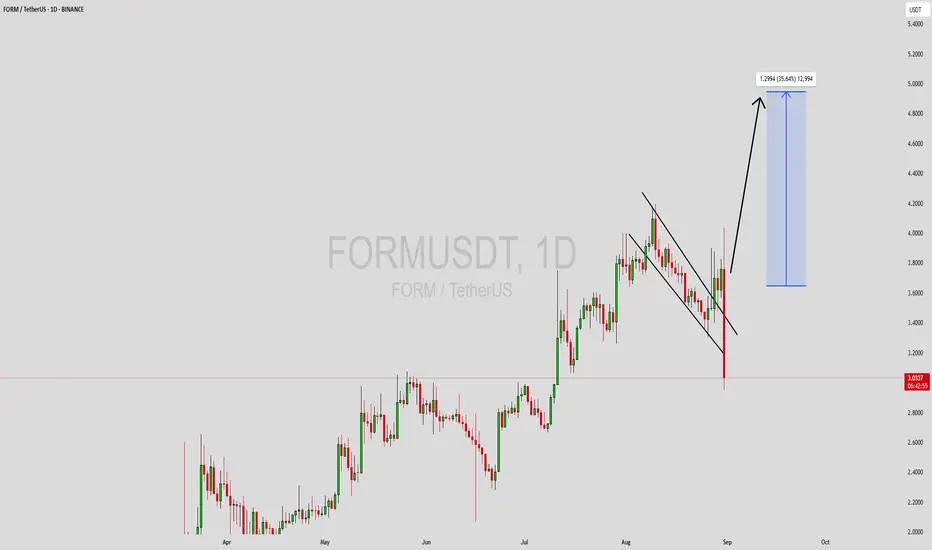
FORMUSDT Forming Falling WedgeFORMUSDT is forming a clear falling wedge pattern, a classic bullish reversal signal that often indicates an upcoming breakout. The price has been consolidating within a narrowing range, suggesting that selling pressure is weakening while buyers are beginning to regain control. With consistent volume confirming accumulation at lower levels, the setup hints at a potential bullish breakout soon. The projected move could lead to an impressive gain of around 140% to 150% once the price breaks above the wedge resistance.
This falling wedge pattern is typically seen at the end of downtrends or corrective phases, and it represents a potential shift in market sentiment from bearish to bullish. Traders closely watching FORMUSDT are noting the strengthening momentum as it nears a breakout zone. The good trading volume adds confidence to this pattern, showing that market participants are positioning early in anticipation of a reversal.
Investors’ growing interest in FORMUSDT reflects rising confidence in the project’s long-term fundamentals and current technical strength. If the breakout confirms with sustained volume, this could mark the start of a fresh bullish leg. Traders might find this a valuable setup for medium-term gains, especially as the wedge pattern completes and buying momentum accelerates.
✅ Show your support by hitting the like button and
✅ Leaving a comment below! (What is your opinion about this Coin?)
Your feedback and engagement keep me inspired to share more insightful market analysis with you!
Market insights

FORMUSDT Forming Falling WedgeFORMUSDT is forming a clear falling wedge pattern, a classic bullish reversal signal that often indicates an upcoming breakout. The price has been consolidating within a narrowing range, suggesting that selling pressure is weakening while buyers are beginning to regain control. With consistent volume confirming accumulation at lower levels, the setup hints at a potential bullish breakout soon. The projected move could lead to an impressive gain of around 140% to 150% once the price breaks above the wedge resistance.
This falling wedge pattern is typically seen at the end of downtrends or corrective phases, and it represents a potential shift in market sentiment from bearish to bullish. Traders closely watching FORMUSDT are noting the strengthening momentum as it nears a breakout zone. The good trading volume adds confidence to this pattern, showing that market participants are positioning early in anticipation of a reversal.
Investors’ growing interest in FORMUSDT reflects rising confidence in the project’s long-term fundamentals and current technical strength. If the breakout confirms with sustained volume, this could mark the start of a fresh bullish leg. Traders might find this a valuable setup for medium-term gains, especially as the wedge pattern completes and buying momentum accelerates.
✅ Show your support by hitting the like button and
✅ Leaving a comment below! (What is your opinion about this Coin?)
Your feedback and engagement keep me inspired to share more insightful market analysis with you!

FORMThe chart shows a clear bearish downtrend. After a strong uoward move where the price reached the area around 3,8-4,0USDT , a rapid decline followed with several consecutive red condles. The current price is around 0,53 USDT meaning it has lost more than 85% of its value from the peak - a clear sing of dominant selling pressure.

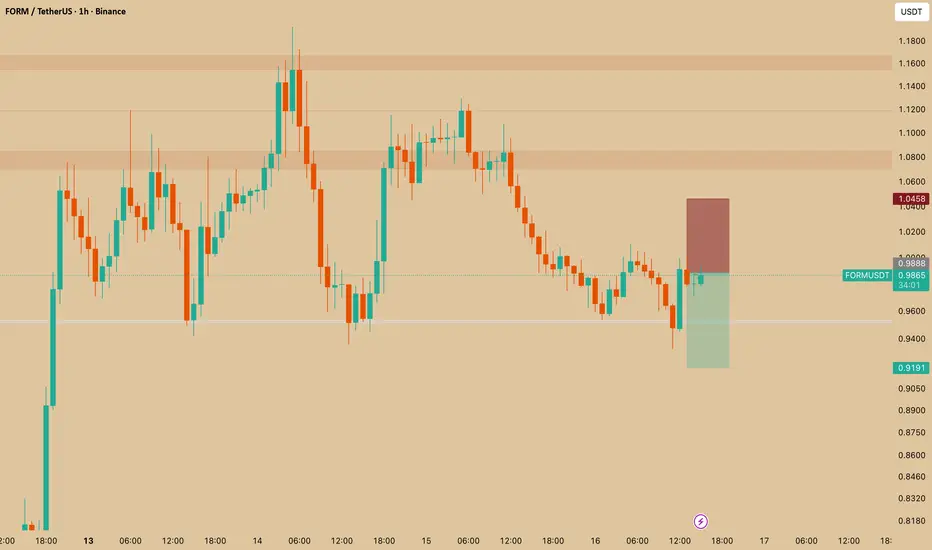
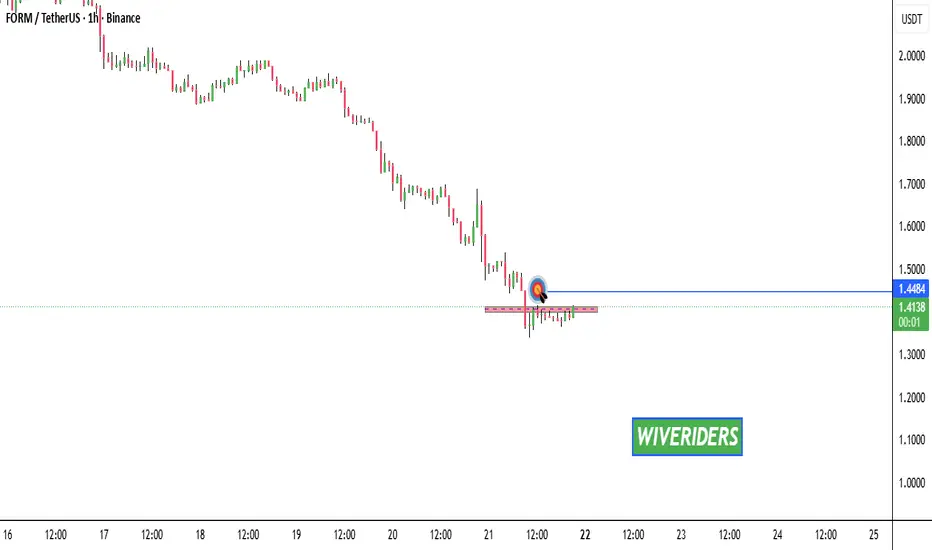
FORM SHORT1. Chart Context
Pair: FORM/USDT
Timeframe: 1h
Current Price: ≈ 0.9868 USDT
The market recently dropped from resistance zones and is now retesting.
2. Trade Setup
This is a short entry, expecting the price to fall again after rejection:
Entry Zone: Around 0.98–0.99 USDT (current consolidation area).
Stop Loss (SL): 1.0458 USDT (top of the red box).
If the price rises above this, the short setup fails.
Take Profit (TP): 0.9191 USDT (bottom of the green box).
The trader is targeting the next support level.
3. Risk/Reward Ratio
Risk (SL distance): ~0.059 USDT
Reward (TP distance): ~0.068 USDT
R:R ratio ≈ 1.15:1
A moderate setup, with slightly more reward than risk.
4. Support & Resistance
Resistance Zones: 1.05 and higher (price struggled to hold above these levels).
Support Zone: Around 0.92 USDT (clear demand zone marked by green box).
The trade idea is that price will reject the retest of resistance and return to support.
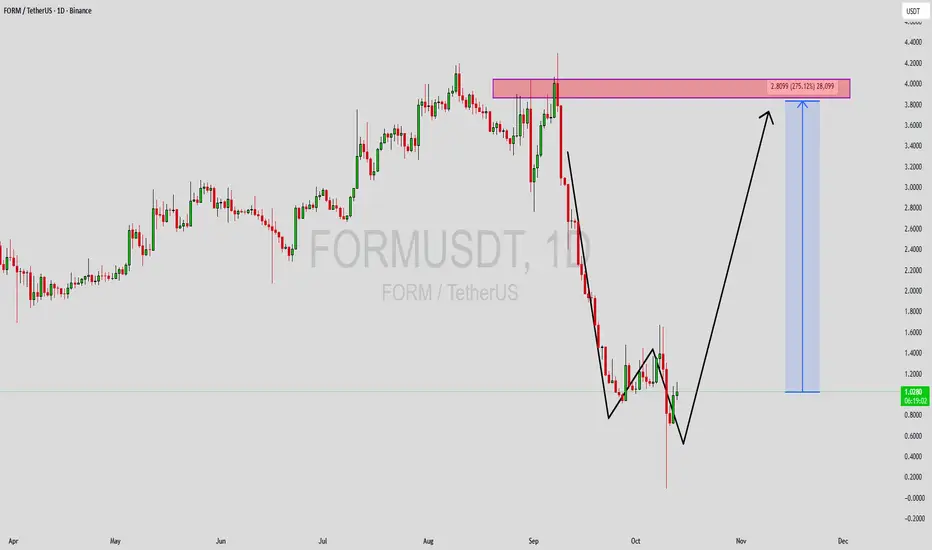
FORMUSDT Forming Bullish ContinuationFORMUSDT is forming a classic bullish continuation pattern, often seen as a strong bullish reversal signal. This pattern typically represents a period of consolidation before a major upward breakout, and FORM appears to be nearing that crucial breakout zone. The price action has shown decreasing volatility within the wedge, while volume remains steady — a sign that accumulation may be underway. With good trading volume backing the move, a breakout could trigger a potential rally of around 190% to 200%+, offering an attractive opportunity for swing and position traders.
Investors are increasingly showing confidence in FORM, as seen in the recent uptick in participation and interest across multiple trading platforms. The bullish continuation structure, combined with growing investor enthusiasm, supports the idea that the asset could be entering a new bullish phase. This setup often leads to a rapid price recovery once resistance levels are breached, with the potential to attract momentum traders seeking strong technical confirmation.
If the breakout is confirmed with strong volume and follow-through candles, FORMUSDT could experience a significant trend reversal, pushing the price into higher resistance zones and setting the tone for a sustained bullish trend. The technical outlook remains positive, with the chart signaling a favorable risk-to-reward setup for traders closely watching this pair.
✅ Show your support by hitting the like button and
✅ Leaving a comment below! (What is You opinion about this Coin)
Your feedback and engagement keep me inspired to share more insightful market analysis with you!
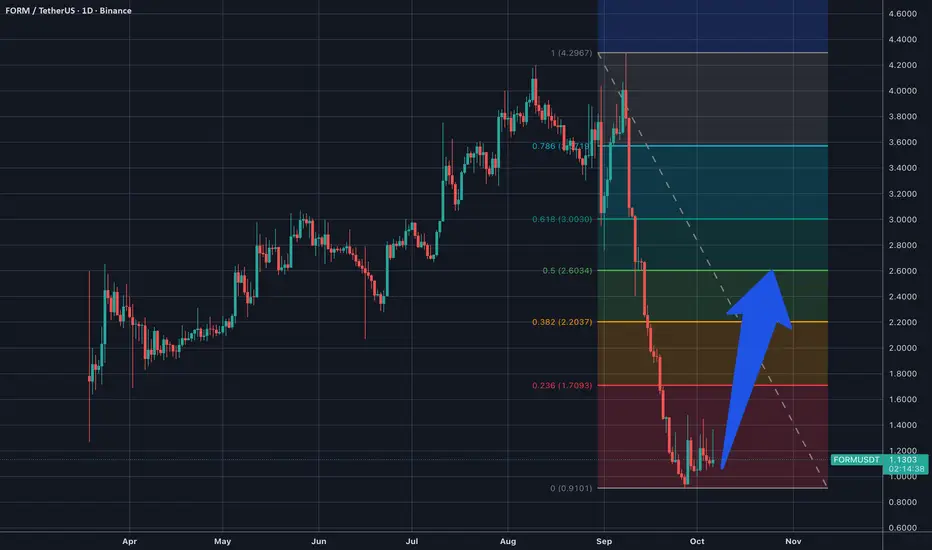
FORMUSDT 1D#FORM has likely found its bottom, and on the daily chart we can see a bullish divergence on the RSI. We expect an upward move toward the following targets:
🎯 $1.4414
🎯 $1.8841
🎯 $2.2419
🎯 $2.5996
🎯 $3.1090
🎯 $3.7578
⚠️ Always remember to use a tight stop-loss and maintain proper risk management.

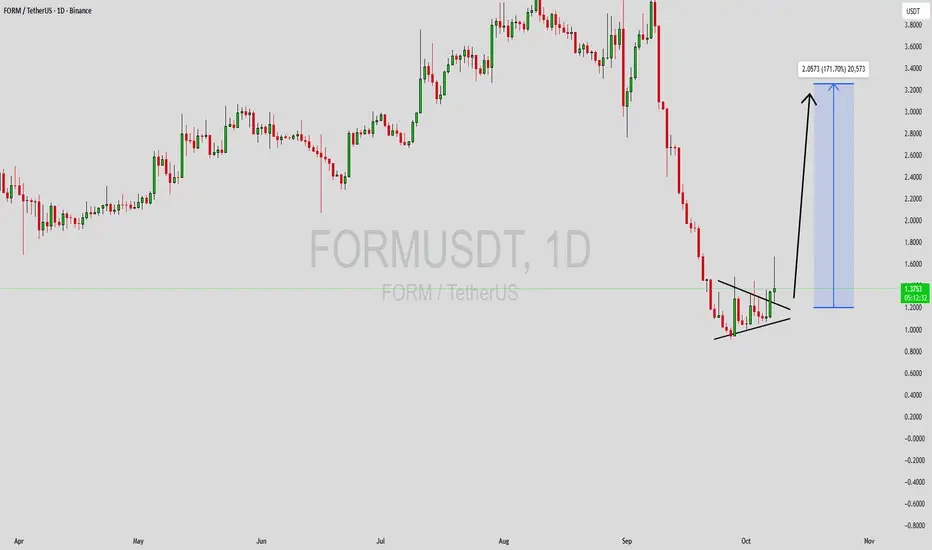
FORMUSDT Forming Falling WedgeFORMUSDT is displaying a powerful **falling wedge pattern**, a formation often recognized as one of the most reliable bullish reversal indicators in technical analysis. After a period of consolidation and gradual price compression, the pair seems ready to break out from this structure with increasing momentum. The volume profile supports this setup, showing steady accumulation from investors who anticipate a major upside reversal.
The current price action indicates growing buyer confidence as the coin continues to test the upper trendline of the wedge. Once a confirmed breakout occurs with sustained volume, FORMUSDT could potentially deliver a strong upward rally, aligning with the projected **140% to 150% gain**. The narrowing wedge structure reflects a market scenario where sellers are losing control and buyers are gradually stepping in to shift the trend direction.
Investor sentiment toward FORMUSDT has been improving, as seen by the consistent inflows and renewed attention from traders looking for undervalued opportunities. The coin’s structure suggests that a bullish phase could emerge soon, supported by healthy market interest and momentum building across the broader crypto sector.
✅ Show your support by hitting the like button and
✅ Leaving a comment below! (What is You opinion about this Coin)
Your feedback and engagement keep me inspired to share more insightful market analysis with you!
FORM looks interesting after the dropThe FORM token has pulled back quite a bit but seems to be holding strong above the $0.90 level.
I believe it has potential to make a move up to around $3, though I’ll be satisfied closing the position once it reaches that target.
As always — everyone trades at their own risk.
I share my trades purely for personal tracking and transparency, not as financial advice.
FORMUSDT Forming Bullish PennantFORMUSDT is displaying a strong bullish pennant pattern on the chart — a continuation setup that typically forms after a significant upward move, followed by a brief consolidation before another potential rally. The current structure suggests that bulls are maintaining control while the price takes a short pause to gather strength. This consolidation phase, combined with consistent volume, indicates healthy market participation and growing interest from investors who expect a breakout toward new highs.
The bullish pennant pattern often leads to sharp upward movements once resistance levels are breached. In the case of FORMUSDT, a breakout above the upper trendline could trigger a powerful rally, with the potential to deliver impressive gains ranging from 140% to 150%+. The strong volume confirms that accumulation is ongoing, and traders are positioning for a possible continuation of the uptrend as momentum builds.
Investor sentiment around FORMUSDT has been notably positive, with increased trading activity signaling confidence in the project’s long-term value. The current setup suggests that once the breakout is confirmed, we may see rapid price appreciation backed by both technical strength and market demand. This could be a high-reward opportunity for traders who identify the breakout early and manage their positions effectively.
✅ Show your support by hitting the like button and
✅ Leaving a comment below! (What is You opinion about this Coin)
Your feedback and engagement keep me inspired to share more insightful market analysis with you!

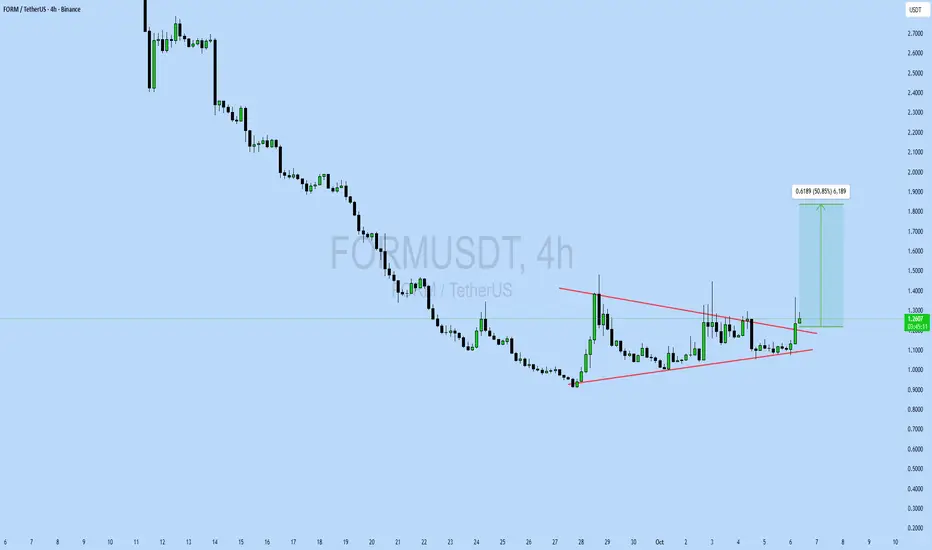
FORMUSDT UPDATE#FORM
UPDATE
FORM Technical Setup
Pattern: Bullish falling wedge pattern
Current Price: $1.23
Target Price: $1.85
Target % Gain: 50.85%
NASDAQ:FORM is breaking out of a falling wedge pattern on the 4H timeframe. Current price is $1.23 with a target near $1.85, showing about 50% potential upside. The breakout indicates growing bullish momentum, suggesting a possible continuation move if support holds. Always use proper risk management.
Time Frame: 4H
Risk Management Tip: Always use proper risk management.
FORM Market Update📊 NASDAQ:FORM Market Update
NASDAQ:FORM is testing the red resistance zone 🔴. If breakout occurs with confirmation, the first target will be the 🔵 blue line level 🎯.
Time for FORMUSDT. 55% potential profit, 2.60 $ targetOn the 4-hour chart, the FORM/USDT pair remains in a clear downtrend. Successive lower highs and lower lows indicate sustained selling pressure, and the price continues to trade below key moving averages. Both short- and long-term moving averages are sloping downward, reinforcing the bearish outlook.
At present, the market is showing a brief consolidation around the 1.60–1.50 USD area, which acts as a local support zone. The first notable resistance levels appear near 1.90–2.00 USD, where previous supply reactions occurred and the shorter moving averages converge. A decisive break above this zone could signal that downward momentum is weakening, though there are no strong signs of a trend reversal yet.
It is worth monitoring trading volume closely—an uptick in volume during an attempted breakout from the current range could indicate a shift in market dynamics. Complementary indicators such as RSI or MACD may help identify potential signs of trend exhaustion or the early stages of a momentum change.
Potential TP: 2.60

FORMUSDT.PLets see the MOVE at our price level. We need a strong volume and candle pattern confirmation to enter in the trade.
Lets wait and watch.
Please keep following me need your support.
Check my previous analysis too.

$FORM: Charge Into the Bull Run!BINANCE:FORMUSDT
NASDAQ:FORM : Charge Into the Bull Run!
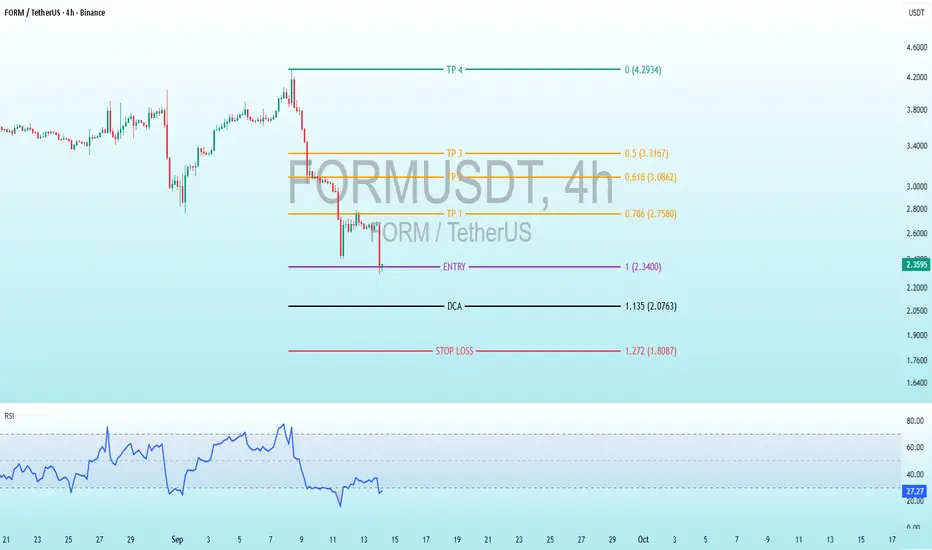
Indicator Analysis: RSI
The Relative Strength Index (RSI, period likely 14 based on standard settings) is plotted below the price chart in blue. It measures momentum on a scale of 0-100, with levels above 70 indicating overbought conditions and below 30 indicating oversold.
Historical RSI Movement: The RSI mirrors the price action closely. It rose above 70 during the early September peak (overbought, signaling potential pullback), plunged below 30 during the mid-September drop (oversold, indicating exhaustion of sellers), recovered to around 60-70 during the rebound, and has now dipped again.
Current Reading: At 27.31 (marked on the right axis), the RSI is deeply oversold. This suggests the recent downmove may be overextended, potentially setting up for a bullish reversal or bounce if buying pressure returns. However, prolonged stays below 30 can indicate strong bearish trends, so confirmation (e.g., RSI divergence or price breakout) would be needed. No visible divergence is present here—the RSI lows align with price lows.
Trading Levels and Setup
The chart features horizontal lines with labels, colors, and Fibonacci ratios, indicating a predefined trading strategy. This appears to be a bullish setup using Fibonacci retracement/extension tools, possibly drawn from a prior swing high (around 4.2934 USD) to a swing low (around 1.8087 USD). Fibonacci tools help identify potential support/resistance based on golden ratios. The levels suggest a long trade (buy low, sell high) with risk management via stop loss and dollar-cost averaging (DCA, buying more at lower prices to average down the entry cost).
Here's a breakdown of the levels (from lowest to highest), including their prices, associated Fib ratios (where labeled), and implications:
Stop Loss Red1.272 1.8087 Risk control point. If price hits here, the trade is exited to limit losses. Placed below key support, allowing ~23% downside from entry (calculated as (2.3400 - 1.8087) / 2.3400 ≈ 22.7%). Common Fib extension for stops in harmonic patterns.
DCA Black 1.135 2.0763 Dollar-cost averaging level. If price dips, buy more here to lower average entry cost.
The "1." might refer to Fib 1.0 or a custom label.EntryPurple1 2.3400 Suggested buy entry for a long position. Near current price action, implying the setup is active or imminent. Positioned at Fib 1.0 (full retracement/end of move).
TP 1 Purple 0.786 2.7580 First take-profit target. ~18% upside from entry. Fib 0.786 is a common deep retracement level for partial exits.
TP 2 Orange 0.618 3.0862 Second TP. ~32% upside from entry. Fib 0.618 (golden ratio) often acts as strong resistance/target.
TP 3 Yellow 0.5 3.3167 Third TP. ~42% upside. Fib 0.5 is a psychological midpoint for scaling out.
TP 4 Green 0 4.293 4Final/ultimate TP. ~83% upside from entry. No Fib label; likely an extension target or prior high.
Strategy Interpretation: This is a classic swing long setup. Enter at 2.3400 USD expecting a bounce (supported by oversold RSI). Scale out profits at TPs for risk-reward ratio optimization—e.g., overall R:R could be 1:3+ if stopping at SL and hitting TP4. If price drops, use DCAs to accumulate. The Fib ratios (0.5, 0.618, 0.786, 1, 1.272) align with standard extensions/retracements, possibly from a bearish move, targeting a reversal. Current price seems near the entry, with downside risk to SL (~22.7% loss) vs. upside to TP4 (~83% gain).
Potential Risks and Considerations:
Bearish Bias: Recent red candles and oversold RSI could lead to further downside if support breaks (e.g., below 2.08 DCA).
Volatility: Crypto markets like FORM (a smaller-cap token) are prone to whipsaws; the sharp mid-Sep drop highlights this.
Confirmation Needed: Look for bullish candle patterns (e.g., hammer, engulfing) or RSI breakout above 30 for entry. External factors like market sentiment, news on Formation Fi, or broader crypto trends (e.g., Bitcoin correlation) could influence.
Technical and Fundamental Analysis of Form/USDT: Projected GrowtExecutive Summary
Formation FI (FORM) is positioned for significant near-term growth, with strong technical and fundamental indicators suggesting a potential price increase from the current $3 level to $5.5. This represents a potential gain of approximately 83% based on current market conditions and project developments.
Key Growth Catalysts
1. Innovative DeFi 2.0 Architecture
Multi-strategy yield aggregation platform that dynamically allocates assets across DeFi protocols
Cross-chain functionality with expanding support for Ethereum, BSC, Polygon, and Avalanche networks
Smart rebalancing technology that maximizes APY while managing risk exposure
2. Strong Fundamental Metrics
Total Value Locked (TVL) growth: 47% increase quarter-over-quarter, reaching $285 million
User adoption: 38,500+ active wallets, with 22% monthly growth rate
Revenue generation: Protocol revenues up 63% in Q2 2023, indicating sustainable economic model
3. Strategic Partnerships and Integrations
Chainlink integration for secure price feeds and automated yield strategy execution
Polygon collaboration for reduced gas fees and enhanced scalability
Upcoming Binance Launchpool announcement anticipated in Q4 2023
Technical Analysis
Current Chart Patterns (4H Timeframe)
Bull flag formation identified with clear consolidation between $2.85-$3.15
RSI divergence: Hidden bullish divergence on daily chart indicating accumulation
Moving averages: Price trading above 50-day and 200-day EMAs, confirming bullish structure
Volume profile: Increasing volume on upward moves, decreasing on retracements
Key Resistance and Support Levels
Immediate resistance: $3.45 (previous high)
Secondary resistance: $4.20 (Fibonacci 0.618 level)
Target resistance: $5.50 (Fibonacci 1.272 extension)
Strong support: $2.65 (200-day EMA + volume node)
Price Targets and Timeline
Short-term (2-4 weeks): $3.80-$4.20 range
Medium-term (6-8 weeks): $4.80-$5.20 range
Primary target: $5.50 (83% gain from current levels)
Market Context and Timing
Favorable Macro Environment
DeFi recovery: Total DeFi market cap showing strength after 18-month consolidation
Staking yield demand: Increasing institutional interest in sustainable yield generation
FORM token utility: Enhanced tokenomics with veFORM model driving buy pressure
Upcoming Catalysts
Mainnet V2 launch (October 2023): Introducing leveraged yield strategies
Governance proposals for token buyback and burn mechanism
Cross-chain expansion to Arbitrum and Optimism networks
Risk Factors and Considerations
Potential Challenges
Market volatility: Crypto markets remain susceptible to macro economic shifts
Regulatory developments: Potential DeFi regulation could impact short-term price action
Competition: Emerging yield aggregators may capture market share
Risk Management
Stop-loss recommendation: $2.40 (below key support level)
Position sizing: Maximum 3-5% portfolio allocation recommended
Profit-taking levels: Consider partial profits at $4.20 and $5.00
Conclusion
Formation FI presents a compelling investment opportunity with strong fundamentals and technical positioning. The project's innovative approach to yield generation, combined with expanding TVL and user adoption, creates favorable conditions for price appreciation. The $5.50 target represents a realistic projection based on both technical patterns and fundamental growth metrics.
Disclaimer: This analysis is for informational purposes only and does not constitute financial advice. Cryptocurrency investments carry significant risk, and investors should conduct their own research and consult with financial advisors before making investment decisions.

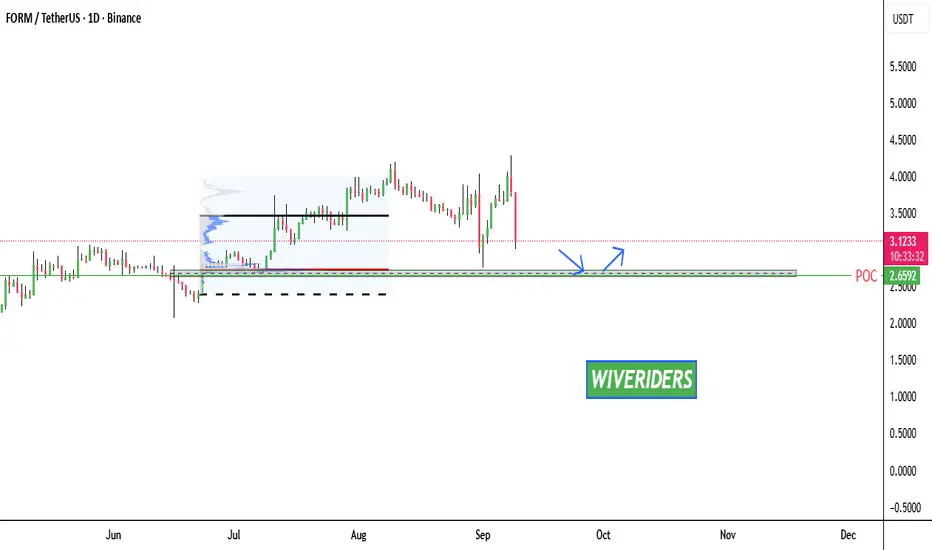
$FORM Trading UpdateNASDAQ:FORM Trading Update
NASDAQ:FORM is approaching the green support zone around 2.6592, which lines up with the POC and strong volume accumulation. This area has previously shown strong buyer interest, and a bounce from here is possible.
If bulls step in, price could push higher again — but ⚠️ waiting for confirmation before entering long is essential.
(POC + accumulation cluster) are the key reasons for focusing on this zone.
Happy trading ✨
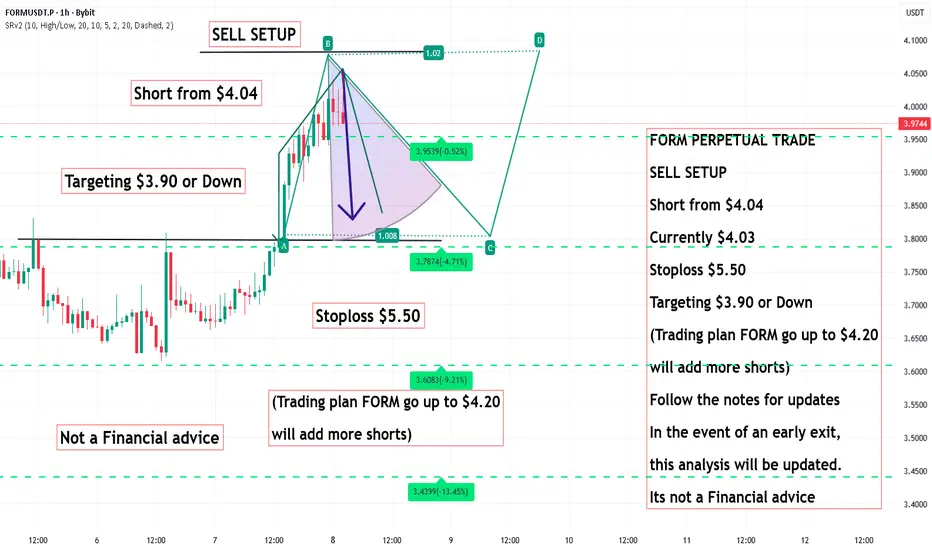
FORM PERPETUAL TRADE SELL SETUP ,Short from $4.04FORM PERPETUAL TRADE
SELL SETUP
Short from $4.04
Currently $4.03
Stoploss $5.50
Targeting $3.90 or Down
(Trading plan FORM go up to $4.20
will add more shorts)
Follow the notes for updates
In the event of an early exit,
this analysis will be updated.
Its not a Financial advice
FORMUSDT Forming Bullish ContinuationFORMUSDT is showing strong momentum after breaking out of a downward channel formation, indicating a potential reversal in price action. The breakout suggests that selling pressure has been absorbed and buyers are now stepping in to take control. With good trading volume supporting the move, this pair is gaining attention among traders and investors who are watching closely for further confirmation of bullish continuation.
Based on the technical setup, FORMUSDT is expected to deliver gains in the range of 20% to 30%+. The breakout, along with increasing investor participation, signals that the coin has strong potential to test higher resistance levels in the short to medium term. A sustained push above key levels could pave the way for stronger rallies, making this a pair worth keeping on the radar.
The market sentiment around this project is also showing improvement as investors recognize the opportunity for solid returns. With healthy volume and visible interest, FORMUSDT is positioned to build momentum if the current trend continues. As always, traders should monitor price movements carefully and manage risk according to their trading strategy.
✅ Show your support by hitting the like button and
✅ Leaving a comment below! (What is You opinion about this Coin)
Your feedback and engagement keep me inspired to share more insightful market analysis with you!
SellDue to the fake upward breakout to the dynamic level and then the breakout downward, and the bearish lag, it is ready for a sharp decline after the correction is complete.

Short Due to the fake upward breakout to the dynamic level and then the breakout downward, and the bearish lag, it is ready for a sharp decline after the correction is complete.
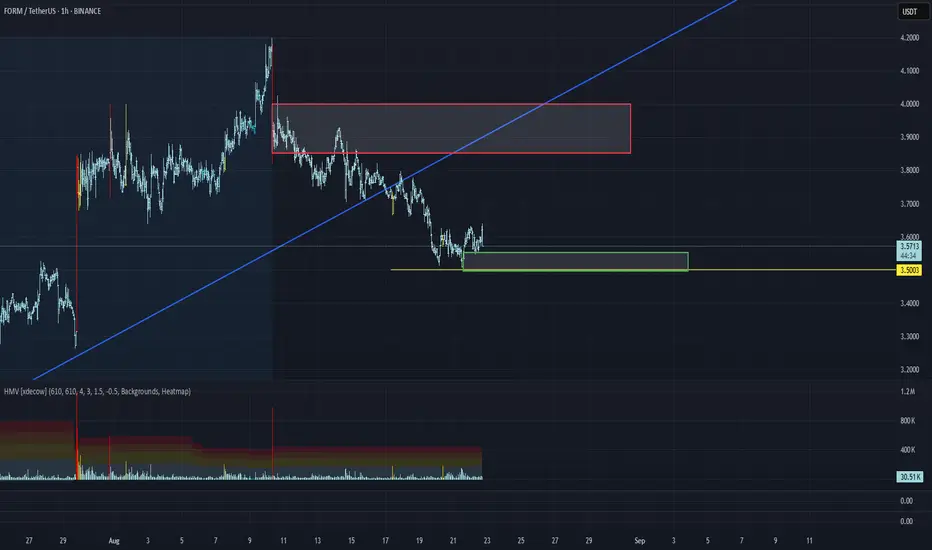
FORM/USDT Analysis. Two Interesting Trade Opportunities
This asset has broken its overall uptrend, and in the long term the potential remains directed towards $3–$2.7. However, during the current decline, we observe a strong divergence with cumulative delta: the price is falling while delta is rising, which indicates a possible strong limit buy.
Locally, we consider a long entry on a test of the $3.55–$3.5 zone if a reaction occurs. After that, if the price reaches the $3.85–$4 zone, we will consider a short position.
This publication is not financial advice.
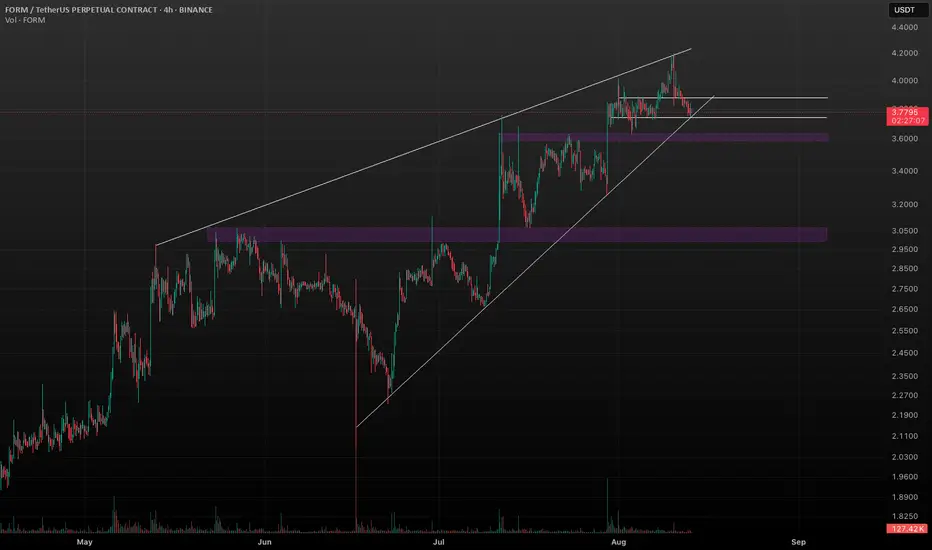
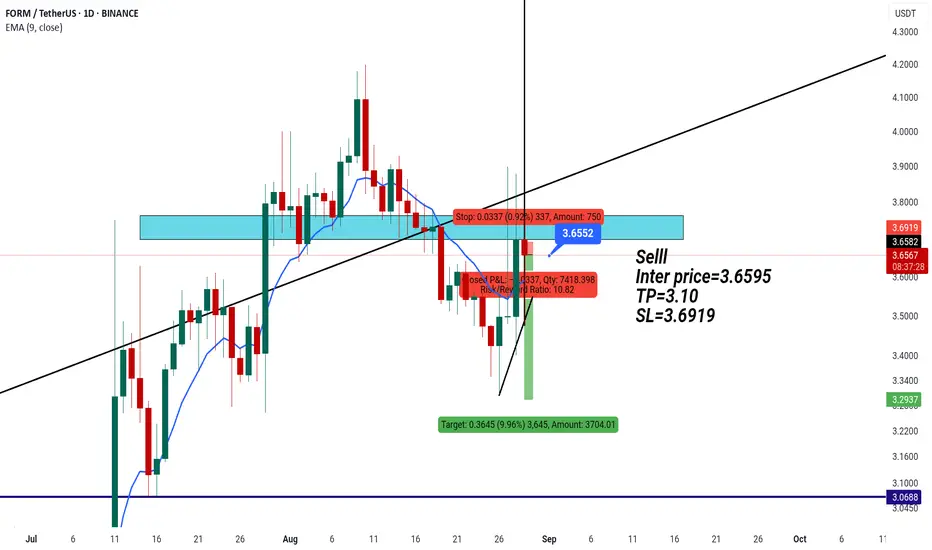
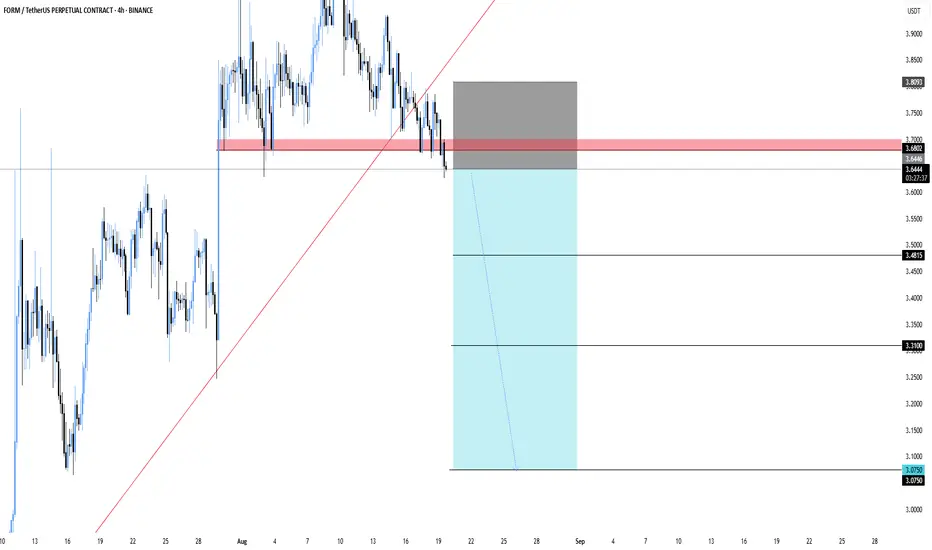
FORMUSDT.P – Break Below SupportFORMUSDT – Break Below Support
FORM has broken its trendline and slipped under the support zone. As long as it stays below this area, the momentum looks bearish with more room to the downside.
Entry: 3.64
Stoploss: 3.8093
Targets:
3.48
3.31
3.075
Let’s see if the breakdown continues or if buyers step back in.
FORMUSDT 4H Rising WedgeTouching the key support line. Will it fall below and then reverse and continue to decline?