NAS100 - Stock market awaits an important week!The index is above the EMA200 and EMA50 on the 4-hour timeframe and is trading in the specified pattern. If it does not rise again above the broken trend line, I expect a correction.
If the index returns above the broken trend line, we can expect a new ATH to be recorded on the Nasdaq. It is better to wait for confirmation on the breakout in order to control further risk.
Last week, U.S. stock markets—particularly the Nasdaq index—experienced significant volatility, driven by a combination of economic and geopolitical factors:
• A reduction in trade tensions due to ongoing U.S.-China negotiations
• The release of inflation indicators
• Heightened geopolitical tensions
According to Politico, as G7 leaders meet in Canada, the escalating conflict between Israel and Iran will top the agenda. Politico reported that leaders of the free world have gathered in the Rocky Mountains to discuss the very real threat of a full-scale war in the Middle East. The initial sessions of the G7 summit will take place in Kananaskis, where the worsening Israel-Iran conflict will be the primary focus. Donald Trump, who in recent days has fueled tensions through social media, is now expected to join discussions aimed at de-escalation.
On the economic front, lower-than-expected inflation in May could encourage the Federal Reserve to cut interest rates sooner than markets had previously anticipated. On Wednesday, the Bureau of Labor Statistics reported that inflation rose 2.4% in May compared to a year earlier. Housing costs were identified as the primary driver of this inflation, while price increases in categories most affected by high tariffs were not as pronounced as economists had expected. So far this year, the Fed has refrained from cutting its benchmark interest rate, citing concerns that tariffs might push consumer prices higher. While the likelihood of a rate cut at this week’s meeting remains low, the latest report could ease some of these worries and accelerate the timeline for potential cuts.
Meanwhile, Bloomberg reported that a growing group of President Trump’s advisers is urging him to consider Besant for the Fed chair position. Jerome Powell’s current term extends until May 2026, and he was originally nominated by Trump in November 2017. Other names reportedly under consideration include Kevin Warsh (considered a favored candidate), Kevin Hassett (head of the White House National Economic Council), Christopher Waller (a current Fed board member), and David Malpass (former World Bank president).
After a week dominated by U.S. inflation data, investor attention in the coming days will shift toward central bank decisions and potential signals regarding the future path of interest rates. The trading week kicks off Monday with the Empire State Manufacturing Index, offering an initial snapshot of the industrial sector in New York. Later that day, the Bank of Japan will announce its first interest rate decision, an event that could shape Asian market trends and the yen’s valuation.
On Tuesday, May’s U.S. retail sales data will be released—a key indicator of consumer strength. Signs of weakness in this report could bolster expectations for rate cuts. Wednesday will be the focal point of the week, as the Federal Reserve announces its policy decision. While markets have already priced in a pause in tightening, investors will scrutinize Jerome Powell’s remarks for clues on the likelihood of rate cuts in the months ahead. Additionally, data on May housing starts and weekly jobless claims will also be released that day.
On Thursday, with U.S. markets closed for Juneteenth, attention will turn to monetary policy decisions from the Swiss National Bank and the Bank of England. Changes in tone or interest rates from these key European central banks could influence currency market volatility. Finally, the week will conclude Friday with the release of the Philadelphia Fed Manufacturing Index—a leading indicator closely watched by traders for insights into the health of the manufacturing sector in the U.S. East.
NAS100 trade ideas

Smart money NASDAQ analysis
🚦 SMART MONEY SIGNAL – NASDAQ H4
You're on the 4-hour (H4) timeframe.
Price tapped the 200 EMA (white line) — commonly seen as a Smart Money Demand Zone.
Strong bullish candle formed = possible rejection from an institutional level.
RSI at 47 = neutral zone, still room to go higher.
---
📊 Smart Money Interpretation:
🟢 Market Structure:
Liquidity sweep below (stop-loss hunt under 200 EMA).
Bullish rejection candle = clear sign of Smart Money involvement.
🔻 Liquidity Grab:
Price broke the recent low then quickly reversed = manipulation phase complete.
Likely H4 Bullish Order Block formed (area of institutional buying).
---
✅ Entry Signal (Buy Setup)
🔹 Direction: Buy / Long
🔹 Entry Zone (Buy Limit):
🔸 Between 21,650 and 21,680
🔹 Stop Loss:
🔸 Just below the wick = 21,570
🔹 Take Profit Levels:
TP1: 21,900
TP2: 22,000
> Targeting imbalance fill + possible structure break
🔹 Risk/Reward Ratio: 1:2 to 1:3 (solid for Smart Money setups)
---
🔁 Entry Confirmation (Lower Timeframe):
Wait for price to pull back into the H4 Order Block.
Look for M15 or M5 bullish reaction (pin bar or bullish engulfing).
RSI > 50 on M30 or H1 = momentum confirmation
🧠 Pro Tip (Smart Money Style):
Draw the H4 Order Block (last bearish candle before the move up). If price returns to this area and shows a strong bullish reaction — you’ve got a high-probability institutional entry. Talion-promosale
-

POSSIBLE BUY OPPORTUNITY ON NAS100Price starting to range in what seems to be an uptrend. We look for a location of unfilled orders to join the trend!


NASDAQ - Medium term prediction - 16/06/25On the NQ around 21,638, I’d estimate roughly:
Rally up through 22,248 first ~60%
Slide down through 21,024 first ~40%
Why?
Up-trend bias: Since the April low (≈16,000), the market has been in a strong rally, clearing multiple interim highs.
Resistance vs. support: 22,248 has capped rallies twice (Jan & Feb), so a break would be bullish but not guaranteed. Meanwhile 21,024 flipped to support in late May.
Momentum: The recent pullback from 22,000 was shallow, and daily MACD/RSI remain in bullish territory, suggesting a higher chance to retest the upper line before failing.


NAS100\ Bullish Play DevelopingNasdaq holds a strong bullish structure on the 4H, so I moved down to the 15-minute for a cleaner bird’s-eye view of price action. Liquidity was swept directly into a refined order block — a precise tap that validated the zone.
Price is now hovering around a 5-minute OB. Just observing and letting the market unfold.
Discipline and patience — that’s where the edge is.
— Inducement King 👑
Bless Trading!

Venta en Nasdaq impulsada por volatilidad macroeconómicaThe Nasdaq presents a technical short opportunity following a strong reaction to volatility triggered by recent macroeconomic events. This pressure has activated a risk-off environment, with capital flowing out of tech assets into safe havens like the dollar or bonds.
The price is respecting a bearish structure on higher timeframes and, after a technical pullback into supply zones, rejection is confirmed with volume and reversal candlesticks. I expect bearish continuation as long as key levels remain intact and macro uncertainty persists.
📍 Trade based on price action and fundamental context.
⚠️ Risk is managed according to the trading plan, adjustable based on macro developments.

ICT cheat code 15 minutes strategy using frankfort timeThis is the guideline on how to use the strategy
1.Identify accunilation ,minipulation
2.Use 06:00 to 07:00 for entry point
3.Identify either a ifvg or fvg
4.Enter at the specific time stated.
5.Target 2 takeprofits 200 pips and 300 pips
Use as stated ill be active and post at those times to show prove of strategy

SNIPER Smart money NASDAQ
🟢 Smart Money Sniper Analysis – NASDAQ (US100) H4
✒️ By Talion-Promosale
📅 June 12, 2025
🔹 Current Price: 21,867
🔹 RSI(14): 52.49 (neutral to slightly bullish momentum)
🔹 Market Structure: Bullish – price forming higher lows above key EMAs
🔹 Price is above the 200 EMA (white), and testing the 50 EMA (red)
🔹 Smart Money Zone: Last bullish order block between 21,700 – 21,740
---
🎯 Trading Signal – BUY (Smart Money Sniper Setup)
Sniper Entry Zone: 21,700 – 21,740 (Bullish Order Block + dynamic EMA support)
Confirmation Entry: Above 21,870
Take Profit 1 (TP1): 22,000
Take Profit 2 (TP2): 22,150
Stop Loss (SL): 21,620
💡 Context:
Price action remains bullish, supported by the 200 EMA and a clean rejection near the 50 EMA. RSI is above 50, indicating potential for upward continuation. The Smart Money zone between 21,700 and 21,740 serves as an ideal sniper re-entry area.
If price re-tests this order block with bullish rejection candles, it presents a high-probability buy opportunity. A break and close above 21,870 confirms momentum toward 22,000 and higher.
---
⛔ Invalidation:
A strong bearish close below 21,620 on the H4 chart would invalidate the bullish scenario.

BUY STOP NAS100 AT 22000I will be buying Nas100 at 22000. I will hold the buy to the last high of the daily TF being 22200. Nas100 moves in 1000. Therefore, 2200 is a definite buy.

NS100 IS BULLISHPEPPERSTONE:NAS100 , The journey to NAS100 ATH is all about to kickstart, and it will do us good not to miss this moves. On this post, i shared analysis about NAS100 combining both H4, Daily and WeeklyTF together to form this analysis, for further details, see the content of the post.

NasDaq100 CPI Break-Down NasDaq100 price broke resistance level at $22,006. We waited for price to correct back to resistance level then we entered buy's when continued above $22,006.


Staircase seen in real chartsFor the most part OANDA:NAS100USD has exhibited a near perfect staircase up so far.
It does appear fairly extended right now, but with rotation out of safe havens into risk on assets again, what remains to be seen is how much fuel is in the tank, and how far can the tailwind take it.

NAS100!Nasdaq is clearly in either the start or the end of a consolidation
The trend is still up.
Trade with care use a stop loss

NSDQ100 INTRADAY awaits US CPI data Trade:
The US and China agreed on a basic plan to restart trade in sensitive goods. China will speed up rare earth exports, and the US may ease some export rules. The deal still needs approval from Trump and Xi. A court also ruled Trump can keep his global tariffs for now. Markets dipped due to the lack of details, and focus is now on US inflation data.
Protests:
LA had a quieter night after setting a downtown curfew. Anti-ICE protests spread to more cities. Trump’s move to send the military to LA is drawing controversy.
Key Support and Resistance Levels
Resistance Level 1: 22070
Resistance Level 2: 22370
Resistance Level 3: 22680
Support Level 1: 21300
Support Level 2: 21060
Support Level 3: 20820
This communication is for informational purposes only and should not be viewed as any form of recommendation as to a particular course of action or as investment advice. It is not intended as an offer or solicitation for the purchase or sale of any financial instrument or as an official confirmation of any transaction. Opinions, estimates and assumptions expressed herein are made as of the date of this communication and are subject to change without notice. This communication has been prepared based upon information, including market prices, data and other information, believed to be reliable; however, Trade Nation does not warrant its completeness or accuracy. All market prices and market data contained in or attached to this communication are indicative and subject to change without notice.

Nasdaq 100 Approaching Breakout Zone! | Key Levels to Watch The Nasdaq 100 has been on a steady bullish trend since mid-April, respecting a beautiful ascending trendline shown in blue. As of now, the price is sitting at 21,905, right under a critical resistance zone around 21,920–21,950.
Here are the key levels marked on the chart:
🔹 Resistance:
21,920–21,950 (current testing zone)
21,139.82 (previous local high)
🔹 Support Zones:
20,599.44
20,056.10
19,889.50
18,161.32 (major swing low)
🔹 Trendline Support:
Starting from April lows, this trendline continues to hold as dynamic support, adding to the bullish momentum.
---
📊 Price Action Insights:
✅ Bullish structure with higher highs and higher lows
✅ Strong bullish candles leading into resistance
✅ Consolidation near the highs — potential breakout brewing
✅ Price staying above the 20,599 and 20,056 key support zones
---
🧨 Potential Trade Setups:
📈 Bullish Breakout Scenario:
A clean break and close above 21,950 on the 4H could trigger a bullish run toward 22,200+.
📉 Rejection Scenario:
Failure to break above this zone might lead to a retest of 20,599.44 or the trendline support for a better entry.
---
📌 Key Events to Watch:
🇺🇸 US Market Holidays and Data Releases (circled in red) could add volatility — stay alert!
---
🗣️ What’s Your Bias?
🔽 Do you think Nasdaq will break higher or retrace back to the trendline support?
💬 Drop your analysis below! Let’s discuss 💬
👍 Like & Follow if you find this helpful – more setups coming soon!
#NASDAQ100 #NDQ100 #TechnicalAnalysis #PriceAction #TradingView #StockMarket #BreakoutTrading #Trendline #SupportAndResistance #FrankFx14

Sniper Smart money NASDAQ 🎯 SNIPER SIGNAL – NASDAQ (NAS100)
📅 Date: June 11, 2025
⏱ Timeframe: 1H (H1)
📉 Type: Sell
📍 Entry (SELL): 21,950 – 21,970
⛔ Stop Loss: 22,050
🎯 Take Profit 1: 21,700
🎯 Take Profit 2: 21,450
📊 Risk/Reward ≈ 1:2
🧠 Smart Money Analysis:
✅ Liquidity sweep above 21,950–21,970
✅ Bearish BOS confirmed on 1H
✅ H1 imbalance zone not filled
✅ RSI shows bearish divergence
✅ Order block rejection at 21,900–21,950
💬 Confirmation: await H1 close below ~21,900
🔒 Always use effective risk management
📌 Signal by: **@Talion-Promosale**
(Personal analysis – not financial advice)
#NAS100 #NASDAQ #SniperSignal #SmartMoney #TradingView #TalionPromosale

Sniper NASDAQ 🎯 SNIPER SIGNAL – NASDAQ (NAS100)
📅 Date: June 11, 2025
⏱ Timeframe: 1H (H1)
📉 Type: Sell
📍 Entry (SELL): 19,270 – 19,300
⛔ Stop Loss: 19,370
🎯 Take Profit 1: 19,100
🎯 Take Profit 2: 18,950
📊 Risk/Reward ≈ 1:2
🧠 Smart Money Analysis:
✅ Liquidity grab above the 19,300 key level
✅ Bearish Break of Structure (BOS) confirmed on 1H
✅ H1 imbalance zone not yet mitigated
✅ Bearish RSI divergence
✅ Strong rejection from institutional order block on H1
💬 Confirmation: Wait for 1H candle to close below 19,250 for extra confirmation
🔒 Risk management is essential
📌 Signal posted by: **@Talion-Promosale**
(Personal analysis – not financial advice)
#NAS100 #NASDAQ #SniperSignal #SmartMoney #TradingView #TalionPromosale

USNAS100 – Bearish Bias Below 21780 Ahead of CPI and Trade TalksUSNAS100 – Bearish Pressure Below 21780, CPI & Trade Talks in Focus
Overview:
USNAS100 remains under downward pressure ahead of a key macro week, including US-China trade talks and the upcoming US CPI data.
Technically, price remains bearish while below the pivot level at 21780.
A break below 21635 may lead to further downside toward 21470 and potentially 21360.
On the upside, a 1H close above 21780 could invalidate the bearish view and open the path toward 21920 and the ATH at 22200.
Key Levels:
Pivot: 21780
Support: 21635, 21470, 21360
Resistance: 21920, 22200

Workforce participation is declining, government debt is risingWorkforce participation is declining, government debt is rising. Are we seeing the makings of major military conflicts?
This chart shows two key economic indicators for the U.S. from 2001 to 2025:
- U.S. labor force participation rate: the percentage of the working-age population that is either employed or actively looking for work.
- U.S. government debt as a % of GDP: the ratio of total federal debt to the country’s gross domestic product (GDP), but the scale is flipped - meaning higher debt appears lower on the graph, and vice versa.
What does “government debt as a % of GDP” mean?
This ratio shows how much the government owes relative to the size of the entire economy. If the ratio grows, it means debt is rising faster than the economy. The debt-to-GDP ratio surged sharply after the 2008 crisis and again during the COVID-19 pandemic. By 2024, it reached around 124% and is expected to keep rising. Since the chart uses an inverted scale, the red line drops lower as debt increases.
This graph clearly illustrates an inverse relationship between labor force participation and government debt as a share of GDP:
As workforce participation declines → government debt grows. This pattern is especially visible during major economic shocks like the 2008 crisis and the 2020 pandemic.
Why does this happen?
- Economic downturns: when fewer people are working or job-hunting, economic growth slows, tax revenues fall, and the government tends to borrow more to support the economy and social programs.
- Demographic shifts: as the population ages (e.g, baby boomers retiring), fewer people remain in the labor force. This slows down growth and increases the strain on government programs, which also drives up debt.
- Government policy: during times of crisis, the state often increases spending - and thus borrowing- to support the economy, pushing the debt-to-GDP ratio higher.

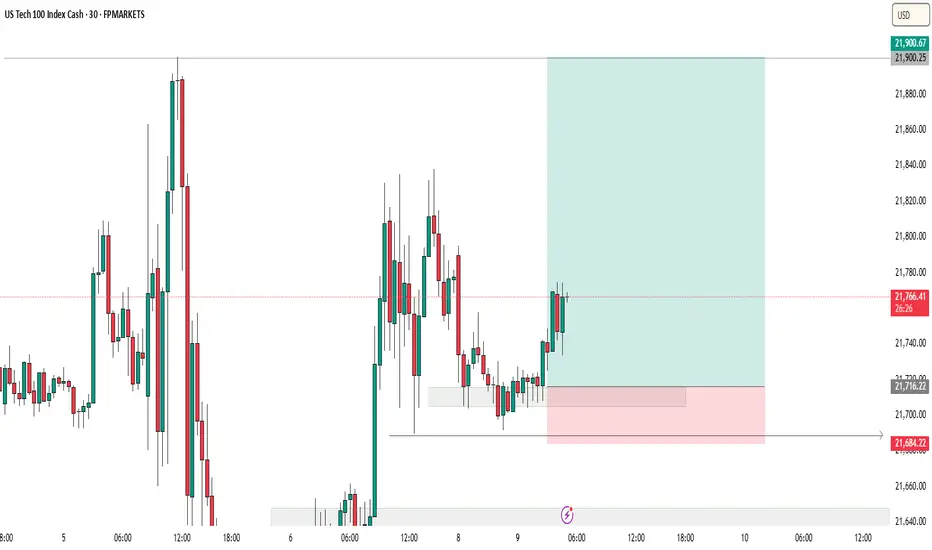
US100This is simply a breakdown of structure on a lower timeframe, and it makes sense to me that it could potentially shift to the upside.