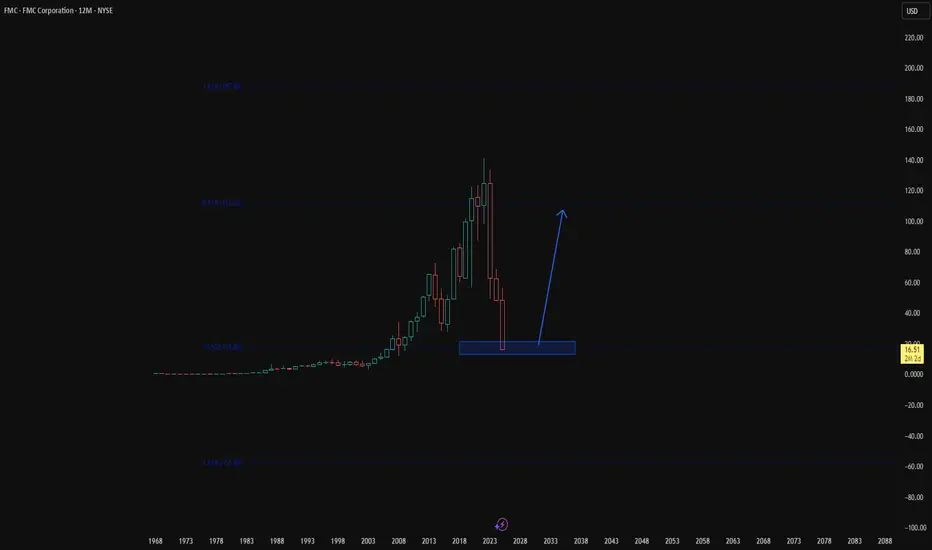
FMC UP 35% THE NEXT WEEKSThere is an accumulation pattern at these prices targeting 35% from the current price. I am in :)
Next report date
—
Report period
—
EPS estimate
—
Revenue estimate
—
−3.625 EUR
328.34 M EUR
4.10 B EUR
123.89 M
About FMC Corporation
Sector
Industry
CEO
Pierre R. Brondeau
Website
Headquarters
Philadelphia
Founded
1883
Identifiers
3
ISINUS3024913036
FMC Corp. is an agricultural sciences company, which engages in the provision of solutions to growers and development of pipeline in crop protection, plant health, agriculture, pest control, and turf management. It offers insect control products under the Rynaxypyr and Cyazypyr brands, herbicides under the Authority, Boral, Centium, Command, and Gamit brands, insecticides under the Talstar and Hero brands, flutriafol-based fungicides, and bionematicides under the Quartzo and Presence brands. The company was founded by John Bean in 1883 and is headquartered in Philadelphia, PA.
Related stocks

FMC is a huge opportunity imoFMC has been taken out to the woodshed...dividend was cut and apparently India operations have been scaled back...but operational performance was a beat! Everyone is treating it like a leper...time to buy in my opinion...down over 80% and has just reached the zone back in the Great Financial Crisi

GFMC HUGE LONG. Been waiting months for this level. See my old FMC chart. I had total conviction it would get this low. A dividend cut to prioritize paying debt and hopefully growth was the catalyst. Huge level to long. Going to hold forever.
FMC Long. Lower first.We will continue lower and I wouldnt enter this stock for a long term hold until my box.

BUY FMC ALL-IN!!!Long term hold opportunity. Get ahead of the curve on this opportunity with both our targets yielding high return while also collecting respectable dividends.
Good Luck

BUY FMC CORP!!!!We have finally reached our significant demand zone where we can expect this bear cycle to bottom out with attractive targets.
Good luck

FMC POTENTIAL FOR 100%from fundamental point of view and supply and demand, the prices around 32 is a reflection point to around 60's.


FMC Bullish Setup – 1:16 R:R at Strong Support & TrendlineNYSE:FMC has reached a key support level, aligning with a bullish trendline, making this a crucial area for a potential rebound. Notably, March recorded the highest trading volume since December 2010 , signaling strong market interest.
With the all-time high (ATH) still within reach, this setup o

$FMC: FMC Corporation – Crop Cash or Weed Woes?(1/9)
Good morning, everyone! ☀️ NYSE:FMC : FMC Corporation – Crop Cash or Weed Woes?
With FMC at $42.96, is this agro giant sprouting profits or wilting away? Let’s dig into the dirt! 🔍
(2/9) – PRICE PERFORMANCE 📊
• Current Price: $ 42.96 as of Mar 18, 2025 💰
• Recent Move: Up 14.5% from $37.5

See all ideas
An aggregate view of professional's ratings.
Neutral
SellBuy
Strong sellStrong buy
Strong sellSellNeutralBuyStrong buy
Neutral
SellBuy
Strong sellStrong buy
Strong sellSellNeutralBuyStrong buy
Neutral
SellBuy
Strong sellStrong buy
Strong sellSellNeutralBuyStrong buy
Displays a symbol's price movements over previous years to identify recurring trends.
EVLLF5588207
FMC Corporation 6.375% 18-MAY-2053Yield to maturity
8.92%
Maturity date
May 18, 2053
US302491AV74
FMC Corporation 4.5% 01-OCT-2049Yield to maturity
8.31%
Maturity date
Oct 1, 2049
US302491AX3
FMC Corporation 5.65% 18-MAY-2033Yield to maturity
7.99%
Maturity date
May 18, 2033
US302491AU91
FMC Corporation 3.45% 01-OCT-2029Yield to maturity
6.90%
Maturity date
Oct 1, 2029
US302491AT29
FMC Corporation 3.2% 01-OCT-2026Yield to maturity
4.97%
Maturity date
Oct 1, 2026
EVLLF6081079
FMC Corporation 8.45% 01-NOV-2055Yield to maturity
—
Maturity date
Nov 1, 2055
See all FMQ bonds
Frequently Asked Questions
Depending on the exchange, the stock ticker may vary. For instance, on FWB exchange FMC Corporation stocks are traded under the ticker FMQ.
We've gathered analysts' opinions on FMC Corporation future price: according to them, FMQ price has a max estimate of 34.13 EUR and a min estimate of 11.09 EUR. Watch FMQ chart and read a more detailed FMC Corporation stock forecast: see what analysts think of FMC Corporation and suggest that you do with its stocks.
Yes, you can track FMC Corporation financials in yearly and quarterly reports right on TradingView.
FMC Corporation is going to release the next earnings report on Feb 4, 2026. Keep track of upcoming events with our Earnings Calendar.
FMQ earnings for the last quarter are 0.76 EUR per share, whereas the estimation was 0.73 EUR resulting in a 4.44% surprise. The estimated earnings for the next quarter are 1.02 EUR per share. See more details about FMC Corporation earnings.
FMC Corporation revenue for the last quarter amounts to 819.22 M EUR, despite the estimated figure of 905.20 M EUR. In the next quarter, revenue is expected to reach 979.79 M EUR.
FMQ net income for the last quarter is −482.77 M EUR, while the quarter before that showed 56.45 M EUR of net income which accounts for −955.18% change. Track more FMC Corporation financial stats to get the full picture.
Yes, FMQ dividends are paid quarterly. The last dividend per share was 0.07 EUR. As of today, Dividend Yield (TTM)% is 13.12%. Tracking FMC Corporation dividends might help you take more informed decisions.
FMC Corporation dividend yield was 4.77% in 2024, and payout ratio reached 85.56%. The year before the numbers were 3.68% and 22.08% correspondingly. See high-dividend stocks and find more opportunities for your portfolio.
As of Jan 2, 2026, the company has 5.7 K employees. See our rating of the largest employees — is FMC Corporation on this list?
EBITDA measures a company's operating performance, its growth signifies an improvement in the efficiency of a company. FMC Corporation EBITDA is 550.09 M EUR, and current EBITDA margin is 21.33%. See more stats in FMC Corporation financial statements.
Like other stocks, FMQ shares are traded on stock exchanges, e.g. Nasdaq, Nyse, Euronext, and the easiest way to buy them is through an online stock broker. To do this, you need to open an account and follow a broker's procedures, then start trading. You can trade FMC Corporation stock right from TradingView charts — choose your broker and connect to your account.