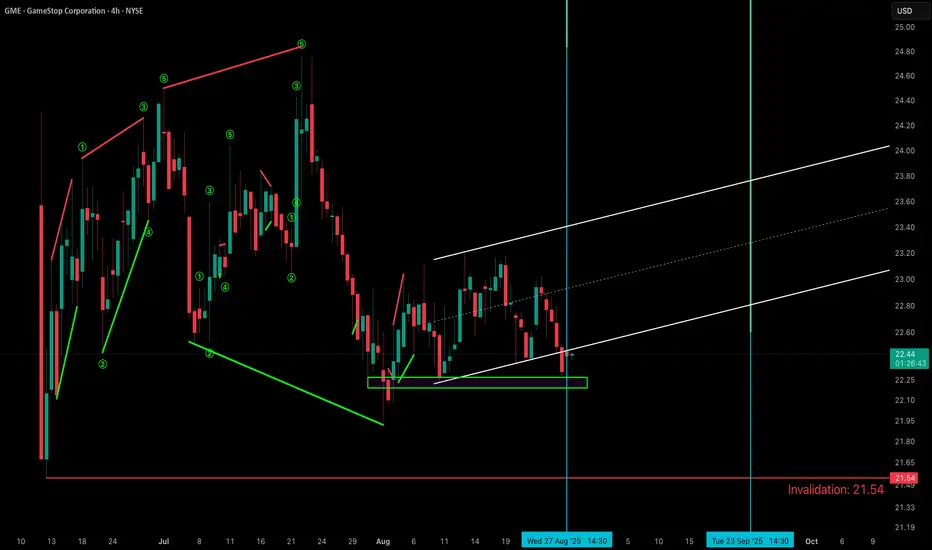
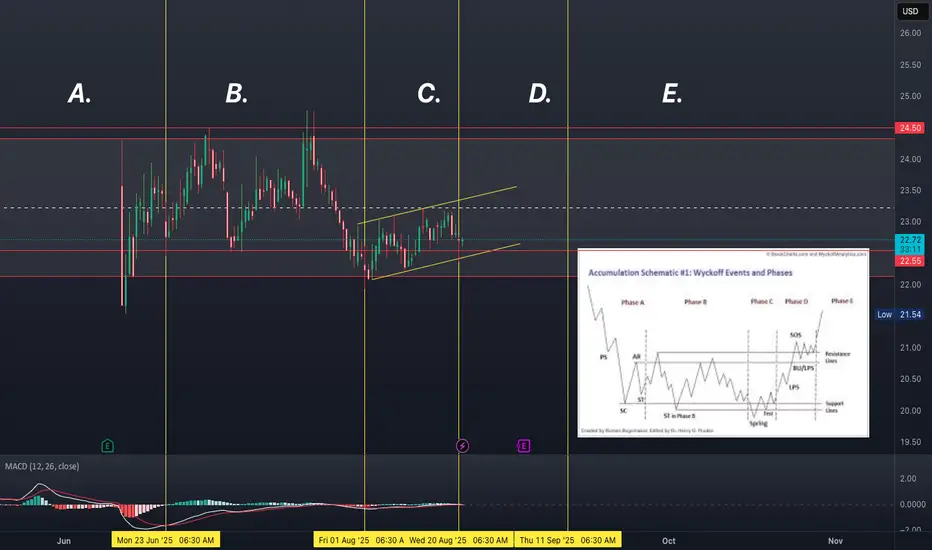
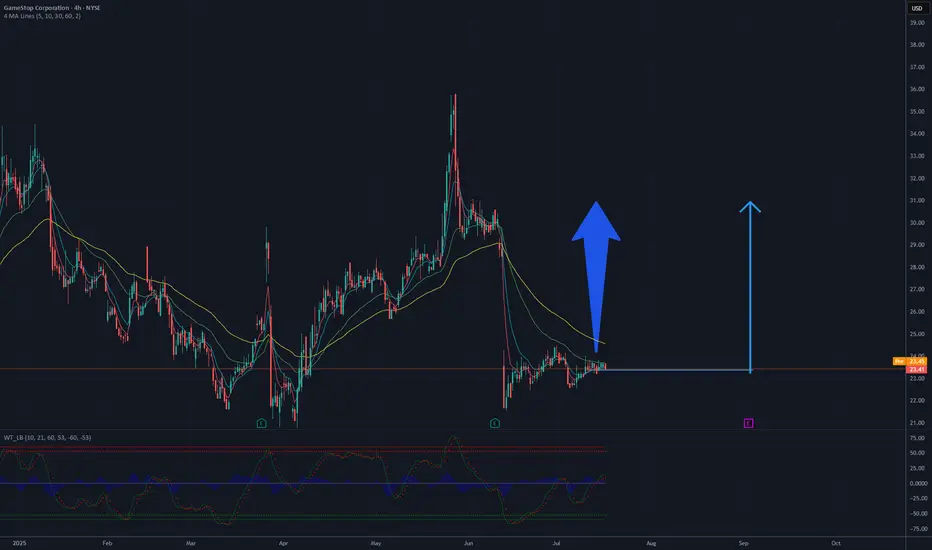
GME(GameStop Corporation) 4H Pre-Earnings SetupGME’s been chopping sideways for the past few months, ranging tightly between $21.50 – $23.50, forming a solid base within a Demand Zone.
Major flush from ~$37.50 occurred in early June post-earnings selloff, followed by range-bound consolidation — classic post-pump retrace and equilibrium setup.
Price is sitting just above a fresh demand zone (21.34 – 21.53) with a potential upside move targeting prior supply zone at $30.05 – $31.05 — clean structure.
🧾 Earnings:
Last Quarter (Jun 10):
EPS surprise: +112.5% ($0.17 vs $0.08 est.)
Revenue miss: -2.35%
Upcoming (Sep 9):
EPS est: $0.19
Revenue est: $900M
Analysts expect YoY revenue growth of 3.1% (a reversal from last year’s -31.4%)
Q2 earnings drop tomorrow, Sept 9 — high volatility expected.
Market is watching for signs of turnaround post-restructuring rumors and broader retail strategy updates.
📈 Technical Setup:
Demand Zone: 21.34 – 21.53 ✅
Supply Zone: 30.05 – 31.05 🚨
🎯 Trade Idea (Swing Setup):
Entry: $22.75 (current market)
Stop Loss: $21.51(below demand zone)
Take Profit: $30.19 (mid-supply zone)
RRR: ~6.0 (excellent setup)
🧮 Risk Management:
Max capital risk: 1–3% of total portfolio.
🧰 Trade Management:
Consider moving SL to breakeven once price hits $24.5–25 (first structure resistance).
Scale out 50% at $27, hold rest for full TP.
Trail stops aggressively after break above $28.
“The market is a device for transferring money from the impatient to the patient.” — Warren Buffett
⚠️ Disclaimer:
This is not financial advice. Trade at your own risk. Always do your own research and use proper risk management.
GS2C trade ideas

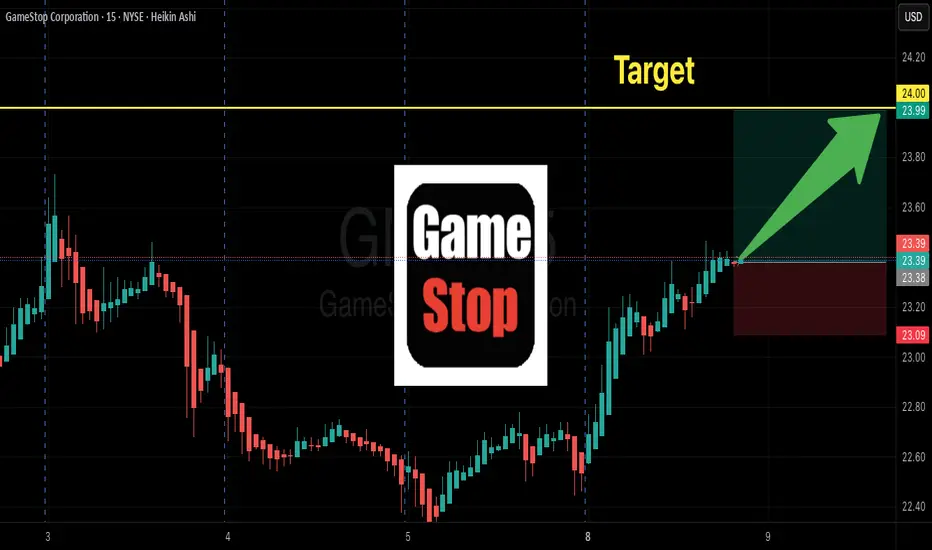
GME Options Flow Screams Upside To $24C – Tactical Call Buy!
# 🎮🔥 GME Earnings Lottery Ticket: \$90 Risk for 200%+ Upside!
📊 **Earnings Analysis Summary (2025-09-08)**
💡 **Trade Idea:**
👉 Buy **1x GME \$24.00 CALL** (exp. 2025-09-12) at **\$0.90** (pre-earnings close entry).
This is a **single-leg naked call**, pure tactical play.
---
### 🧩 Why This Trade?
* 📉 **Fundamentals Weak**: Revenue –16.9% YoY, thin margins.
* 💵 **Massive Cash Cushion**: \$6.39B → no bankruptcy risk.
* 📈 **Options Flow HOT**: Heavy call OI at \$24/\$25 → gamma squeeze risk.
* 🎯 **History of Surprises**: 75% beat rate, often outsized moves.
* ⚡ **IV Elevated but Fair**: Calls priced \$0.50–\$1.10 → reasonable lottery ticket.
---
### 📊 Scores (1-10)
🔻 Fundamentals: 3
📈 Options Flow: 8
📊 Technicals: 5
🌎 Macro: 5
✅ Overall Conviction: **72% MODERATE BULLISH**
---
### 📌 Trade Plan
🎯 Entry: \$0.90 limit (pre-earnings close)
🛑 Stop Loss: \$0.45 (–50%)
💰 Profit Targets:
* +150% = \$2.25 (scale out 50%)
* +200% = \$2.70 (full take profit)
📆 Exit: within 2 hrs post-earnings to avoid IV crush
---
### ⚖️ Risk/Reward
* Max Loss: **\$90**
* Breakeven: \$24.90 (needs +10.1% move)
* Upside: +200% to +300% possible if GME squeezes
---
📊 **TRADE DETAILS**
* 🟢 Instrument: GME
* 🟢 Direction: CALL
* 🎯 Strike: 24.00
* 💵 Entry: 0.90
* 🛑 Stop: 0.45
* 📅 Expiry: 2025-09-12
* 📈 Confidence: 72%
* ⏰ Earnings: 2025-09-09 (AMC)
---
🚀💎🙌 This is a **lottery-style upside bet**: risk a small ticket, catch a big move if earnings surprise + gamma squeeze align.
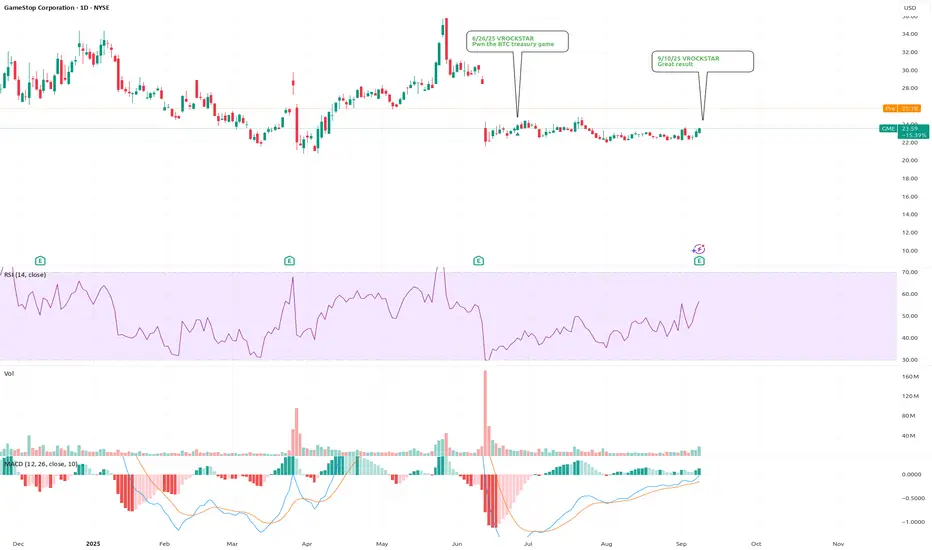
9/10/25 - $gme - Great result9/10/25 :: VROCKSTAR :: NYSE:GME
Great result
- nice help from Switch 2
- bye bye Canada drag and other SG&A excess
- trading card revenue continues to climb in importance (and my personal DD shows they are holding back a lot of cards - pun intended)
- the FY revenue estimate is probably 20-25% lower than mine, and typically a mgmt CC (which they don't do- maybe some day) would really hype this thing
- took a swing AH and am already out (don't shoot!) and honestly think there's good merit for it to keep running
- just too many battle scars this last Q from retail that beat and dunked shortly thereafter for me not to notice- even if this one defn a bit different
- it's on the short list to own into YE and 2026 if we do get back toward the starting pt - call it $22/23 zone. not expecting it per se, but that's where i have my trigger
- congrats ryan and the gme holders - this one is a totally diff animal today and continues to hit on all cylinders
V
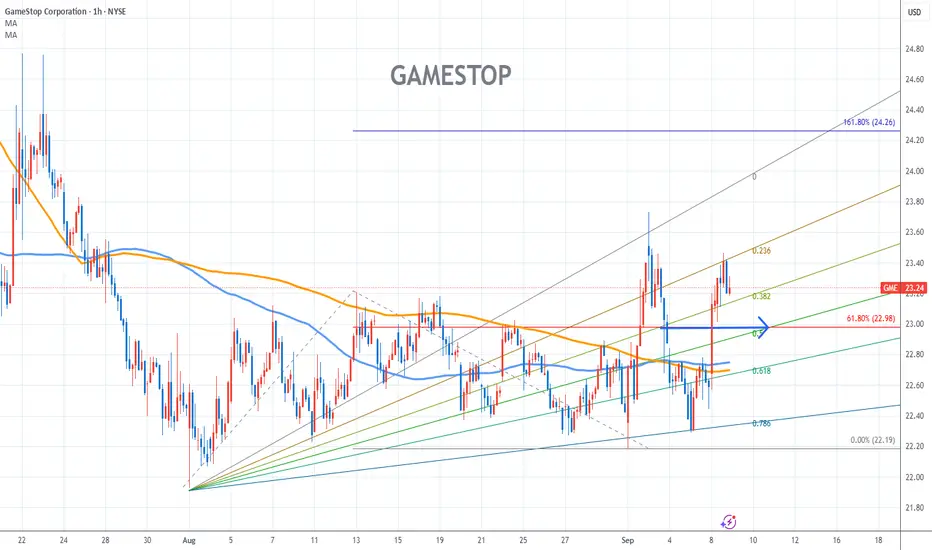
GameStop Stock Chart Fibonacci Analysis 090825Trading Idea
1) Find a FIBO slingshot
2) Check FIBO 61.80% level
3) Entry Point > 23/61.80%
Chart time frame:C
A) 15 min(1W-3M)
B) 1 hr(3M-6M)
C) 4 hr(6M-1year)
D) 1 day(1-3years)
Stock progress:A
A) Keep rising over 61.80% resistance
B) 61.80% resistance
C) 61.80% support
D) Hit the bottom
E) Hit the top
Stocks rise as they rise from support and fall from resistance. Our goal is to find a low support point and enter. It can be referred to as buying at the pullback point. The pullback point can be found with a Fibonacci extension of 61.80%. This is a step to find an entry-level position. 1) Find a triangle (Fibonacci Speed Fan Line) that connects the high (resistance) and low (support) points of the stock in progress, where it is continuously expressed as a Slingshot, 2) and create a Fibonacci extension level for the first rising wave from the start point of the slingshot pattern.
When the current price goes over the 61.80% level, that can be a good entry point, especially if the SMA 100 and 200 curves are gathered together at 61.80%, it is a very good entry point.
As a great help, TradingView provides these Fibonacci speed fan lines and extension levels with ease. So if you use the Fibonacci fan line, the extension level, and the SMA 100/200 curve well, you can find an entry point for the stock market. At least you have to enter at this low point to avoid trading failure, and if you are skilled at entering this low point, with the fibonacci6180 technique, your reading skill of to chart will be greatly improved.
If you want to do day trading, please set the time frame to 5 minutes or 15 minutes, and you will see many of the low points of rising stocks.
If you prefer long-term range trading, you can set the time frame to 1 hr or 1 day
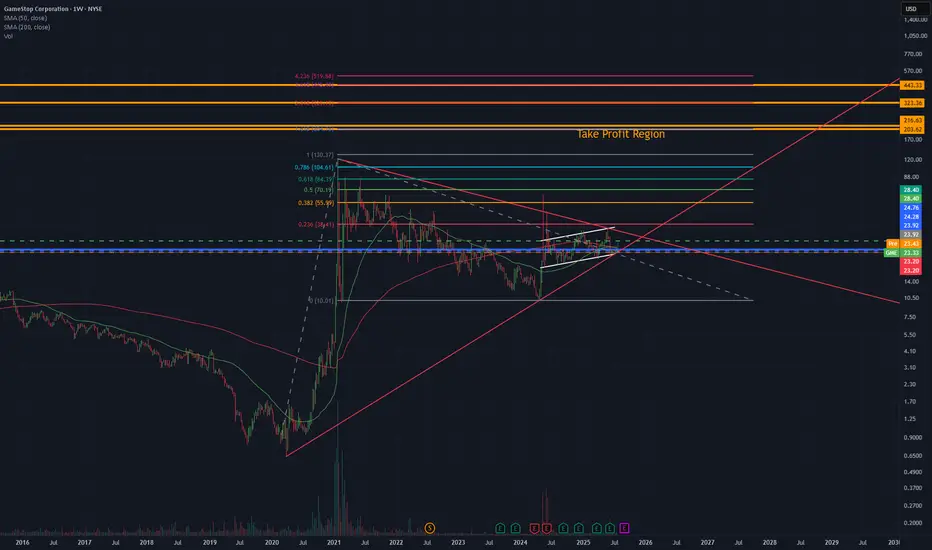
GME Q2 Earnings Beat + Warrant Dividend: $32 Now the MagnetGameStop’s latest quarterly results came in stronger than expected, reinforcing the turnaround narrative. At the same time, the board announced an unusual “dividend” in the form of warrants, each giving shareholders the right to buy one share at $32 until October 2026 (record date: October 3, 2025).
With this strike price clearly visible, $32 now acts as a magnet for price action in the coming months. Market participants know that above this level the warrants gain real intrinsic value, and below it they are only speculative. It’s reasonable to assume there’s a high probability of the market testing or reaching $32 ahead of the record date.
From a technical perspective, yesterday’s breakout plus strong earnings leaves room for higher targets. According to my chart analysis, the next potential upside levels are descripted by Fibonacci's Trend-based extended figure.

GME Breakout Alert | Gann Cycle Turning Point📅 27th Aug → Gann date hit today
📅 Next Key Date → 23rd Sep
After nearly 3 months of sideways consolidation, momentum is building.
Enough is enough — the setup is primed for a breakout. ⚡
GameStop ($GME) Collapse ImminentNYSE:GME showing signs of major technical distress.
This whole meme thing had to end somewhere. At the end of the day, that was easy money for anyone looking to make a quick buck.
Just ask yourself, if you controlled tens of millions of shares at 25X their average historical trading range, why would you hold that?
And that's exactly what has been going on for the last several years. The weird thing is that it lasted so long and seemed to have a dedicated following. After all, a movie was made about the whole phenomenon (I never saw the movie).
This thing likely goes very quickly on the break.
Gamestop: A RequelI have been wrong about a lot on GME...like a lot (jury is still out on 20 week cycle)
But what im still assured of is the fact that GMEs structure is still, from a MACRO perspective bullish (i will let someone else debate the fundamentals..I trade on TA only)
But the question every GME'er wants to know is will it squeeze again?
My answer, strictly from a TA perspective is: MOST LIKELY
When: JANUARY 2026
BTW it will likely squeeze no matter if The Cat comes back or not (he probably will..remember i said it)
Ok so im going to explain to you in a series of charts why from a TA perspective I'm ALMOST CERTAIN GME WILL SQUEEZE AGAIN
And because I love this chart

$GME Accumulate phasePossible accumulation phase, hence why institutions are eating up shares these past few weeks. Breaking lower would scratch this idea and instead, become distribution.
$203 TargetTrade closed when i updated it for some reason, so ill re-post.
Same idea, same target, keep waiting n relax

Looking for $203Super meaningful description, chart explains itself and numbers behind in borrows and shorts are lined up, sooner than later gonna move... tgt 200-210
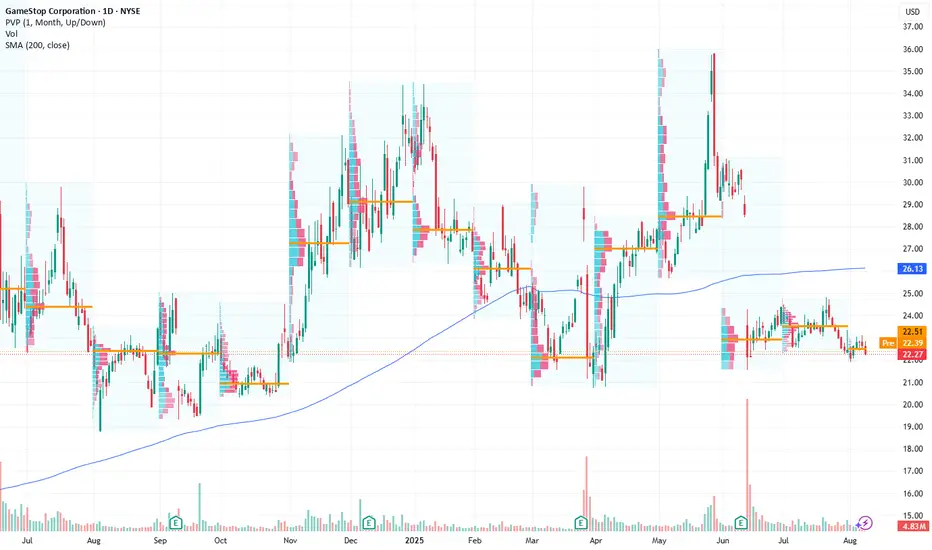
GameStop Faces Key Resistance Amidst Market VolatilityCurrent Price: $22.27
Direction: LONG
Targets:
- T1 = $23.10
- T2 = $23.80
Stop Levels:
- S1 = $21.80
- S2 = $21.40
**Wisdom of Professional Traders:**
This analysis synthesizes insights from thousands of professional traders and market experts, leveraging collective intelligence to identify high-probability trade setups. The wisdom of crowds principle suggests that aggregated market perspectives from experienced professionals often outperform individual forecasts, reducing cognitive biases and highlighting consensus opportunities in GameStop.
**Key Insights:**
GameStop (GME) has been a hallmark of high volatility trading, with the stock positioned in a narrative that oscillates between speculative fervor and macroeconomic challenges. The company continues to grapple with reinventing its business model while navigating an incrementally competitive gaming and digital tech environment. Professional traders note the critical importance of tracking price action near the $23 resistance zone, which could act as a catalyst for a breakout if bullish sentiment strengthens. The current price offers a favorable risk-reward setup for a cautiously optimistic long play, targeting likely price appreciation near key technical levels.
**Recent Performance:**
GameStop has experienced erratic price behavior in the past week, trading in a narrow range as investors await concrete updates from the company. Despite low volume trading days, the stock managed to hold above the $22 mark, indicating buyers’ reluctance to let the price dip further amidst speculative bets on upcoming earnings. The stock's overall trend remains cautious, with lower lows avoided narrowly, leaving a window open for potential upside.
**Expert Analysis:**
Many experts are split between skepticism about GameStop’s future relevance in the modern gaming retail space and the hope for a turnaround narrative driven by e-commerce. Technical analysts emphasize the stock's close adherence to support lines near $21.40, with a notable resistance tranche between $23.00 and $23.50. Momentum indicators like RSI and MACD show mixed readings but lean toward upward potential should buying interest outpace historical trendlines.
**News Impact:**
Recent management adjustments at GameStop have garnered market interest, though skepticism remained high regarding execution capabilities. Broader market movements, particularly within growth stocks, have had indirect effects on GameStop's price action. Additionally, any meaningful updates in the company’s digital commerce strategy could act as significant catalysts.
**Trading Recommendation:**
With the price currently at $22.27 and approaching key technical resistance, traders could consider a moderately bullish stance, setting tight stop losses at $21.80 and $21.40 for risk mitigation. Upside targets of $23.10 and $23.80 align with prior resistance levels and risk-reward ratios. However, this idea hinges on positive trading momentum and sufficient volume for a sustained breakout. Consider position size adjustments if volatility increases.
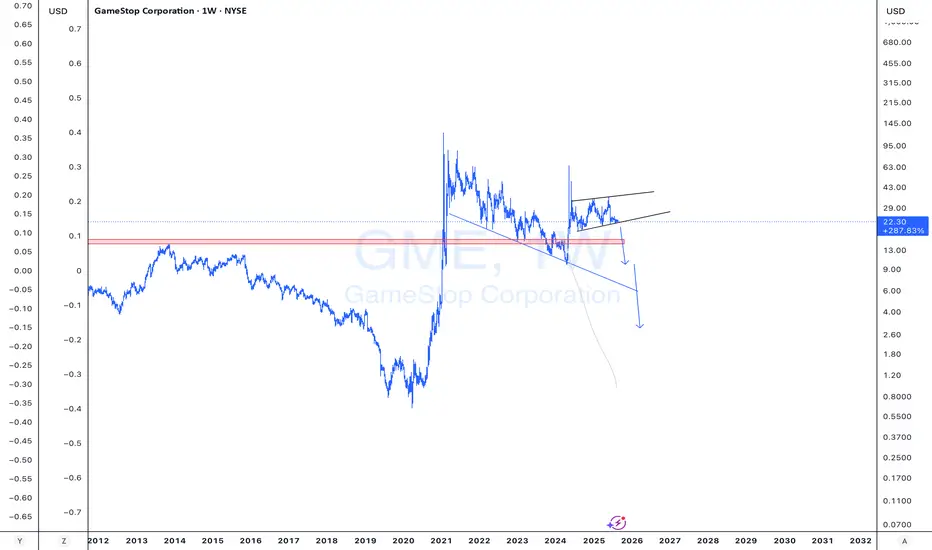
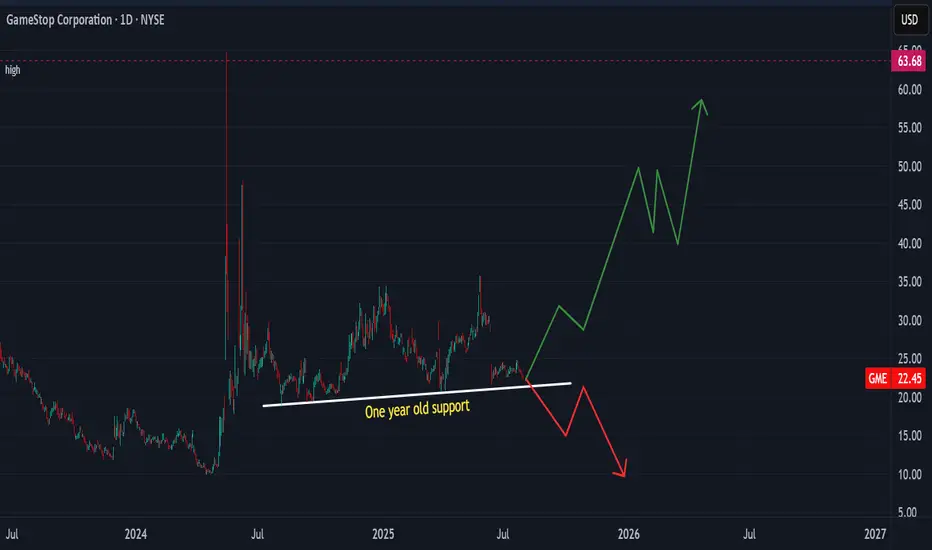
THIRD TIME IS A CHARM (SUPPORT BREAK OR FURTHER ADVANCE)Price action has been holding the one year support line from July 2024 until now. A break will see GameStop price declining further to the old support at 10.00 USD. However, price is favourably expected to rise further to test the 47.00 USD and an extension to the old high if this support holds.
Set tight stop-loss below support line.
Use reasonable margin as per account size.
Trade safe
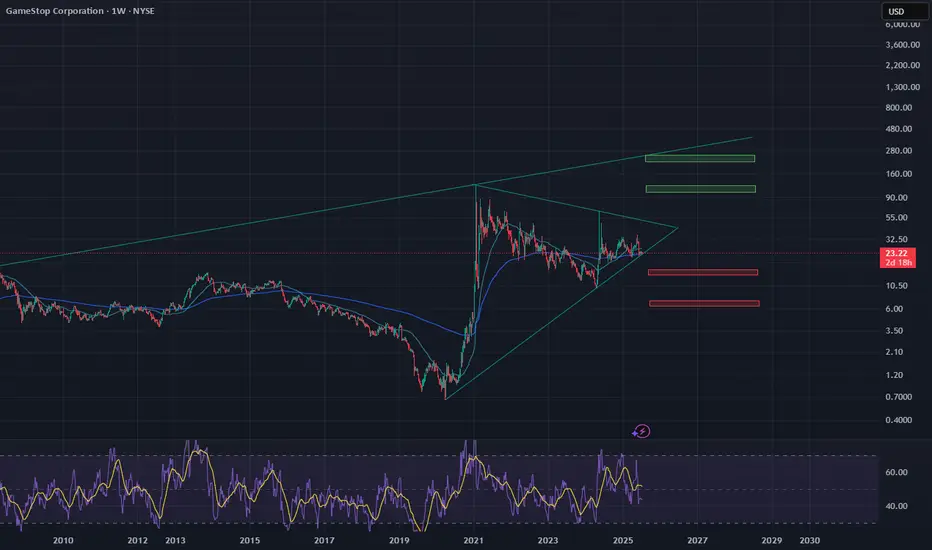
GME 1W: when the memes fade, the structure speaksGameStop is once again testing the lower boundary of its long-term consolidation, bouncing off the 21.53 zone - a level that aligns with the 0.79 Fib retracement and historical support. This zone also intersects with a key trendline on the weekly chart, and just recently, a golden cross (MA50 crossing MA200 weekly) printed - a rare but technically significant signal. The stock continues to trade inside a broad descending channel, and if this support holds, the natural next step is a move back toward the mid-range at 37.42 (0.5 Fib), followed by a possible push toward 64.92. The tactical setup favors a confirmation entry near current levels, with a stop under 21.00. Risk/reward here is among the cleanest GME has offered in months.
On the fundamental side, GameStop remains in a transitional phase. The company is shutting down unprofitable segments, reducing costs, and doubling down on e-commerce and digital distribution. Financial results are still slow to recover, but the latest Q2 2025 report showed positive operating cash flow and narrowing losses. This isn't a value play in the traditional sense - it's more about the potential for renewed retail-driven momentum if technical conditions align.
If there’s still power behind the crowd - this might be one of the most technically compelling entry zones of 2025.

GME Stop Bullish Watching for a pullback and entry or a break over the last resistance and re-test and an entry to fill the gap up. (Not financial advice, just posting my thoughts and plan)

Golden Cross on GME WeeklyGME Chart Breakdown, Déjà Vu or Destiny? Something big just lit up the weekly chart, the 50 MA has pierced through the 200 MA, forming that golden cross traders dream about. On the weekly timeframe. Not a drill.
Now, let’s rewind. The last time this pattern appeared? January 2021. The infamous squeeze. Back then, GME didn’t just nudge upward, it catapulted nearly 4000%, going from a $3 floor to $120 in a blink.
Fast forward to today, new golden cross, new setup, and a $23 floor. If history rhymes even remotely, we’re staring down a hypothetical $1000 per share move. Yes, one thousand.
Is lightning about to strike twice? Stay tuned to find out!

Is it a time for GAMESTOP? 30 $ in the sightAnalysis of the GameStop (GME) chart suggests a potential rise to 30 USD, based on current trends and technical levels. The 4-hour chart shows a recent decline following a sharp increase, with the price currently fluctuating around 23-24 USD. Key support is located at approximately 22 USD, which could act as a floor if the price starts to drop. The moving averages (e.g., 50-day and 200-day) indicate a previous upward trend, and current levels may represent a consolidation phase before the next upward move.
Breaking through resistance around 25-26 USD, which aligns with a previous peak, could pave the way for further growth. If demand increases and trading volume rises, the price could head toward 30 USD, a psychological and technical resistance level. Additional bullish signals, such as green candles or an increase in the oscillator (e.g., RSI) from current levels, could support this scenario. However, the risk of a sudden reversal should be monitored, especially if support at 22 USD is breached.
Potential TP: 30 USD
GME is ready to decide (weekly candles)I'm bullish because the market is bullish
Reasons for being Bullish
-above 200sma weekly and have held it as support
-200sma day crossed above 200sma weekly
-everyone knows about the stock, momentum could be something never seen before because of the notion of becoming rich in a day. Treating this as a casino.
Correlation between 2021 squeeze and 2024-2025 price actionRefer to my 2021 squeeze post idea, you can see a very similar pattern, I predict 30s mid august followed by another dip. MOASS? Probably not but maybe assuming crime has run out of tricks

GME Potential UpsideGME looks attractive from a risk to reward perspective. I am not interested in the short squeeze speculation but the technicals and recent acquisition of BTC in their balance sheet has caught my attention as they have been sitting on capital for quite some time now.
Theres a clear gap around 28.50 and of course looming tarrifs are something to look out for. Id keep my eye on this one.

GME LONG IDEA UPDATEDIn my previous post regarding the long opportunity on GME stock, I called a long signal after a break out of a downtrend line. However, price had dropped down to the demand zone, giving another long opportunity.
To take advantage of this long opportunity, you can buy at the current market price, while the exit will be at $20.30 and the targets can be at $35.70, $47.90 and the final target at $64.70.
Confluences for the long idea are as follows:
1. Weekly break of structure
2. Valid Inducement
3. Orderflow
4. Price within the discount
5. Price respecting bullish trendline
6. Hammer candlestick confirmation
7. Price at a support level
Disclaimer: This is not a financial advice. The outcome maybe different from the projection. Don't take the signal if you're not willing to accept the risk.

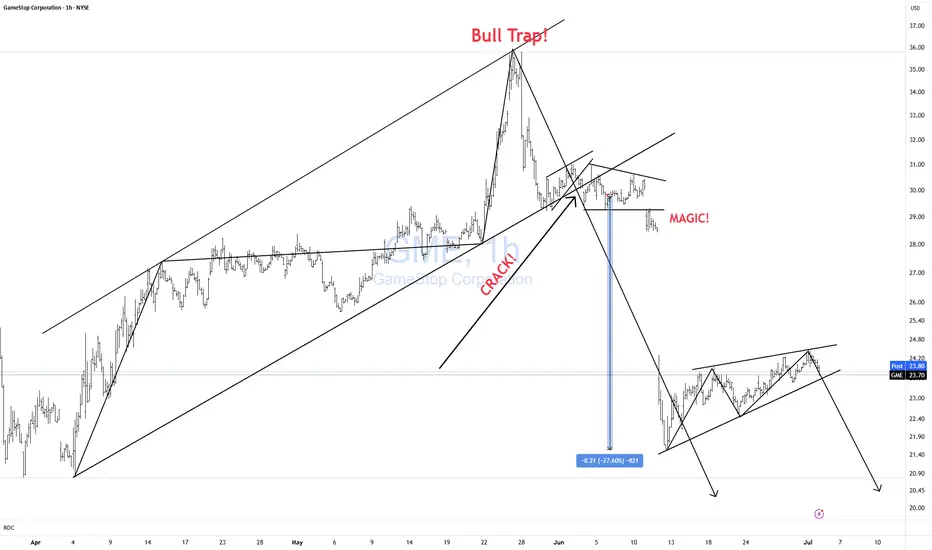
GME CRACK?Unfortunately, I keep getting forced to create new posts for the same Isea bc TV forces me to "target reached" on updates. Here is my previous post.
We have yet another bearish formation setting up in GME. Rising bearish wedge.
Wait for the CRACK!
Click Boost, like, follow, and subscribe for more!
WC: 23.59 Target: 1800-2400 MOASS: 47k-100K: PROFITI am a trader...I have one goal at the end of the day: MAKE A PROFIT
This will be my final post on Gamestop as I am now dedicating ALL of my time to Macro Market Coverage...
I FIRMLY believe that there is a high potential for markets to turn SIGNIFICANTLY LOWER over the next year and plan to show people how to trade a bear market profitably and not get absolutely wrecked
As part of my Macro Coverage I will be covering stocks that have high potential to run so I will be dropping updates on GME here and there as it runs
Ive posted every trading day (and the weekends) on Gamestop for well over a year
I was around for the original squeeze and I will be around if (no guarantees in markets as I always say) it squeezes again
Ok lets get to what you want to know:
20 Week Cycle has NOT been invalidated as far as im concerned
06/09 did see big changes but just havent seen the price improvement...yet
I think we see the price improvement start MIDDLE to END of Aug and will ramp up thru Sep/Oct
I have SPX dropping to 5100-5400 over the next couple months...that will most likely drag GME down a bit but expect 21.54 to be a solid place to position trades
If/When GME moves higher the FIBS ARE STILL YOUR GUIDE
Draw an Anchored VWAP from the 21.54 low...If GME breaks 21.54 draw another Anchored VWAP from wherever it bottoms...those two VWAPS will be the most powerful things you can put on your chart to track GME trend
TRADE WHAT YOU SEE...NOT WHAT YOU HOPE FOR
One last word on Roaring Kitty:
I do believe he is lurking and will be back...my guess as to when? Flip Mode 09/07
Histograms are not aligned yet and as you see price is choppy
From a 20 Week Cycle perspective it appears price will rise when it reaches the GREEN VERTICAL LINES
Still think this is the best interpretation ever laid out on what Roaring Kitty is doing..I obviously dont have it completely figured out though
Good Trading To You All!!!
P.S. the YEARLY VWAP is at 26....thats the likely LAUNCH point for price
