Home Depot Cup and HandleHome Depot is all set up to rocket as interest rates are cut and mortgages get cheaper. Hopefully the increased homebuilding will lead to increased sales this year and in 2026, completing the pattern.
Next report date
—
Report period
—
EPS estimate
—
Revenue estimate
—
12.90 EUR
14.29 B EUR
154.01 B EUR
994.73 M
About Home Depot, Inc. (The)
Sector
Industry
CEO
Edward P. Decker
Website
Headquarters
Atlanta
Founded
1978
ISIN
US4370761029
FIGI
BBG000K20L23
The Home Depot, Inc. engages in the sale of building materials and home improvement products. Its products include building materials, home improvement products, lawn and garden products and decor products. The firm operates through the following geographical segments: U.S., Canada and Mexico. It offers home improvement installation services, and tool and rental equipment. The company was founded by Bernard Marcus, Arthur M. Blank, Kenneth Gerald Langone and Pat Farrah on June 29, 1978 and is headquartered at Atlanta, GA.
Related stocks

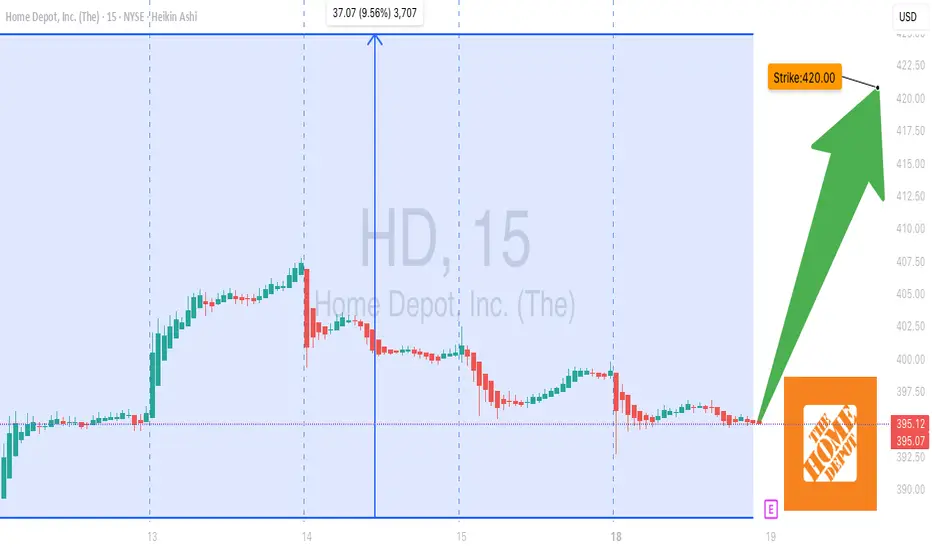
Home Depot 420C Call Setup– Big Move Expected on Earnings
# 🛠️ HD Earnings Options Play – 8/22 BMO
📊 **Market Context**
* Revenue Growth: +9.4% TTM 📈
* Gross Margin: 33.3%, Operating Margin: 12.9%, Profit Margin: 9%
* Forward EPS: \$15.60, Consensus Buy Rating
* Technical Momentum: +7.7% price drift past 2 weeks, key support \$380 / resistance \$420
* O
HD: A Breakout Play Set for New Highs! •Decisive Pattern Breakout: Home Depot has executed a robust bullish breakout from a multi-month symmetrical triangle pattern. This pattern, clearly defined by the converging vibrant green trendlines, indicates a period of consolidation followed by a strong directional move. The recent surge above

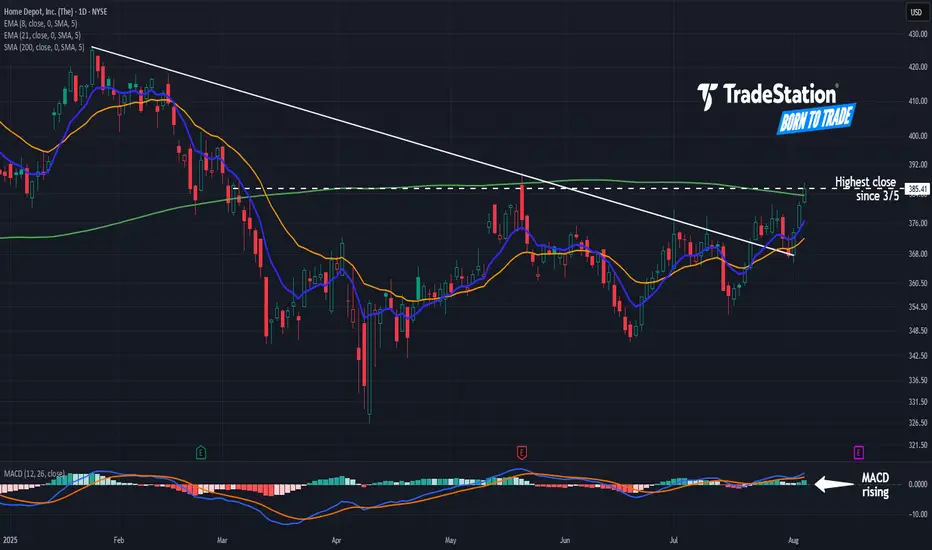
Home Depot May Have BottomedHome Depot has yet to recover from a first-quarter slide, but some traders may think the home-improvement chain has bottomed.
The first pattern on today’s chart is the series of lower highs between January and mid-July. HD has fought above that falling trendline in the last two weeks. Has resistanc
$HD - One of my bestfriend favorites <3NYSE:HD looking strong here, testing the 200-week EMA as a key support level. A classic spot for a long-term bounce. If it holds, could be building a base for a run back to the $426 highs. #HomeDepot #TechnicalAnalysis #Trading #Investing
$HD - Cookie long hold this is bread and butterNYSE:HD hold a bullish position could see over $505 long term... <3
NYSE:HD breaking out with conviction! Up 5.2% this week on increasing volume. 12 analysts maintain BUY ratings with targets up to $455 (23% upside). Technical pattern shows higher lows since April. Strong revenue growth despite

Check 350.47 support (HA-MS indicator interpretation method)
Hello, traders.
If you "Follow", you can always get new information quickly.
Have a nice day today.
-------------------------------------
(HD 1D chart)
Can the HA-MS indicator be applied to stock charts?!!!
The conclusion is that it can be applied to all charts.
However, since the stock marke

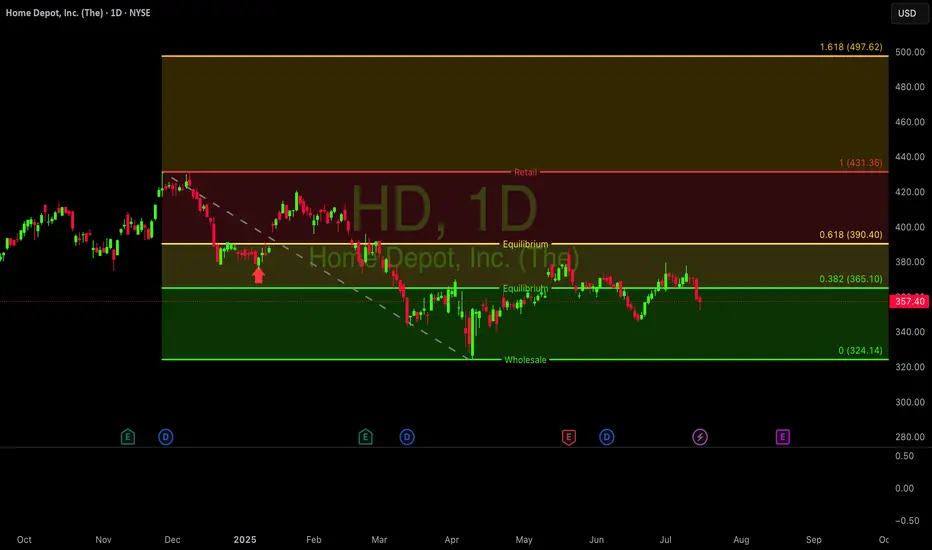
Home Depot Wave Analysis – 18 June 2025
- Home Depot broke support zone
- Likely to fall to support level at 340.00
Home Depot recently broke the support zone located between the support level 352.00 (low of wave A from April) and the 61.8% Fibonacci correction of the ABC correction (2) from April.
The breakout of this support zone acc

Long Setup: Home Depot ($HD) | Bullish Continuation Above Cloud 📈 Technical Setup:
Home Depot ( NYSE:HD ) is setting up for a potential bullish continuation after retesting the top of the Ichimoku Cloud and holding key support.
Ichimoku Cloud: Price is consolidating above the Kumo, with the Conversion Line (Tenkan) and Base Line (Kijun) flatlining — signaling p

Home Depot – Pattern Suggests C Wave Toward $315 from $367 LevelHome Depot appears to be inside a pattern that fits either an Ending Diagonal or Skewed Triangle structure. From the $367 area, a potential C wave may begin targeting the $315 zone.
Investors should be cautious, as diagonal or skewed triangle formations often involve significant uncertainty. The wh

See all ideas
Summarizing what the indicators are suggesting.
Neutral
SellBuy
Strong sellStrong buy
Strong sellSellNeutralBuyStrong buy
Neutral
SellBuy
Strong sellStrong buy
Strong sellSellNeutralBuyStrong buy
Neutral
SellBuy
Strong sellStrong buy
Strong sellSellNeutralBuyStrong buy
An aggregate view of professional's ratings.
Neutral
SellBuy
Strong sellStrong buy
Strong sellSellNeutralBuyStrong buy
Neutral
SellBuy
Strong sellStrong buy
Strong sellSellNeutralBuyStrong buy
Neutral
SellBuy
Strong sellStrong buy
Strong sellSellNeutralBuyStrong buy
Displays a symbol's price movements over previous years to identify recurring trends.
HD5834281
Home Depot, Inc. 4.875% 25-JUN-2027Yield to maturity
—
Maturity date
Jun 25, 2027
HD4971787
Home Depot, Inc. 2.7% 15-APR-2030Yield to maturity
—
Maturity date
Apr 15, 2030
HD4971788
Home Depot, Inc. 3.3% 15-APR-2040Yield to maturity
—
Maturity date
Apr 15, 2040
HD4253641
Home Depot, Inc. 4.25% 01-APR-2046Yield to maturity
—
Maturity date
Apr 1, 2046
HD.GO
Home Depot, Inc. 5.95% 01-APR-2041Yield to maturity
—
Maturity date
Apr 1, 2041
HD5475098
Home Depot, Inc. 4.95% 15-SEP-2052Yield to maturity
—
Maturity date
Sep 15, 2052
HD4401003
Home Depot, Inc. 3.5% 15-SEP-2056Yield to maturity
—
Maturity date
Sep 15, 2056
HD4287443
Home Depot, Inc. 3.35% 15-SEP-2025Yield to maturity
—
Maturity date
Sep 15, 2025
HD.GK
Home Depot, Inc. 5.875% 16-DEC-2036Yield to maturity
—
Maturity date
Dec 16, 2036
HD5834277
Home Depot, Inc. FRN 24-DEC-2025Yield to maturity
—
Maturity date
Dec 24, 2025
HD5834273
Home Depot, Inc. 5.15% 25-JUN-2026Yield to maturity
—
Maturity date
Jun 25, 2026
See all HDI bonds
Curated watchlists where HDI is featured.


Frequently Asked Questions
The current price of HDI is 361.75 EUR — it has decreased by −0.38% in the past 24 hours. Watch Home Depot, Inc. stock price performance more closely on the chart.
Depending on the exchange, the stock ticker may vary. For instance, on FWB exchange Home Depot, Inc. stocks are traded under the ticker HDI.
HDI stock has risen by 1.67% compared to the previous week, the month change is a 5.95% rise, over the last year Home Depot, Inc. has showed a 8.36% increase.
We've gathered analysts' opinions on Home Depot, Inc. future price: according to them, HDI price has a max estimate of 410.62 EUR and a min estimate of 333.79 EUR. Watch HDI chart and read a more detailed Home Depot, Inc. stock forecast: see what analysts think of Home Depot, Inc. and suggest that you do with its stocks.
HDI stock is 2.78% volatile and has beta coefficient of 0.71. Track Home Depot, Inc. stock price on the chart and check out the list of the most volatile stocks — is Home Depot, Inc. there?
Today Home Depot, Inc. has the market capitalization of 351.59 B, it has decreased by −0.74% over the last week.
Yes, you can track Home Depot, Inc. financials in yearly and quarterly reports right on TradingView.
Home Depot, Inc. is going to release the next earnings report on Nov 18, 2025. Keep track of upcoming events with our Earnings Calendar.
HDI earnings for the last quarter are 4.10 EUR per share, whereas the estimation was 4.13 EUR resulting in a −0.79% surprise. The estimated earnings for the next quarter are 3.29 EUR per share. See more details about Home Depot, Inc. earnings.
Home Depot, Inc. revenue for the last quarter amounts to 39.66 B EUR, despite the estimated figure of 39.78 B EUR. In the next quarter, revenue is expected to reach 35.05 B EUR.
HDI net income for the last quarter is 3.99 B EUR, while the quarter before that showed 3.03 B EUR of net income which accounts for 31.51% change. Track more Home Depot, Inc. financial stats to get the full picture.
Yes, HDI dividends are paid quarterly. The last dividend per share was 1.97 EUR. As of today, Dividend Yield (TTM)% is 2.20%. Tracking Home Depot, Inc. dividends might help you take more informed decisions.
Home Depot, Inc. dividend yield was 2.15% in 2024, and payout ratio reached 60.36%. The year before the numbers were 2.35% and 55.32% correspondingly. See high-dividend stocks and find more opportunities for your portfolio.
As of Sep 11, 2025, the company has 470.1 K employees. See our rating of the largest employees — is Home Depot, Inc. on this list?
EBITDA measures a company's operating performance, its growth signifies an improvement in the efficiency of a company. Home Depot, Inc. EBITDA is 22.38 B EUR, and current EBITDA margin is 15.82%. See more stats in Home Depot, Inc. financial statements.
Like other stocks, HDI shares are traded on stock exchanges, e.g. Nasdaq, Nyse, Euronext, and the easiest way to buy them is through an online stock broker. To do this, you need to open an account and follow a broker's procedures, then start trading. You can trade Home Depot, Inc. stock right from TradingView charts — choose your broker and connect to your account.
Investing in stocks requires a comprehensive research: you should carefully study all the available data, e.g. company's financials, related news, and its technical analysis. So Home Depot, Inc. technincal analysis shows the strong buy rating today, and its 1 week rating is buy. Since market conditions are prone to changes, it's worth looking a bit further into the future — according to the 1 month rating Home Depot, Inc. stock shows the buy signal. See more of Home Depot, Inc. technicals for a more comprehensive analysis.
If you're still not sure, try looking for inspiration in our curated watchlists.
If you're still not sure, try looking for inspiration in our curated watchlists.