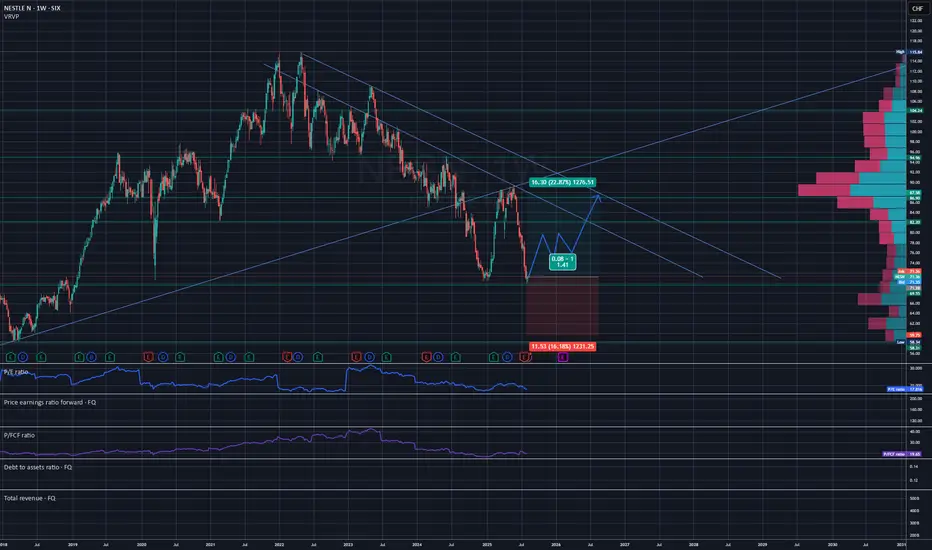
NESN predictionBased on technical analysis - price action and relevant indicator templates - I estimate that NESTLE will be up around 23% by mid Aug 2026.
I expect it to bounce up from ~71 USD price area sooner than later, and will with a few volatile corrections, still trend upwards until it hit the target pric
Next report date
—
Report period
—
EPS estimate
—
Revenue estimate
—
4.29 EUR
11.58 B EUR
97.17 B EUR
2.48 B
About NESTLE N
Sector
Industry
CEO
Laurent Freixe
Website
Headquarters
Vevey
Founded
1866
ISIN
CH0038863350
FIGI
BBG000BTVNX2
Nestlé SA is a nutrition, health, and wellness company, which engages in the business of manufacturing, supplying, and producing prepared dishes and cooking aids, milk-based products, pharmaceuticals and ophthalmic goods, baby foods, and cereals. It operates through the following segments: Zone North America; Zone Europe; Zone Asia, Oceania, and Africa; Zone Latin America; Zone Greater China; Nestlé Health Science; and Nespresso. The company was founded by Henri Nestlé in 1866 and is headquartered in Vevey, Switzerland.
Related stocks
Long NSRGY on weekly time frameI like this company on a fundamental level. besides technical analysis. I think there will be a flood to dividend names soon if/when interest rates go down. bond yield should drop as well and investors want some passive income. Who better to go to then the company that owns the world lol. But on a s

Nestlé Returns to Its Roots to Regain Lost GroundBy Ion Jauregui – Analyst at ActivTrades
Nestlé (SWX: NESN), one of the world’s food industry giants, has announced a major strategic shift: a renewed focus on what it does best. The company’s new CEO, Laurent Freixe, has made it clear that the era of forced diversification—particularly into areas

BUY NESTLE!!!Easy buy opportunity presented to us with Nestle. Safe to ride this to all time highs and beyond

Flight to Safety?It looks like Wave 5 could be in and we are getting the bounce of the Fibonacci Speed Fan and POC level. The Swiss Franc is also crowded short, keep an eye on this stock as it has bounced perfectly from the expected levels. One to keep an eye on, as the market looks to derisk from tech after the exp


Kennedy and Nestlé: The Beginning of a New Era for the Industry?Nestlé (Ticker AT: NESN.US) is looking to calm market fears following criticism from Robert F. Kennedy Jr. appointed by Donald Trump as the new U.S. health chief. Kennedy, known for his stance against packaged foods, has used his platform to question products such as Kellogg's (Ticker AT: K.US) Frui

Nestlé SA: A stock to keep foreverCompany Overview
Nestlé S.A., established in 1866 and headquartered in Vevey, Switzerland, is the world’s largest food and beverage conglomerate. Known for its extensive portfolio of iconic brands like Nescafé, KitKat, Maggi, and Perrier, Nestlé has maintained a strong presence in North America and

Nestle Approaching Buy ZoneWe have taken out the Covid lows and we could enter the X phase of the WXY correction. In the longer term I do expect one last flush to the downside, but the downside does appears to be exhausted here as we are in the final phase of the 5 wave move to the downside. I'm playing this as a short term b

Possible long-term bottom on Nestle - weekly chart analysisPossible completion of an ABC corrective move on the weekly timeframe
RSI divergence can be observed
strong weekly candle close above previous weekly lows

See all ideas
Summarizing what the indicators are suggesting.
Neutral
SellBuy
Strong sellStrong buy
Strong sellSellNeutralBuyStrong buy
Neutral
SellBuy
Strong sellStrong buy
Strong sellSellNeutralBuyStrong buy
Neutral
SellBuy
Strong sellStrong buy
Strong sellSellNeutralBuyStrong buy
An aggregate view of professional's ratings.
Neutral
SellBuy
Strong sellStrong buy
Strong sellSellNeutralBuyStrong buy
Neutral
SellBuy
Strong sellStrong buy
Strong sellSellNeutralBuyStrong buy
Neutral
SellBuy
Strong sellStrong buy
Strong sellSellNeutralBuyStrong buy
Displays a symbol's price movements over previous years to identify recurring trends.
Curated watchlists where NESR is featured.


Frequently Asked Questions
The current price of NESR is 80.22 EUR — it has decreased by −0.59% in the past 24 hours. Watch NESTLE NAM. SF-,10 stock price performance more closely on the chart.
Depending on the exchange, the stock ticker may vary. For instance, on FWB exchange NESTLE NAM. SF-,10 stocks are traded under the ticker NESR.
NESR stock has risen by 4.74% compared to the previous week, the month change is a −3.73% fall, over the last year NESTLE NAM. SF-,10 has showed a −3.35% decrease.
We've gathered analysts' opinions on NESTLE NAM. SF-,10 future price: according to them, NESR price has a max estimate of 107.15 EUR and a min estimate of 75.33 EUR. Watch NESR chart and read a more detailed NESTLE NAM. SF-,10 stock forecast: see what analysts think of NESTLE NAM. SF-,10 and suggest that you do with its stocks.
NESR reached its all-time high on May 27, 2025 with the price of 95.34 EUR, and its all-time low was 23.31 EUR and was reached on Mar 20, 2009. View more price dynamics on NESR chart.
See other stocks reaching their highest and lowest prices.
See other stocks reaching their highest and lowest prices.
NESR stock is 0.95% volatile and has beta coefficient of 0.69. Track NESTLE NAM. SF-,10 stock price on the chart and check out the list of the most volatile stocks — is NESTLE NAM. SF-,10 there?
Today NESTLE NAM. SF-,10 has the market capitalization of 203.07 B, it has increased by 0.91% over the last week.
Yes, you can track NESTLE NAM. SF-,10 financials in yearly and quarterly reports right on TradingView.
NESTLE NAM. SF-,10 is going to release the next earnings report on Feb 19, 2026. Keep track of upcoming events with our Earnings Calendar.
NESR earnings for the last half-year are 2.11 EUR per share, whereas the estimation was 2.28 EUR, resulting in a −7.37% surprise. The estimated earnings for the next half-year are 2.14 EUR per share. See more details about NESTLE NAM. SF-,10 earnings.
NESTLE NAM. SF-,10 revenue for the last half-year amounts to 47.32 B EUR, despite the estimated figure of 47.57 B EUR. In the next half-year revenue is expected to reach 49.01 B EUR.
NESR net income for the last half-year is 5.42 B EUR, while the previous report showed 5.57 B EUR of net income which accounts for −2.76% change. Track more NESTLE NAM. SF-,10 financial stats to get the full picture.
Yes, NESR dividends are paid annually. The last dividend per share was 3.25 EUR. As of today, Dividend Yield (TTM)% is 4.05%. Tracking NESTLE NAM. SF-,10 dividends might help you take more informed decisions.
NESTLE NAM. SF-,10 dividend yield was 4.07% in 2024, and payout ratio reached 72.75%. The year before the numbers were 3.08% and 70.82% correspondingly. See high-dividend stocks and find more opportunities for your portfolio.
As of Aug 24, 2025, the company has 277 K employees. See our rating of the largest employees — is NESTLE NAM. SF-,10 on this list?
EBITDA measures a company's operating performance, its growth signifies an improvement in the efficiency of a company. NESTLE NAM. SF-,10 EBITDA is 20.09 B EUR, and current EBITDA margin is 21.09%. See more stats in NESTLE NAM. SF-,10 financial statements.
Like other stocks, NESR shares are traded on stock exchanges, e.g. Nasdaq, Nyse, Euronext, and the easiest way to buy them is through an online stock broker. To do this, you need to open an account and follow a broker's procedures, then start trading. You can trade NESTLE NAM. SF-,10 stock right from TradingView charts — choose your broker and connect to your account.
Investing in stocks requires a comprehensive research: you should carefully study all the available data, e.g. company's financials, related news, and its technical analysis. So NESTLE NAM. SF-,10 technincal analysis shows the sell today, and its 1 week rating is neutral. Since market conditions are prone to changes, it's worth looking a bit further into the future — according to the 1 month rating NESTLE NAM. SF-,10 stock shows the buy signal. See more of NESTLE NAM. SF-,10 technicals for a more comprehensive analysis.
If you're still not sure, try looking for inspiration in our curated watchlists.
If you're still not sure, try looking for inspiration in our curated watchlists.