TER watch $187-189: Major Resistance zone should give a DIP buy TER got a serious boost from the last Earnings report.
It is about to hit Major Resistance zone at $187.34-189.74
Look for a Break-n-Retest or Dip-to-Fib like $170 zone to buy.
.
See "Related Publications" for previous plots such as this BOTTOM CALL:
Hit BOOST and FOLLOW for more such PRECISE a
Teradyne, Inc.
No trades
Next report date
—
Report period
—
EPS estimate
—
Revenue estimate
—
2.34 EUR
523.92 M EUR
2.72 B EUR
156.21 M
About Teradyne, Inc.
Sector
Industry
CEO
Gregory Stephen Smith
Website
Headquarters
North Reading
Founded
1960
Identifiers
3
ISINUS8807701029
Teradyne, Inc. engages in the development and sale of automatic test systems. It operates through the following business segments: Semiconductor Test, Robotics, and All Other. The Semiconductor Test segment designs, manufactures, and markets semiconductor test products and services. The Robotics segment includes operations related to the design, manufacturing, and marketing of collaborative robotic arms, autonomous mobile robots, and advanced robotic control software. The company was founded by Alexander V. d'Arbeloff and Nicholas DeWolf in 1960 and is headquartered in North Reading, MA.
Related stocks

Teradyne is breaking out!NASDAQ:TER BB's are expanding on the 3M while breaking previous ATH.
This is a multi year trade with a obvious target op 1.618

Teradyne Inc $TER | Precision in Every Robot Move BUYTeradyne delivers precision testing and automation hardware that keeps industrial robots running at peak performance. Perfect execution starts with NASDAQ:TER at the core of manufacturing and assembly lines worldwide.

Second phase of the Ai revolutionThis company makes some of the robots used by Amazon. Hedge against the robots taking your job by owning the company making the robots ..
Looking for breakout above 144
Idea is inspired by Citrini Research report on the company which you can find on google for real analysis

TER heads up at $115: Dual Fib Resistance could give a DIP TER earnings report gave it a surge with follow-through.
Now approaching a significant resistance $114.97-115.91
Expecting a pullback from here or at least a few orbits
.
See "Related Publications" for previous plots ------------>>>>>>>
.

TER Just Ignited: Breakout, Volume Spike and Re-Rating in MotionAlright, if you’re watching Teradyne (TER) right now, this thing just exploded and the chart is absolutely textbook. Let’s break it down for the folks playing technicals and momentum.
Candlestick Action
TER just printed a massive bullish marubozu — up +18.65%, closed right near the high of day. Zer
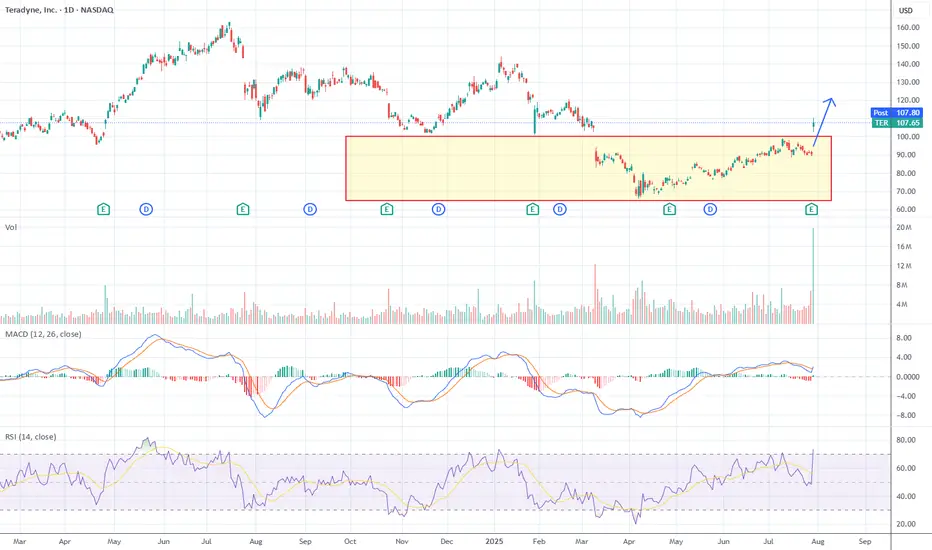
TER watch $82.18/51: Significant Resistance to make Dip or BreakTER trying to break out of the range bound action.
Currently testing significant resistance $82.18-82.50
Look for a Dip-to-Fib or Break-n-Retest for long entry.
.
Previous Analysis that caught the local bottom:
===============================================
.

TER watch $71.76-73.18: Double Golden Support as LaunchPad hopeTER is accumulating at a major support zone.
Golden Genesis + Golden Covid fib confluence.
If market tide rises, this one is primed for a push.

TERADYNE stock Chart Fibonacci Analysis 050125Trading Idea
1) Find a FIBO slingshot
2) Check FIBO 61.80% level
3) Entry Point > 71.7/61.80%
Chart time frame: D
A) 15 min(1W-3M)
B) 1 hr(3M-6M)
C) 4 hr(6M-1year)
D) 1 day(1-3years)
Stock progress: A
A) Keep rising over 61.80% resistance
B) 61.80% resistance
C) 61.80% support
D) Hit the bottom

1/29/25 - $ter - I'll bite. Micro long into print.1/29/25 :: VROCKSTAR :: NASDAQ:TER
I'll bite. Micro long into print.
- sidelines watching this for some time
- last two prints had pretty bad reactions - not ideal - chart also looks double-top-ish zoom out, not great
- but financials still solid, growth great, mgns great... i couldn't play for

See all ideas
Summarizing what the indicators are suggesting.
Neutral
SellBuy
Strong sellStrong buy
Strong sellSellNeutralBuyStrong buy
Neutral
SellBuy
Strong sellStrong buy
Strong sellSellNeutralBuyStrong buy
Neutral
SellBuy
Strong sellStrong buy
Strong sellSellNeutralBuyStrong buy
An aggregate view of professional's ratings.
Neutral
SellBuy
Strong sellStrong buy
Strong sellSellNeutralBuyStrong buy
Neutral
SellBuy
Strong sellStrong buy
Strong sellSellNeutralBuyStrong buy
Neutral
SellBuy
Strong sellStrong buy
Strong sellSellNeutralBuyStrong buy
Displays a symbol's price movements over previous years to identify recurring trends.
Curated watchlists where TEY is featured.

Frequently Asked Questions
The current price of TEY is 166.18 EUR — it has decreased by −0.60% in the past 24 hours. Watch Teradyne, Inc. stock price performance more closely on the chart.
Depending on the exchange, the stock ticker may vary. For instance, on FWB exchange Teradyne, Inc. stocks are traded under the ticker TEY.
TEY stock has fallen by −0.31% compared to the previous week, the month change is a 5.18% rise, over the last year Teradyne, Inc. has showed a 36.68% increase.
We've gathered analysts' opinions on Teradyne, Inc. future price: according to them, TEY price has a max estimate of 200.07 EUR and a min estimate of 140.48 EUR. Watch TEY chart and read a more detailed Teradyne, Inc. stock forecast: see what analysts think of Teradyne, Inc. and suggest that you do with its stocks.
TEY stock is 0.60% volatile and has beta coefficient of 1.60. Track Teradyne, Inc. stock price on the chart and check out the list of the most volatile stocks — is Teradyne, Inc. there?
Today Teradyne, Inc. has the market capitalization of 26.22 B, it has increased by 6.86% over the last week.
Yes, you can track Teradyne, Inc. financials in yearly and quarterly reports right on TradingView.
Teradyne, Inc. is going to release the next earnings report on Jan 28, 2026. Keep track of upcoming events with our Earnings Calendar.
TEY earnings for the last quarter are 0.72 EUR per share, whereas the estimation was 0.67 EUR resulting in a 7.58% surprise. The estimated earnings for the next quarter are 1.15 EUR per share. See more details about Teradyne, Inc. earnings.
Teradyne, Inc. revenue for the last quarter amounts to 655.52 M EUR, despite the estimated figure of 634.15 M EUR. In the next quarter, revenue is expected to reach 825.14 M EUR.
TEY net income for the last quarter is 101.89 M EUR, while the quarter before that showed 66.53 M EUR of net income which accounts for 53.14% change. Track more Teradyne, Inc. financial stats to get the full picture.
Yes, TEY dividends are paid quarterly. The last dividend per share was 0.10 EUR. As of today, Dividend Yield (TTM)% is 0.24%. Tracking Teradyne, Inc. dividends might help you take more informed decisions.
Teradyne, Inc. dividend yield was 0.38% in 2024, and payout ratio reached 14.45%. The year before the numbers were 0.41% and 16.11% correspondingly. See high-dividend stocks and find more opportunities for your portfolio.
As of Dec 31, 2025, the company has 6.5 K employees. See our rating of the largest employees — is Teradyne, Inc. on this list?
EBITDA measures a company's operating performance, its growth signifies an improvement in the efficiency of a company. Teradyne, Inc. EBITDA is 567.34 M EUR, and current EBITDA margin is 23.71%. See more stats in Teradyne, Inc. financial statements.
Like other stocks, TEY shares are traded on stock exchanges, e.g. Nasdaq, Nyse, Euronext, and the easiest way to buy them is through an online stock broker. To do this, you need to open an account and follow a broker's procedures, then start trading. You can trade Teradyne, Inc. stock right from TradingView charts — choose your broker and connect to your account.
Investing in stocks requires a comprehensive research: you should carefully study all the available data, e.g. company's financials, related news, and its technical analysis. So Teradyne, Inc. technincal analysis shows the buy rating today, and its 1 week rating is buy. Since market conditions are prone to changes, it's worth looking a bit further into the future — according to the 1 month rating Teradyne, Inc. stock shows the buy signal. See more of Teradyne, Inc. technicals for a more comprehensive analysis.
If you're still not sure, try looking for inspiration in our curated watchlists.
If you're still not sure, try looking for inspiration in our curated watchlists.