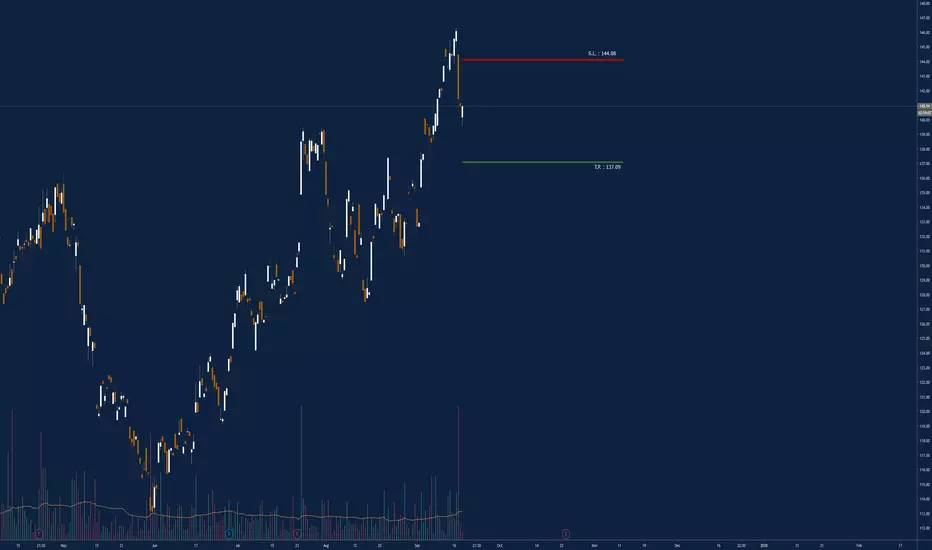
Valmond Inc ,,, buy opportinity Uptrend
My main strategy is finding the end of corrections and getting trigger as a new uptrend.
The best zone for finishing corrections is 50-61.8 Fib Ret then breaking a descending trend line and passing out of a price level. I suppose this is one of the best and by setting a sl in a sure place,
Next report date
—
Report period
—
EPS estimate
—
Revenue estimate
—
10 EUR
336.41 M EUR
3.94 B EUR
19.45 M
About Valmont Industries, Inc.
Sector
Industry
CEO
Avner M. Applbaum
Website
Headquarters
Omaha
Founded
1946
FIGI
BBG000GNVLM6
Valmont Industries, Inc. engages in the manufacture of products and services for infrastructure and agriculture markets. It operates through the Infrastructure and Agriculture segments. The Infrastructure segment includes five primary product lines such as Transmission, Distribution, and Substation, Lighting and Transportation, Coatings, Telecommunications, and Renewable Energy. The Agriculture segment produces mechanized irrigation equipment and related services. The company was founded by Robert B. Daugherty in 1946 and is headquartered in Omaha, NE.
Related stocks

VMI +25%There were a strong impulse movement and over 1 year consolidation. Now it's ready to continue main movement


VMI: Sort opportunityAn intraday high potential, Back Tested Sort Analysis.
We ll try to enter into the correction of the uptrend movement.
DETAILS ON THE CHART
NOTE: Entry range area above the entry point, is calculated upon 80% of the recorded pullback back tested past performances
DISCLAIMER: This is a te
Valmont Announces $250 Million Share Repurchase ReauthorizationVMI: Valmont Industries, Inc.
2018-10-31 08:30:00
Valmont Announces $250 Million Share Repurchase Reauthorization

Dow drops once again #23 (VMI)Technical Concept: Support broken becomes Resistance (Red Arrows= Resistance) (Blue Arrows= Support)
I not use sophisticated Technical jargon in an attempt to persuade and impress the reader because I not a Charlatan
I do not use fancy Charts plenty of Indicators, Oscillators, and other stuff, all i


See all ideas
Summarizing what the indicators are suggesting.
Neutral
SellBuy
Strong sellStrong buy
Strong sellSellNeutralBuyStrong buy
Neutral
SellBuy
Strong sellStrong buy
Strong sellSellNeutralBuyStrong buy
Neutral
SellBuy
Strong sellStrong buy
Strong sellSellNeutralBuyStrong buy
An aggregate view of professional's ratings.
Neutral
SellBuy
Strong sellStrong buy
Strong sellSellNeutralBuyStrong buy
Neutral
SellBuy
Strong sellStrong buy
Strong sellSellNeutralBuyStrong buy
Neutral
SellBuy
Strong sellStrong buy
Strong sellSellNeutralBuyStrong buy
Displays a symbol's price movements over previous years to identify recurring trends.
VMI4162440
Valmont Industries, Inc. 5.25% 01-OCT-2054Yield to maturity
6.18%
Maturity date
Oct 1, 2054
VMI4162438
Valmont Industries, Inc. 5.0% 01-OCT-2044Yield to maturity
5.93%
Maturity date
Oct 1, 2044
See all VI1 bonds
Frequently Asked Questions
The current price of VI1 is 316 EUR — it has increased by 1.28% in the past 24 hours. Watch VALMONT IND. INC. DL 1 stock price performance more closely on the chart.
Depending on the exchange, the stock ticker may vary. For instance, on FWB exchange VALMONT IND. INC. DL 1 stocks are traded under the ticker VI1.
VI1 stock has risen by 2.60% compared to the previous week, the month change is a 9.72% rise, over the last year VALMONT IND. INC. DL 1 has showed a 23.44% increase.
We've gathered analysts' opinions on VALMONT IND. INC. DL 1 future price: according to them, VI1 price has a max estimate of 340.45 EUR and a min estimate of 323.42 EUR. Watch VI1 chart and read a more detailed VALMONT IND. INC. DL 1 stock forecast: see what analysts think of VALMONT IND. INC. DL 1 and suggest that you do with its stocks.
VI1 stock is 0.63% volatile and has beta coefficient of 1.09. Track VALMONT IND. INC. DL 1 stock price on the chart and check out the list of the most volatile stocks — is VALMONT IND. INC. DL 1 there?
Today VALMONT IND. INC. DL 1 has the market capitalization of 6.27 B, it has increased by 3.25% over the last week.
Yes, you can track VALMONT IND. INC. DL 1 financials in yearly and quarterly reports right on TradingView.
VALMONT IND. INC. DL 1 is going to release the next earnings report on Oct 22, 2025. Keep track of upcoming events with our Earnings Calendar.
VI1 earnings for the last quarter are 4.14 EUR per share, whereas the estimation was 4.00 EUR resulting in a 3.57% surprise. The estimated earnings for the next quarter are 3.97 EUR per share. See more details about VALMONT IND. INC. DL 1 earnings.
VALMONT IND. INC. DL 1 revenue for the last quarter amounts to 891.81 M EUR, despite the estimated figure of 870.48 M EUR. In the next quarter, revenue is expected to reach 890.48 M EUR.
VI1 net income for the last quarter is −25.69 M EUR, while the quarter before that showed 80.66 M EUR of net income which accounts for −131.85% change. Track more VALMONT IND. INC. DL 1 financial stats to get the full picture.
Yes, VI1 dividends are paid quarterly. The last dividend per share was 0.58 EUR. As of today, Dividend Yield (TTM)% is 0.70%. Tracking VALMONT IND. INC. DL 1 dividends might help you take more informed decisions.
VALMONT IND. INC. DL 1 dividend yield was 0.79% in 2024, and payout ratio reached 13.96%. The year before the numbers were 1.03% and 33.66% correspondingly. See high-dividend stocks and find more opportunities for your portfolio.
As of Aug 7, 2025, the company has 10.99 K employees. See our rating of the largest employees — is VALMONT IND. INC. DL 1 on this list?
EBITDA measures a company's operating performance, its growth signifies an improvement in the efficiency of a company. VALMONT IND. INC. DL 1 EBITDA is 505.81 M EUR, and current EBITDA margin is 15.29%. See more stats in VALMONT IND. INC. DL 1 financial statements.
Like other stocks, VI1 shares are traded on stock exchanges, e.g. Nasdaq, Nyse, Euronext, and the easiest way to buy them is through an online stock broker. To do this, you need to open an account and follow a broker's procedures, then start trading. You can trade VALMONT IND. INC. DL 1 stock right from TradingView charts — choose your broker and connect to your account.
Investing in stocks requires a comprehensive research: you should carefully study all the available data, e.g. company's financials, related news, and its technical analysis. So VALMONT IND. INC. DL 1 technincal analysis shows the buy rating today, and its 1 week rating is buy. Since market conditions are prone to changes, it's worth looking a bit further into the future — according to the 1 month rating VALMONT IND. INC. DL 1 stock shows the strong buy signal. See more of VALMONT IND. INC. DL 1 technicals for a more comprehensive analysis.
If you're still not sure, try looking for inspiration in our curated watchlists.
If you're still not sure, try looking for inspiration in our curated watchlists.