WMT - Our profit target is near, secure some profitsWhen I posted the long trade on Aug. 29th, I did not expect it to run that quick.
Who of you guys or gals pushed it that quick? §8-)
However, I will trail my stop below the last red candles low.
We are not here to win a contest, so we secure some profit, just in case price drops before the Center
Key facts today
Next report date
—
Report period
—
EPS estimate
—
Revenue estimate
—
2.33 EUR
18.76 B EUR
657.47 B EUR
4.35 B
About Walmart Inc.
Sector
Industry
CEO
C. Douglas McMillon
Website
Headquarters
Bentonville
Founded
1962
ISIN
US9311421039
FIGI
BBG000D8VSV7
Walmart, Inc. engages in the retail and wholesale business. The company offers an assortment of merchandise and services at everyday low prices. It operates through the following business segments: Walmart U.S., Walmart International, and Sam's Club. The Walmart U.S. segment operates as a mass merchandiser of consumer products, operating under the Walmart and Walmart Neighborhood Market brands, including walmart.com. The Walmart International segment includes operations of wholly-owned subsidiaries in Canada, Chile, China, and Africa, and majority-owned subsidiaries in India, as well as Mexico and Central America. The Sam's Club segment manages membership-only warehouse clubs and operates samsclub.com. The company was founded by Samuel Moore Walton and James Lawrence Walton on July 2, 1962 and is headquartered in Bentonville, AR.
Related stocks

Master Trader Series: Peter Lynch and "Trade What You Know"Timeless Investing Lessons from Peter Lynch.
When most people think of successful investors, big names like Warren Buffett, George Soros, or Ray Dalio come to mind. But for many everyday investors, Peter Lynch is the most relatable legend of them all. Why? Because his advice didn’t come wrapped
Walmart: On Track for Further DeclinesWalmart shares have recently continued their planned sell-off, further extending magenta wave (C). Although the stock has traded in a narrow sideways range since last Wednesday, a further decline appears likely in the near term. The downward move is expected to bottom out at the low of green wave ,

Impulse buying WMT is always better than impulse buying AT WMTI meant to post this Friday and something came up. I meant to post it again Saturday but the weather was too nice. I meant to post this yesterday but my computer was glitchy. So hopefully this will post this morning. And if she goes higher from here, feel free not to give me credit because I'm p

WALLMART🔎 MTF & ITF Analysis
HTF (Yearly–Quarterly):
Strong demand foundation from 45–82, average ~66.
Long-term trend: UP.
MTF (Monthly–Daily):
Demand zones clustering 78–96, avg ~90.
Trend: UP → clean bullish alignment.
ITF (60M–240M):
Demand tightly packed 94–96.
Trend: UP → confirms micro-bulli

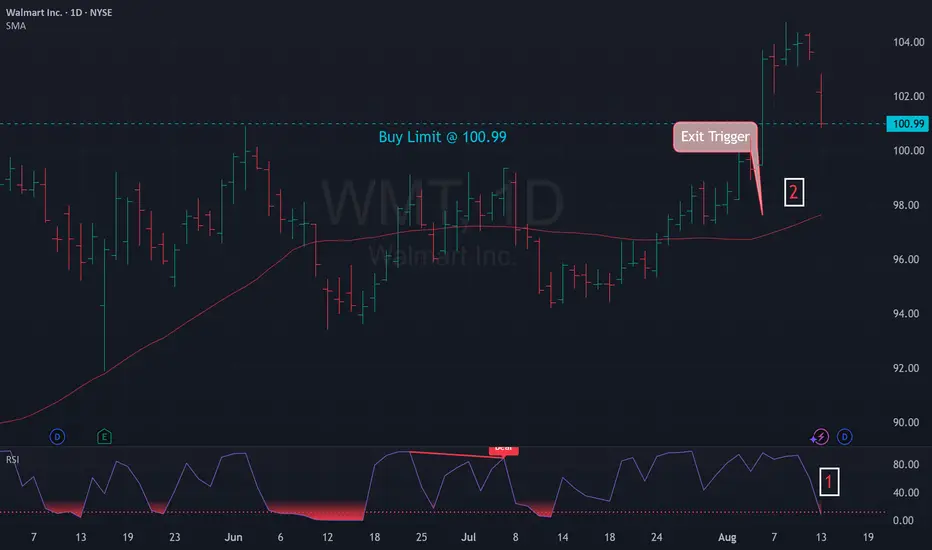
Mean Reversion Setup: WMT1. RSI in oversold region
2. Price likely to rebound back the the mean
Trade Rules:
Entry Trigger - RSI has cross below oversold region, enter limit buy at close price
Exit Trigger - Close at market when close price cross above exit trigger (Red Line)
WMT ran into a buyers zone. A nice Long opportunityOn the daily time-frame we see WMT running into the old buyers zone and stopping dead, instead of breaking through it.
It's exactly where the 1/4 line is.
So, if price can't get to the L-MLH, we have a "potential" Hagopian at hand. And that tells us, price will go more in the opposite direction tha

Walmart Stock Trading in Bullish Trend - Upside Potential AheadWalmart Inc. (WMT) shares are currently exhibiting a bullish trend, maintaining upward momentum over recent trading sessions. While the stock has been consolidating in a range over the past few days, the broader outlook remains positive, suggesting potential for further gains in upcoming sessions.

return to proven =BUYers presents a logical long entry1->5: We go from a bit of sideways movement to create a higher high in five, the origin of which is from the solid major low 4
5->6 : a return to the solid major low 4 , with number 6 marking out the meeting point of the sellers from point 5 and the buyers from point 4, to determine who will be co

WMT - Walmart turns southI attached the A-Handle of the fork to the GAP from November 2025, because a GAP is also a Pivot.
As we see, price reacts not bad at the Centerline.
Price failed to make a new high.
Then it broke the Centerline and retested it.
No we are trading in the midst of the old accummulation zone where Buy

See all ideas
Summarizing what the indicators are suggesting.
Neutral
SellBuy
Strong sellStrong buy
Strong sellSellNeutralBuyStrong buy
Neutral
SellBuy
Strong sellStrong buy
Strong sellSellNeutralBuyStrong buy
Neutral
SellBuy
Strong sellStrong buy
Strong sellSellNeutralBuyStrong buy
An aggregate view of professional's ratings.
Neutral
SellBuy
Strong sellStrong buy
Strong sellSellNeutralBuyStrong buy
Neutral
SellBuy
Strong sellStrong buy
Strong sellSellNeutralBuyStrong buy
Neutral
SellBuy
Strong sellStrong buy
Strong sellSellNeutralBuyStrong buy
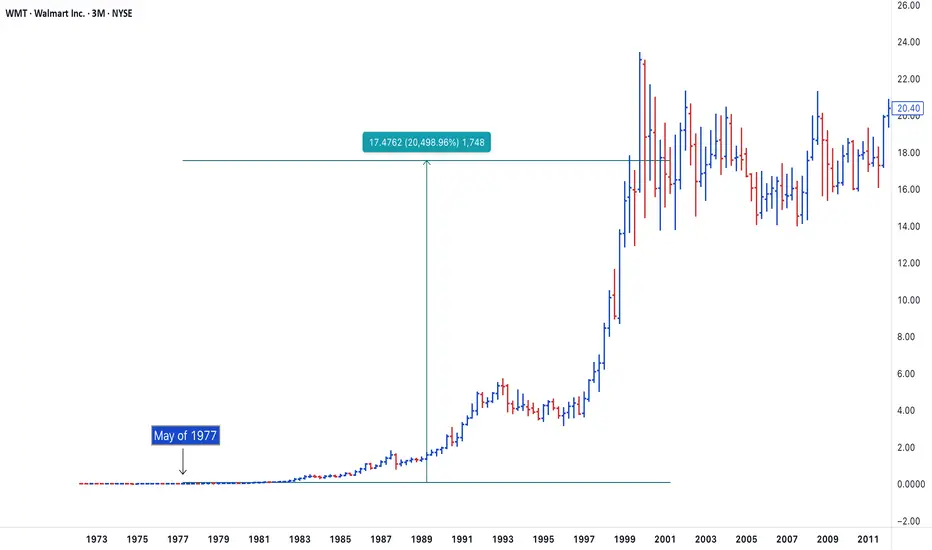
Displays a symbol's price movements over previous years to identify recurring trends.
WMT4886982
Walmart Inc. 2.375% 24-SEP-2029Yield to maturity
—
Maturity date
Sep 24, 2029
WMT5472137
Walmart Inc. 4.5% 09-SEP-2052Yield to maturity
—
Maturity date
Sep 9, 2052
WMT6060989
Walmart Inc. FRN 28-APR-2027Yield to maturity
—
Maturity date
Apr 28, 2027
WMT5571329
Walmart Inc. 4.5% 15-APR-2053Yield to maturity
—
Maturity date
Apr 15, 2053
WMT4887055
Walmart Inc. 2.95% 24-SEP-2049Yield to maturity
—
Maturity date
Sep 24, 2049
WMT5571287
Walmart Inc. 4.0% 15-APR-2026Yield to maturity
—
Maturity date
Apr 15, 2026
WMT4055720
Walmart Inc. 4.75% 02-OCT-2043Yield to maturity
—
Maturity date
Oct 2, 2043
WMT.IJ
Walmart Inc. 5.625% 01-APR-2040Yield to maturity
—
Maturity date
Apr 1, 2040
WMT6060990
Walmart Inc. 4.1% 28-APR-2027Yield to maturity
—
Maturity date
Apr 28, 2027
WMT5571288
Walmart Inc. 3.9% 15-APR-2028Yield to maturity
—
Maturity date
Apr 15, 2028
WMT4117478
Walmart Inc. 4.3% 22-APR-2044Yield to maturity
—
Maturity date
Apr 22, 2044
See all WMT bonds
Curated watchlists where WMT is featured.


Frequently Asked Questions
The current price of WMT is 86.10 EUR — it has decreased by −1.60% in the past 24 hours. Watch Walmart Inc. stock price performance more closely on the chart.
Depending on the exchange, the stock ticker may vary. For instance, on FWB exchange Walmart Inc. stocks are traded under the ticker WMT.
WMT stock has risen by 2.64% compared to the previous week, the month change is a −3.28% fall, over the last year Walmart Inc. has showed a 21.32% increase.
We've gathered analysts' opinions on Walmart Inc. future price: according to them, WMT price has a max estimate of 109.13 EUR and a min estimate of 88.50 EUR. Watch WMT chart and read a more detailed Walmart Inc. stock forecast: see what analysts think of Walmart Inc. and suggest that you do with its stocks.
WMT stock is 0.33% volatile and has beta coefficient of 0.77. Track Walmart Inc. stock price on the chart and check out the list of the most volatile stocks — is Walmart Inc. there?
Today Walmart Inc. has the market capitalization of 684.30 B, it has increased by 0.41% over the last week.
Yes, you can track Walmart Inc. financials in yearly and quarterly reports right on TradingView.
Walmart Inc. is going to release the next earnings report on Nov 20, 2025. Keep track of upcoming events with our Earnings Calendar.
WMT earnings for the last quarter are 0.60 EUR per share, whereas the estimation was 0.64 EUR resulting in a −7.20% surprise. The estimated earnings for the next quarter are 0.51 EUR per share. See more details about Walmart Inc. earnings.
Walmart Inc. revenue for the last quarter amounts to 155.40 B EUR, despite the estimated figure of 154.11 B EUR. In the next quarter, revenue is expected to reach 151.47 B EUR.
WMT net income for the last quarter is 6.15 B EUR, while the quarter before that showed 3.96 B EUR of net income which accounts for 55.34% change. Track more Walmart Inc. financial stats to get the full picture.
Yes, WMT dividends are paid quarterly. The last dividend per share was 0.20 EUR. As of today, Dividend Yield (TTM)% is 0.91%. Tracking Walmart Inc. dividends might help you take more informed decisions.
Walmart Inc. dividend yield was 0.85% in 2024, and payout ratio reached 34.51%. The year before the numbers were 1.38% and 39.73% correspondingly. See high-dividend stocks and find more opportunities for your portfolio.
As of Sep 11, 2025, the company has 2.1 M employees. See our rating of the largest employees — is Walmart Inc. on this list?
EBITDA measures a company's operating performance, its growth signifies an improvement in the efficiency of a company. Walmart Inc. EBITDA is 37.21 B EUR, and current EBITDA margin is 6.21%. See more stats in Walmart Inc. financial statements.
Like other stocks, WMT shares are traded on stock exchanges, e.g. Nasdaq, Nyse, Euronext, and the easiest way to buy them is through an online stock broker. To do this, you need to open an account and follow a broker's procedures, then start trading. You can trade Walmart Inc. stock right from TradingView charts — choose your broker and connect to your account.
Investing in stocks requires a comprehensive research: you should carefully study all the available data, e.g. company's financials, related news, and its technical analysis. So Walmart Inc. technincal analysis shows the buy rating today, and its 1 week rating is strong buy. Since market conditions are prone to changes, it's worth looking a bit further into the future — according to the 1 month rating Walmart Inc. stock shows the buy signal. See more of Walmart Inc. technicals for a more comprehensive analysis.
If you're still not sure, try looking for inspiration in our curated watchlists.
If you're still not sure, try looking for inspiration in our curated watchlists.