FTSE 100 Index Closes at an All-Time HighFTSE 100 Index Closes at an All-Time High
Earlier, when analysing the chart of the UK’s FTSE 100 stock index, we outlined an ascending channel and anticipated a scenario with a continued upward trend and an attempt to establish a new historical high.
Since then:
→ The index has risen by almost 5
About FTSE 100 Index
The UK Financial Times Stock Exchange 100, more commonly known as the FTSE 100 or 'Footsie', is an index of share prices of the largest 100 companies listed on the London Stock Exchange (LSE) by market capitalization. The index was launched on January 3, 1984 at a base value of 1000, and the index level is calculated in real-time. The FTSE 100 represents approximately 81% of the entire market capitalization of the LSE, and even though it doesn't encompass the whole market, it is widely viewed as the best indicator of the heath of UK stocks. In recent years, however, given the uptick in international companies counted in the FTSE 100, this particular market index is no longer viewed as the best health indicator of the UK economy - that goes to the FTSE 250, which has a smaller proportion of multinationals among its constituents.

UK100 H4 | Bullish bounce off overlap supportUK100 is falling towards the buy entry, which is an overlap support that is slightly above the 127.2% Fibonacci extension and the 38.2% Fibonacci retracemen,t and could bounce from this level to the upside.
Buy entry is at 9,047.56, which is an overlap support that is slightly above the 127.2% Fibo

FTSE uptrend supported at 9114The FTSE remains in a bullish trend, with recent price action showing signs of a corrective pullback within the broader uptrend.
Support Zone: 9114 – a key level from previous consolidation. Price is currently testing or approaching this level.
A bullish rebound from 9114 would confirm ongoing ups

UK100 - potential head and shoulders on 1 hour chartWatching the UK100 for a potential short entry.
A head and shoulders pattern appears to be forming on the 1-hour chart. All my entry variables are currently met, but I’m holding off for now.
The UK100 will close in the next hour or two, and I prefer not to open a large position overnight due to po

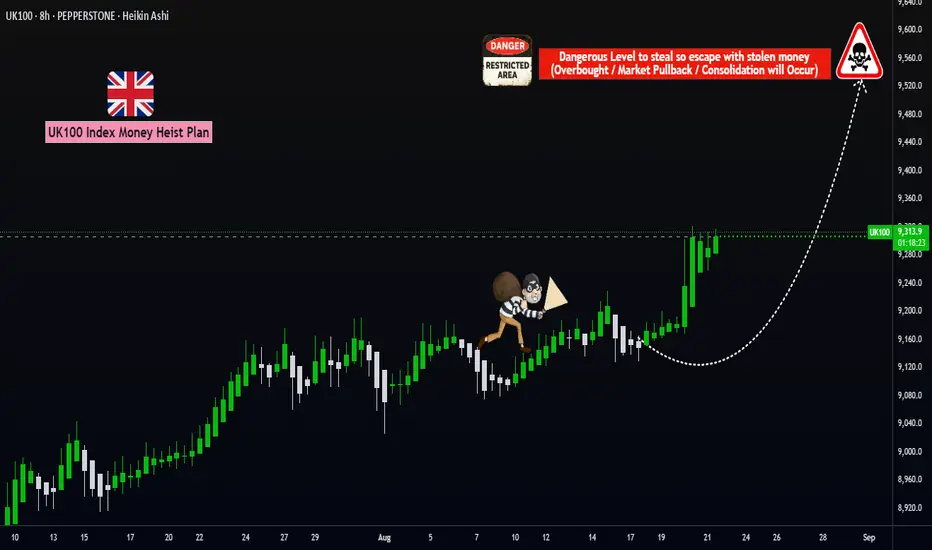
UK100 Bullish Heist: Ready to Loot the Upside?🎯 TRADE PLAN: UK100 BULLISH ROBBERY HEIST! 🎯
Asset: UK100 "FTSE 100 Index Cash" | Type: Indices CFD | Style: Swing & Scalping Larceny
Dearest Fellow Thieves & Money Bandits! 🤑💸🤵♂️👩💼
The vault doors to the UK100 are creaking open! Our intel confirms a BULLISH HEIST is in play. The big money is si
FTSE100 surges to records despite CPI surprise but can it last?The FTSE 100 has surged to a new all-time high, defying expectations after UK inflation surprised to the upside at 3.8%. This resilience can be attributed to renewed global interest in undervalued UK stocks, particularly defensives, as investors anticipate a potential end to the BOE’s easing cycle i

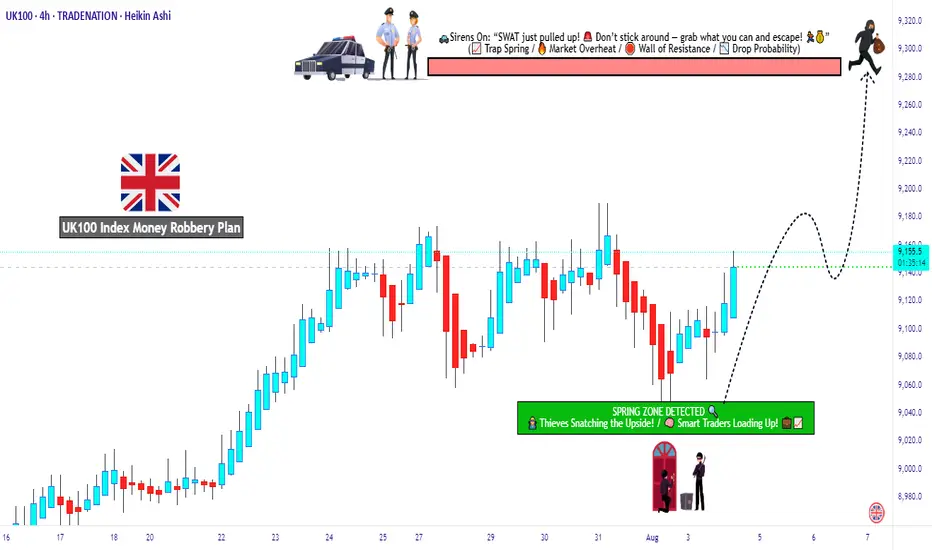
Is UK100 Setting Up the Cleanest Bull Robbery This Week?🏴☠️💹“UK100 Bullish Bank Job Heist 🧠💰” – Thief Trader Limit Order Operation 🚨📊
📢 Calling all stealthy traders, market pirates, and strategic looters! The vault is open, and the FTSE100 (UK100) index is now under our radar for a planned bullish extraction. This ain’t no regular trade — this is a Thie
FTSE poised to break to new highsThe stronger pound and weakness in crude oil prices have been among the reasons why we haven't seen a new high on the FTSE when US benchmark indices have hit new unchartered territories. But the underlying trend is bullish, and it looks like the UK index is coiling for a breakout, similar to that we

FTSE previous resistance retest? FTSE previous resistance retest?
The FTSE remains in a bullish trend, with recent price action showing signs of a corrective pullback within the broader uptrend.
Support Zone: 9114 – a key level from previous consolidation. Price is currently testing or approaching this level.
A bullish rebound

UK100 Will collapseAs we can see on this chart EIGHTCAP:UK100 is approaching a very critical area, as it stands, UK100 has put on a full garments of team Bearish. for more info, see the video. Sell UK100.

See all ideas
Displays a symbol's price movements over previous years to identify recurring trends.
Frequently Asked Questions
FTSE 100 Index reached its highest quote on Aug 15, 2025 — 9,231.1 GBP. See more data on the FTSE 100 Index chart.
The lowest ever quote of FTSE 100 Index is 4,791.8 GBP. It was reached on Mar 23, 2020. See more data on the FTSE 100 Index chart.
FTSE 100 Index is just a number that lets you track performance of the instruments comprising the index, so you can't invest in it directly. But you can buy FTSE 100 Index futures or funds or invest in its components.