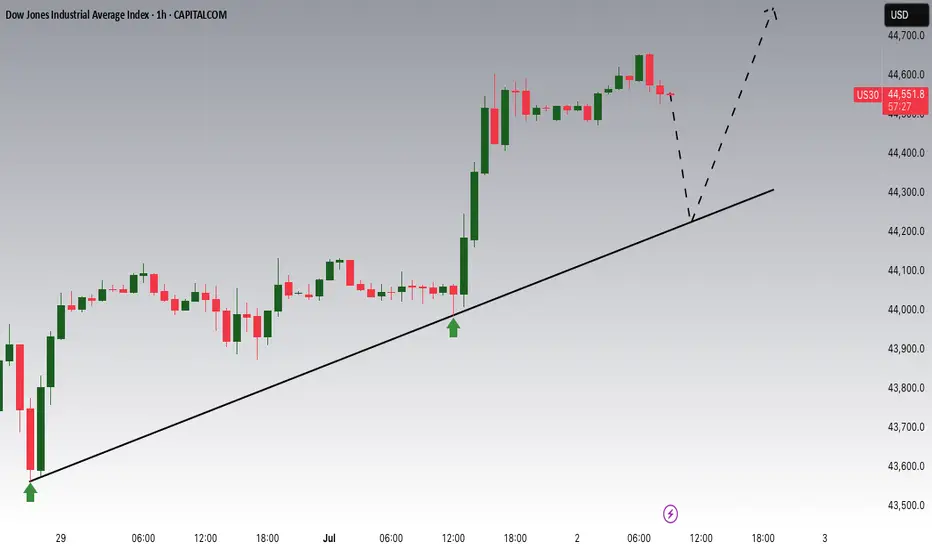
US30 Potential UpsidesHey Traders, in today's trading session we are monitoring US30 for a buying opportunity around 44,230 zone, Dow Jones is trading in an uptrend and currently is in a correction phase in which it is approaching the trend at 44,230 support and resistance area.
Trade safe, Joe.
Dow Jones -> A breakout rally of +40%!🐂Dow Jones ( TVC:DJI ) will create new highs:
🔎Analysis summary:
Since the April lows, the Dow Jones already rallied about +25%. This was simply the expected rejection away from a strong confluence of support. Now, the Dow Jones is sitting at the previous all time highs and about to break out

PCEs & attacks on PowellWe are carefully monitoring the PCEs today, to see, "wins" this small battle in the rate-lowering war. Let's dig in.
Let us know what you think in the comments below.
Thank you.
77.3% of retail investor accounts lose money when trading CFDs with this provider. You should consider whether you under

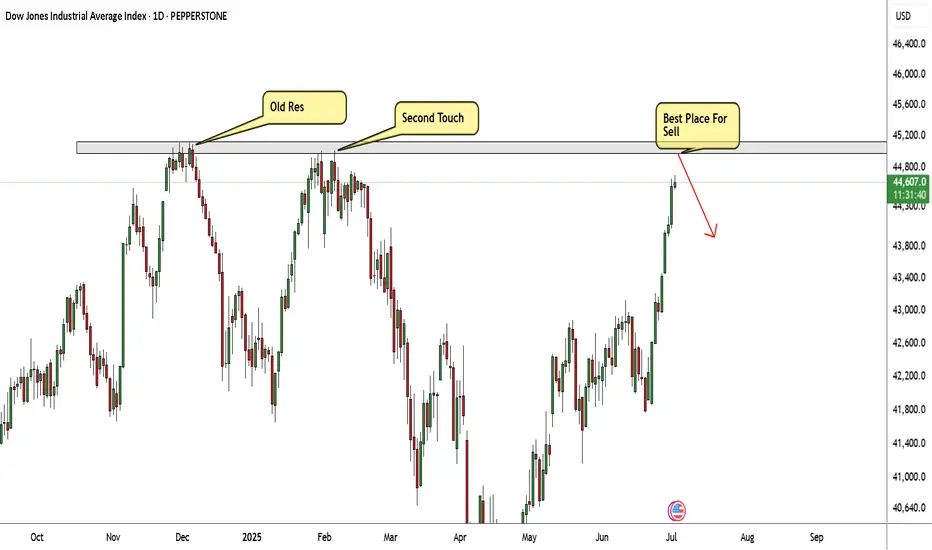
US30 Very Near Strong Res Area , Short Setup To Get 500 Pips !Here is my US30 Daily Chart , the price very near the highest price area , this res area forced the price to go down very hard 2 times so i think this time will be the biggest movement to downside , so i`m waiting the price to touch it and give me a good bearish price action and then we can enter a
US30 Awaits NFP – Bullish Above 44,410, Volatility Expected US30 (Dow Jones) – NFP Volatility in Focus
Today’s session is expected to be volatile due to the upcoming NFP report. Based on current forecasts, the outlook remains broadly positive for U.S. indices, though intraday swings are likely.
Technical Outlook:
As long as the price holds above 44,4

US30: The bullish trend remains in progressUS30: The bullish trend remains in progress
On April 7, 2025, US30 hit its lowest point at approximately 36500. Since then, despite significant concerns regarding Trump's tariffs and the ongoing turmoil in the Middle East, all indices have been on the rise.
Overall the U.S. indicators are showing

US30: Will Go Up! Long!
My dear friends,
Today we will analyse US30 together☺️
The market is at an inflection zone and price has now reached an area around 44,585.50 where previous reversals or breakouts have occurred.And a price reaction that we are seeing on multiple timeframes here could signal the next move up so

Us30 (buy)a perfectly formed head and shoulders, neckline broken,all indications shows us30 is on bull run to 45,00-46,00 wont be surprised if it makes a new ath
Wait for pullbacks and enjoy the run

DOW JONES INDEX (US30): Consolidation is Over
Dow Jones Index completed a bullish accumulation on a daily.
The price violated a key horizontal resistance cluster and closed above that.
Next goal for bulls is 43790.
❤️Please, support my work with like, thank you!❤️
I am part of Trade Nation's Influencer program and receive a monthly fee

DOW JONES: Final phase of bullish wave has started.Dow is practically overbought on its 1D technical outlook (RSI = 69.306, MACD = 518.450, ADX = 36.217) but that should little affect the heavily bullish price action on the long term. The reason is that after the April bounce on the 1W MA200, Dow entered the final phase of the Bull Cycle that starte

See all ideas
Displays a symbol's price movements over previous years to identify recurring trends.
Frequently Asked Questions
Dow Jones 30 Index (DJI) reached its highest quote on Dec 4, 2024 — 45,150.8 USD. See more data on the Dow Jones 30 Index (DJI) chart.
The lowest ever quote of Dow Jones 30 Index (DJI) is 15,193.0 USD. It was reached on Aug 24, 2015. See more data on the Dow Jones 30 Index (DJI) chart.
Dow Jones 30 Index (DJI) is just a number that lets you track performance of the instruments comprising the index, so you can't invest in it directly. But you can buy Dow Jones 30 Index (DJI) futures or funds or invest in its components.