Dow Jones: Potential Explosive Move!Hey Traders,
In today's trading session we are monitoring US30 (Dow Jones) for a buying opportunity around the 48,400 zone. The index is trading in a strong uptrend and is currently in a correction phase, approaching the trend area at 48,400 support and resistance.
Trade safe,
Joe.

US30: Another Attempt to Rise AgainUS30: Another Attempt to Rise Again
US30 broke out of a triangle pattern indicating a rise in the bullish momentum.
If price continues to respect this small pattern, US30 should rise more today with targets at 48000 and 48123.
It may work better with call options as this limits the risk in a b

Dow Jones is approaching an important support! Hey Traders, in today's trading session we are monitoring US30 for a buying opportunity around 47,350 zone, Dow Jones is trading in an uptrend and currently is in a correction phase in which it is approaching the trend at 43.350 support and resistance area.
Trade safe, Joe.

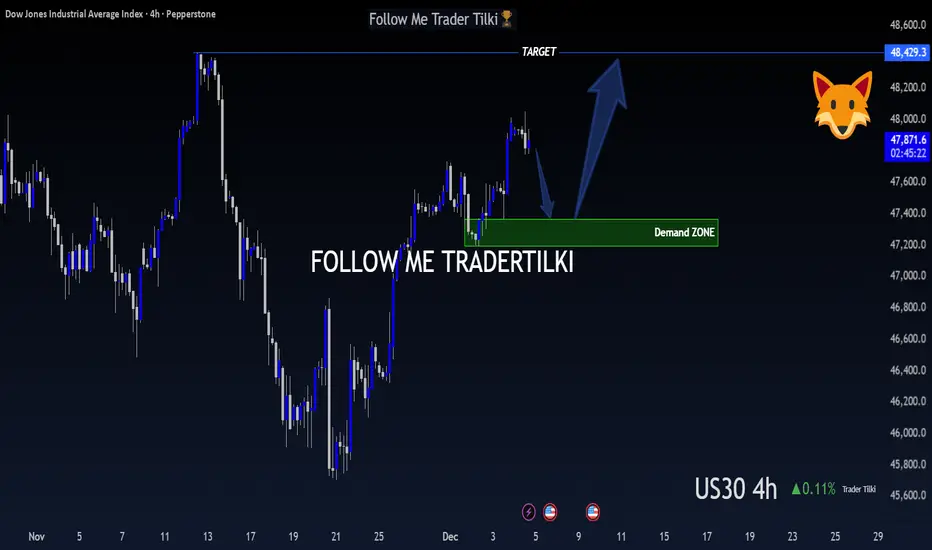
US30 (DOW JONES) – 4-Hour Timeframe Tradertilki AnalysisMy friends,
I have analyzed US30 on the 4-hour timeframe.
My friends, if US30 reaches the levels between 47,361 and 47,192, I will open a buy position.
My target will be the 48,429 level.
My friends, I share these analyses thanks to each like I receive from you.
Your likes increase my motivation
Dow Jones Faces Potential Downside Correction“The Dow Jones may start a bearish correction from the current price range toward 47,423. The level at 48,916.77 is critical.” CMCMARKETS:US30

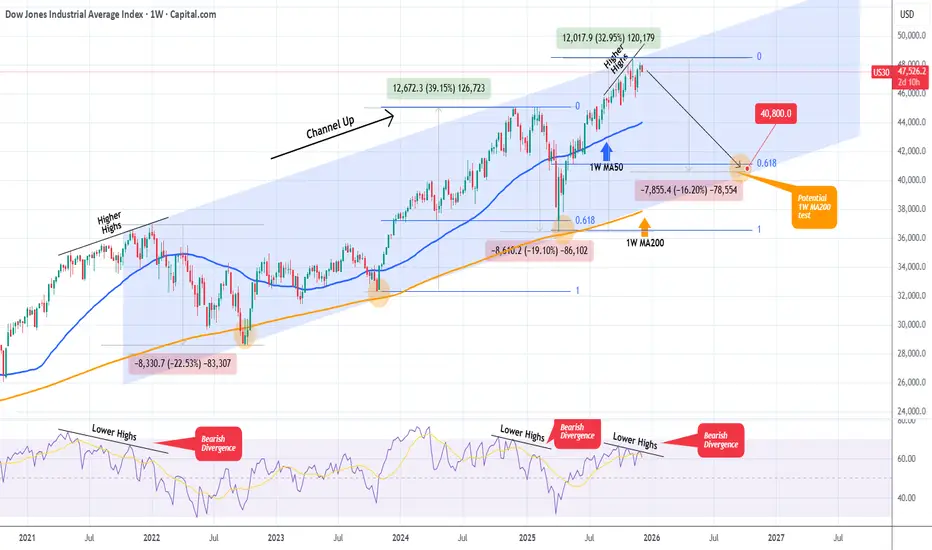
DOW JONES Is it starting a new Bear Cycle towards 40800?Dow Jones (DJI) has been trading within a 4-year Channel Up since the start of the 2022 Inflation Crisis. One month ago it hit the top of this pattern and hasn't made a new High since.
This is increasingly alarming as the 1W RSI is on a Bearish Divergence under Lower Highs against the market's High
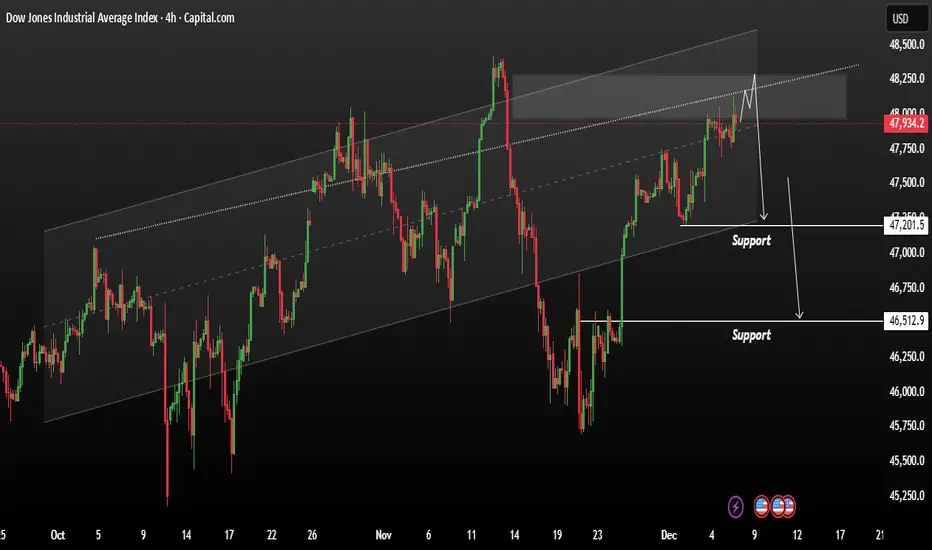
US30 Consolidation bearish range shift to support sideUS30 Consolidation bearish range action within a clearly defined ascending channel. The price has recently approached the upper boundary of this channel, where it appears to be facing resistance.
A projected path is drawn suggesting a potential short-term rejection from the upper channel line, with
Bullish bounce off 61.8% Fibonacci support?Dow Jones (US30) is falling towards the pivot which has been identified as an overlap support that aligns with the 61.8% Fibonacci retracement and could bouince to the 1st resistance.
Pivot: 47,747.64
1st Support: 47,356.23
1st Resistance: 48,113.30
Disclaimer:
The opinions given above constitu

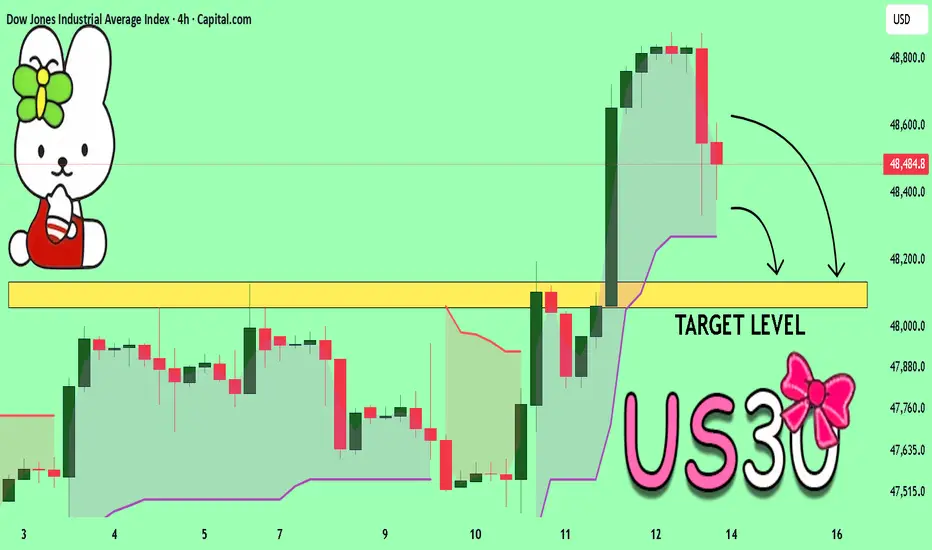
US30 A Fall Expected! SELL!
My dear followers,
I analysed this chart on US30 and concluded the following:
The market is trading on 48484 pivot level.
Bias - Bearish
Technical Indicators: Both Super Trend & Pivot HL indicate a highly probable Bearish continuation.
Target - 48132
About Used Indicators:
A super-trend indi
US30 | Correctional Zone US30 – Technical Overview
US30 recorded a new all-time high near 48,870 last week, ahead of the FOMC.
For the current week, the index is showing signs of a correctional movement, with downside potential toward 48,410 and 48,080 before attempting another bullish push.
However, if the market closes

See all ideas
Displays a symbol's value movements over previous years to identify recurring trends.
Frequently Asked Questions
Dow Jones Industrial Average Index reached its highest quote on Dec 12, 2025 — 48,960.92 USD. See more data on the Dow Jones Industrial Average Index chart.
The lowest ever quote of Dow Jones Industrial Average Index is 6,469.95 USD. It was reached on May 31, 2007. See more data on the Dow Jones Industrial Average Index chart.
Dow Jones Industrial Average Index is just a number that lets you track performance of the instruments comprising the index, so you can't invest in it directly. But you can buy Dow Jones Industrial Average Index futures or funds or invest in its components.