GALA/USDT - BullishGALA/USDT - Bullish - To 0.019$
Holding above this support increases the chance of a bullish reversal.
⚠️ Break below 0.0148 would cancel the bullish scenario.
Trade ideas

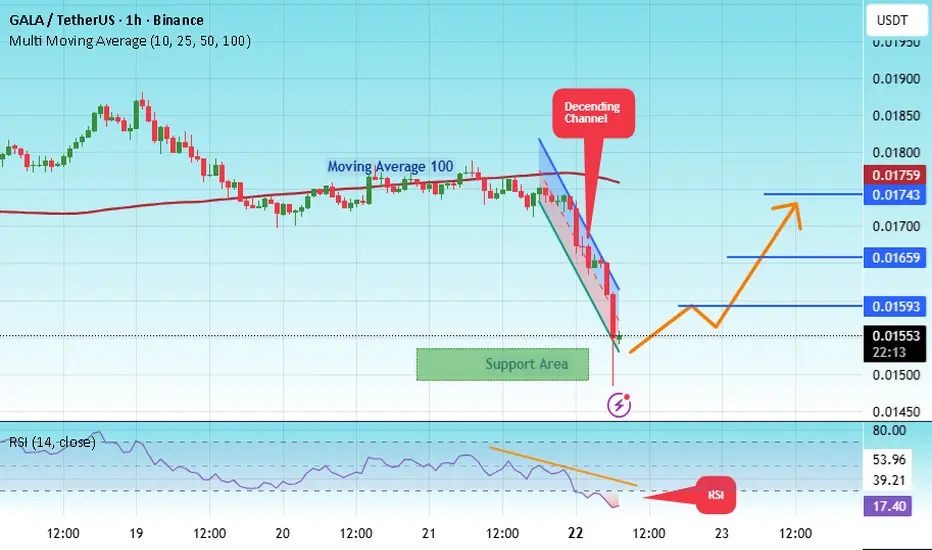
#GALA/USDT – History Repeats? Another Bounce from Key Support #GALA
The price is moving within a descending channel on the 1-hour frame, adhering well to it, and heading for a strong breakout and retest.
We have a bearish trend on the RSI indicator that is about to be broken and retested, which supports the upward breakout.
There is a major support area in green at 0.015100, which represents a strong support point.
We are heading for consolidation above the 100 moving average.
Entry price: 0.01500
First target: 0.01593
Second target: 0.01660
Third target: 0.01743
Don't forget a simple matter: capital management.
When you reach the first target, save some money and then change your stop-loss order to an entry order.
For inquiries, please leave a comment.
Thank you.
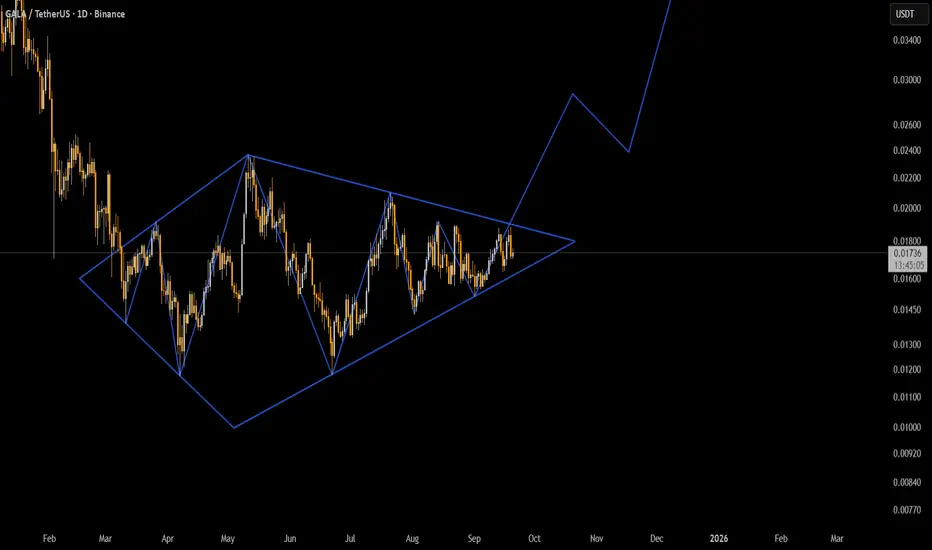
GALAUSDT is forming a Diamond Pattern BottomGala has been consolidating for a while and is nearly ready to start trending up.

GALA tradeGala both long and short trade that I am in , do your own research , the trend is neutral here

#GALA/USDT#GALA
The price is moving within a descending channel on the 1-hour frame and is expected to break and continue upward.
We have a trend to stabilize above the 100 moving average once again.
We have a downtrend on the RSI indicator that supports the upward break.
We have a support area at the lower boundary of the channel at 0.01520, acting as strong support from which the price can rebound.
We have a major support area in green that pushed the price upward at 0.01570.
Entry price: 0.01648.
First target: 0.01714.
Second target: 0.01796.
Third target: 0.01894.
To manage risk, don't forget stop loss and capital management.
When you reach the first target, save some profits and then change the stop order to an entry order.
For inquiries, please comment.
Thank you.

GALA. USDTGala has made more than 100% profit every time it exits the channel.
So
I think this cryptocurrency is worth buying on any price correction.
Let’s not forget that Gala is an American currency and the dominance of altcoins has reached its highest point this year.
While Gala is less than two cents.
What do you think?

GALA Ready for 110% Up Move GALA is moving inside Triangle pattern in Weekly , it is at support now , when it came to support it will bounce very strong after a pattern breakout at support .
and at the same time Bitcoin dominance is decreasing and altcoins dominance is started increasing , so look on all the altcoins
and follow proper risk management , it has very good chances to move UP side but first we have to protect the down side , where risk management comes into game .

GALA 8H – Rejected at Trendline, Eyes on Liquidity Below?GALA has faced repeated rejections at its descending trendline, with the latest wick again failing to break out. Price now sits back under both the 50 EMA ($0.01645) and 200 EMA ($0.01662), showing short-term weakness.
Downside levels to watch:
Blue support box around $0.0158–0.0160.
Liquidity pools at $0.01429 and $0.01350.
Upside invalidation:
A close above the descending trendline would break the rejection pattern and flip bias toward $0.018+.
Stoch RSI remains overbought, adding confluence for a possible pullback.
📊 Key focus: Will GALA break down toward liquidity at $0.0143, or finally break through trendline resistance for relief upside?


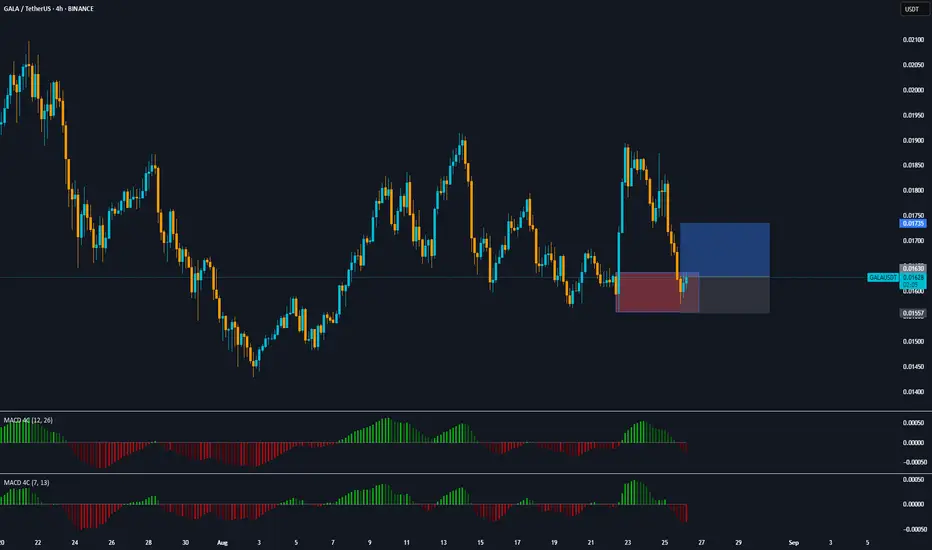
GALA/USDT – 4H Chart Analysis
Bearish Harmonic Pattern
Price completed a Bearish Gartley formation at point D (0.01733–0.01756 zone).
This level aligns with a strong supply zone (gray area) where sellers historically stepped in.
📊 Technical Signals
. Stochastic RSI: Currently in the overbought zone, showing potential weakness.
. Liquidity Zones: Multiple sell-side liquidity pools exist below current price, increasing downside probability.
. Rejection Wicks: Candles show early selling pressure at resistance.
🔑 Key Levels
. Resistance (Short Entry Zone): 0.01733 – 0.01756
. First Support: 0.01550
. Deeper Support / Target: 0.01360
🎯 Trading Idea (Not Financial Advice)
Bias: Bearish rejection likely from 0.0180 zone.
Potential Targets:
. TP1: 0.01550
. TP2: 0.01360
Stop Loss: Above 0.01818
⚠ Disclaimer: This is market analysis for educational purposes only, not financial advice. Always manage your risk.

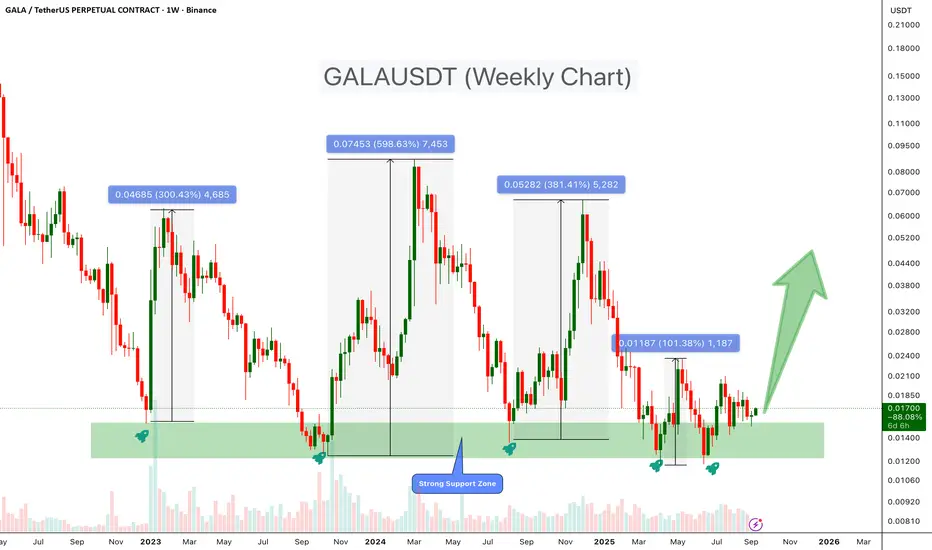
GALAUSDT – History Repeats? Another Bounce from Key Support ZoneGALA is once again testing its long-term support zone, which has historically acted as a strong base for major rallies. Every time the price touched this level in the past, it triggered significant upward moves ranging from +250% to +550%.
- Support Zone: Price is currently sitting in a key weekly support zone, where previous rallies originated.
Historical Bounces:
+300% rally in late 2022
+590% rally in early 2024
+381% rally in mid-2024
+101% rally earlier in 2025
Current Setup: Price has returned to this zone again, with potential for another bounce targeting ~200% -400% upside if history repeats.
Cheers
Hexa
GALA/USDT to $0.01360GALA/USDT – 4H Chart Analysis
The price is forming a rising wedge pattern, typically a bearish continuation signal.
The wedge is aligned with the ascending trendline, and a breakdown is highly probable.
Liquidity below and the untested demand zone suggest a downward move.
- Target: $0.01360
• This is a technical analysis perspective, not financial advice.

GALA/USDT – 1H Chart / Bearish Rising Wedge.
• Price is currently forming a Bearish Rising Wedge.
• The move has just rejected from the EMA200 (strong dynamic resistance).
• If the wedge breaks to the downside, bearish momentum could accelerate.
🎯 Targets:
• First support zone: 0.0158
• Main liquidity zone: 0.0145
⚠ This is not financial advice.

GALA. USDTGala is an American cryptocurrency based on Ethereum (ERC-20).
The limited number of Gala tokens is another factor that can contribute to the growth of Gala, and Gala dynamics have proven this many times.
But, the best strategy is to buy gradually.

GALA 2H – Demand Zone Retest in PlayGALA is consolidating between a defined demand zone at 0.0157–0.0160 and resistance around 0.0190. Price is currently leaning on demand, with liquidity sitting just beneath at 0.01570.
Bullish case: Holding demand could trigger a bounce toward resistance at 0.0190.
Bearish case: A sweep of liquidity at 0.01570 would invalidate the demand zone, opening risk for deeper downside.
Until one side breaks, the chart is framed between demand support and overhead resistance, with liquidity likely to guide the next move.

GALA/USDT – Monthly Outlook
After forming a Quadruple Bottom around the 0.0117$ support, GALA shows strong accumulation signs.
A confirmed breakout above the 0.018 – 0.020$ zone could trigger the next bullish leg.
Mid-term target (December 2025): 0.09099$
Long-term target (April 2026): 0.40872$
🚀 Catalyst: A strategic cooperation between GALA, China, TCC & Shrapnel is expected to begin in Q1 2026.
This partnership focuses on blockchain gaming and market expansion in China, which could become a major driver for adoption and global exposure of GALA.
Key resistance zones are marked by FVG (Fair Value Gaps) which price must reclaim to sustain momentum.
With BTC dominance showing strength and market sentiment improving, the probability of a macro trend reversal increases.
📌 This analysis represents my personal market outlook, not financial advice.

GALA/USDT — 4H Trend UpdateGALA/USDT — 4H Trend Update
Context
Price is testing 4H MA200 \~0.0165 and the demand zone 0.01690–0.01640.
RSI 4H is rising toward 50; a break >50 would confirm momentum shift.
Overhead supply: 0.01710–0.01730 (DMAs) and 0.01770–0.01790 (golden pocket).
Key Levels
Supports: 0.01690 • 0.01640 • 0.01600–0.01580 • 0.01560
Resistances: 0.01710–0.01730 • 0.01770–0.01790 • 0.01829 • 0.01848 • 0.01901
Short term (24–72h)
Bull case: 4H/1H close > 0.01730 + RSI>50 ⇒ targets 0.01770–0.01790 → 0.01829 → 0.01848.
Invalidation: swift drop back < 0.01690.
Bear case: rejection at 0.01710–0.01730 and 4H close < 0.01640 ⇒ move to 0.01600–0.01580, with “flush” risk to 0.01560.
Negation: reclaim 0.01710.
Mid term (1–3 weeks)
Bullish: acceptance > 0.01790 (GP) ⇒ test 0.01901; breakout opens 0.0194–0.0198 (1.272–1.414).
Bearish: daily closes < 0.01600 ⇒ range/downside toward 0.01560, possibly 0.0150–0.0143.
Candlestick signals to watch
Hammer/engulfing in 0.01640–0.01660 or SFP of the low (<0.0160 wick, close > 0.01640) = bounce trigger.
SFP at 0.01848–0.01901 = take-profit zone.

GALAUSDT LONG POSITIONOn the 4-hour time frame, a suitable buying position has been created based on a demand range and hidden divergence in the MACD, and a 10% growth can be expected for the first target.
#GALA/USDT Sustain the Current Bullish Momentum !#GALA
The price is moving within an ascending channel on the 1-hour frame, adhering well to it, and is poised to break it strongly upwards and retest it.
We have support from the lower boundary of the ascending channel, at 0.01580.
We have a downtrend on the RSI indicator that is about to break and retest, supporting the upward move.
There is a key support area (in green) at 0.01600, which represents a strong basis for the upward move.
Don't forget one simple thing: ease and capital.
When you reach the first target, save some money and then change your stop-loss order to an entry order.
For inquiries, please leave a comment.
We have a trend of stability above the Moving Average 100.
Entry price: 0.01620
First target: 0.01687
Second target: 0.01791
Third target: 0.01907
Don't forget one simple thing: ease and capital.
When you reach the first target, save some money and then change your stop-loss order to an entry order.
For inquiries, please leave a comment.
Thank you.

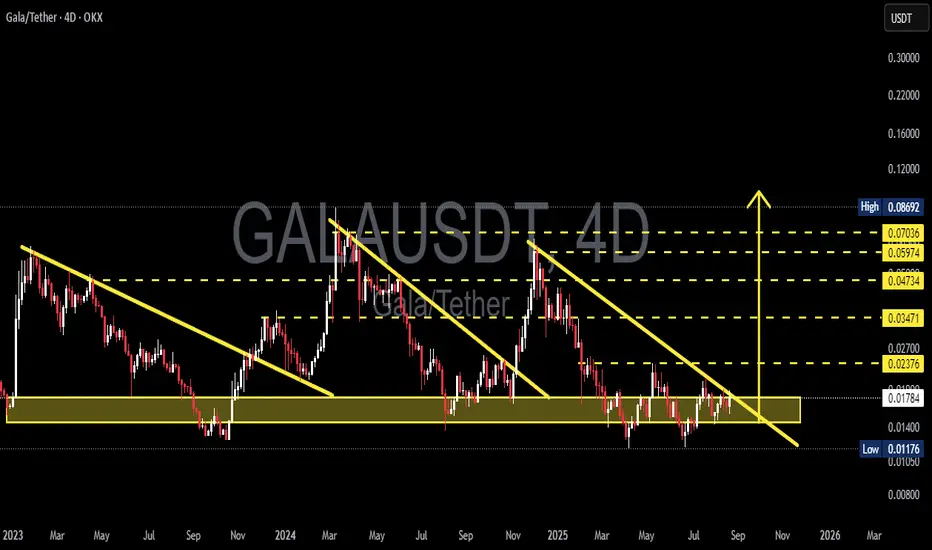
GALA/USDT — Approaching Decision Zone: Breakout or Breakdown?📊 Chart Overview (4D Timeframe)
GALA price is currently trading within the multi-year accumulation zone (0.012 – 0.018 USDT) that has held since 2023. This area represents a major battleground between buyers (accumulation) and sellers (distribution).
The chart reveals a recurring descending resistance line (falling wedge structure) that has historically led to strong rallies whenever broken. Price is now pressing against the apex where the long-term support zone meets the descending trendline — a decisive move is imminent.
---
🔎 Technical Structure & Pattern
Accumulation Zone (0.012 – 0.018):
Strong multi-year support where buyers have consistently absorbed selling pressure.
Descending Trendline:
Connecting lower highs since 2023; acts as the “ceiling” for price. A breakout often triggers rapid upside.
Repetitive Falling Wedges:
At least 3 major falling wedges since 2023; each breakout → triggered a rally.
Key Resistances Ahead:
0.0237 → 0.0347 → 0.0473 → 0.0597 → 0.0703.
Range Extremes:
Major High: 0.0869 USDT
Major Low: 0.0117 USDT
---
✅ Bullish Scenario
1. Confirmation: 4D/daily close above descending trendline + reclaim 0.0237 USDT.
2. Short-term targets: 0.0347 → 0.0473.
3. Mid-term targets: 0.0597 – 0.0703 (major resistance cluster).
4. Potential rally: Based on past wedge breakouts, a +100% upside in weeks is not impossible.
📌 Key factor: Breakout must come with strong volume + successful retest.
---
❌ Bearish Scenario
1. Confirmation: Failure to break trendline + 4D close below 0.0117 USDT.
2. Downside targets: 0.010 → 0.008 zone.
3. Risk: Losing this multi-year accumulation would shift GALA into a deeper distribution phase.
📌 Caution: Beware of false breakdowns leading to short squeezes.
---
🎯 Conclusion
GALA is sitting at a make-or-break level:
🔼 Breakout → opens path to a strong rally.
🔽 Breakdown → risk of revisiting lower structural zones.
The falling wedge repetition increases the odds of a bullish breakout if confirmed.
0.0237 USDT remains the “gateway” to trend reversal.
---
⚡ Trader Notes
Avoid FOMO — wait for clear confirmation.
Always use risk management & proper position sizing.
Watch BTC and broader altcoin sentiment, as GALA’s move will likely follow macro market conditions.
#GALA #GALAUSDT #CryptoAnalysis #Altcoins #Breakout #SupportResistance #Accumulation #TechnicalAnalysis #SwingTrading #CryptoMarket
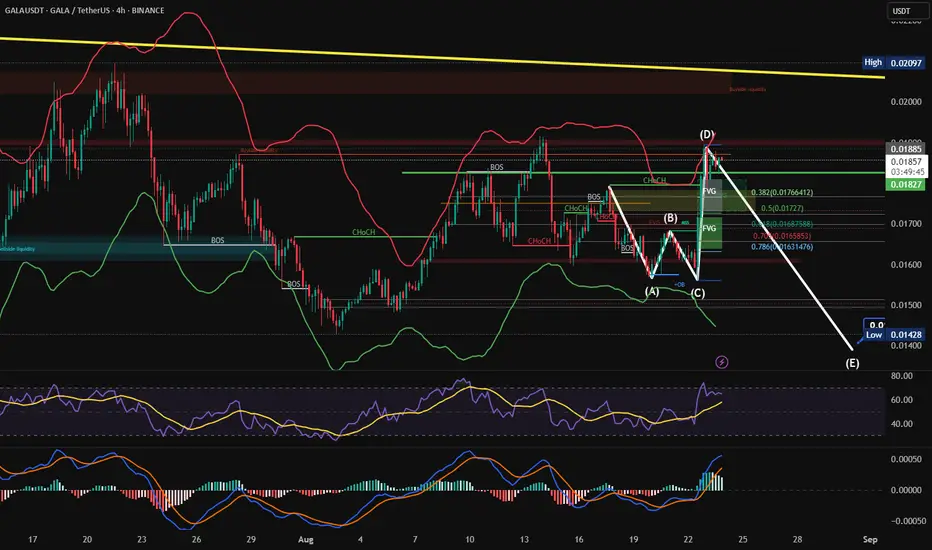
GALA/USDT (4H Analysis)GALA/USDT (4H Analysis)
The chart illustrates a detailed Elliott Wave structure forming within the 4H timeframe. Price action recently completed a corrective move (A → B → C) and extended into point (D) before showing potential signs of reversal.
Resistance Zones:
Price is testing strong supply around 0.0188 – 0.0192, aligned with Fibonacci retracement levels and previous liquidity zones.
Support & Downside Targets:
If rejection holds, the market may follow the projected (D → E) leg down toward 0.0145 – 0.0140, completing the corrective cycle.
Indicators:
RSI is approaching overbought conditions, hinting at possible bearish divergence.
MACD shows strong momentum, but a cross-down could confirm reversal.
Bollinger Bands suggest price touched the upper band and may revert inward.
Key Levels to Watch:
Resistance: 0.01885 / 0.02000
Mid Support: 0.0172 – 0.0165 (Fib 0.5–0.786)
Strong Support: 0.0145 – 0.0140
⚠️ Outlook: The short-term bias remains corrective bearish unless price breaks and consolidates above 0.0200, which could invalidate the (E) target and open the way for a bullish continuation.
GALA.USDTEvery price correction in Gala is a buying opportunity.
So, we can wait for the channel's upper limit of $0.02 to be reached.
But if the price can confidently overcome $0.02, a 200% increase is guaranteed.
