GBPAUD → The correction is nearing completion...FX:GBPAUD is set to end the correction formed within the global bullish trend. A false breakdown of the liquidity zone is forming...
GBPAUD on D1 is testing a strong support zone, which gives traders hope for a possible recovery. Locally, the chart shows signs of the correction ending...
After correcting to 1/2 of the range, GBPAUD is forming a false breakdown of the order block and breaking the bearish structure, confirming the end of the correction. Consolidation above 2.076 could trigger a recovery within the bullish trend.
Resistance levels: 2.086, 2.0978
Support levels: 2.076, 2.0715
Despite breaking through the resistance of the local correction, the market must confirm the bullish sentiment. Consolidation of the price above 2.076 will confirm this nuance, and consolidation above the key support may influence further growth.
Best regards, R. Linda!
GBPAUD trade ideas

GBP-AUD Long From Support! Buy!
Hello,Traders!
GBP-AUD made a retest
Of the horizontal support
Level of 2.0740 and we
Are already seeing a local
Bullish rebound so we will
Be expecting a further
Bullish move up
Buy!
Comment and subscribe to help us grow!
Check out other forecasts below too!
Disclosure: I am part of Trade Nation's Influencer program and receive a monthly fee for using their TradingView charts in my analysis.

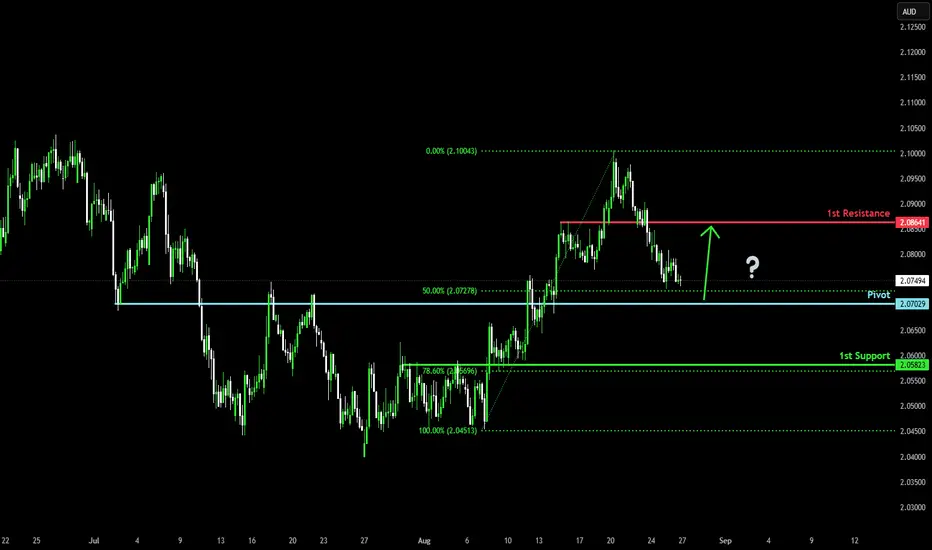
Falling towards major support?GBP/AUD is falling towards the pivot which has been identified as an overlap support and could bounce to the 1st resistance.
Pivot: 2.0702
1st Support: 2.0582
1st Resistance: 2.0864
Risk Warning:
Trading Forex and CFDs carries a high level of risk to your capital and you should only trade with money you can afford to lose. Trading Forex and CFDs may not be suitable for all investors, so please ensure that you fully understand the risks involved and seek independent advice if necessary.
Disclaimer:
The above opinions given constitute general market commentary, and do not constitute the opinion or advice of IC Markets or any form of personal or investment advice.
Any opinions, news, research, analyses, prices, other information, or links to third-party sites contained on this website are provided on an "as-is" basis, are intended only to be informative, is not an advice nor a recommendation, nor research, or a record of our trading prices, or an offer of, or solicitation for a transaction in any financial instrument and thus should not be treated as such. The information provided does not involve any specific investment objectives, financial situation and needs of any specific person who may receive it. Please be aware, that past performance is not a reliable indicator of future performance and/or results. Past Performance or Forward-looking scenarios based upon the reasonable beliefs of the third-party provider are not a guarantee of future performance. Actual results may differ materially from those anticipated in forward-looking or past performance statements. IC Markets makes no representation or warranty and assumes no liability as to the accuracy or completeness of the information provided, nor any loss arising from any investment based on a recommendation, forecast or any information supplied by any third-party.
GBP/AUD: Fiscal doubts and fading momentum tilt risks lowerChinese reflation hopes have combined with renewed concerns over the U.K. fiscal trajectory to generate an interesting short setup from a purely fundamental perspective in GBP/AUD. The technicals are also supportive given where the pair sits on the charts.
If GBP/AUD breaks support at 2.0750 and holds there, shorts could be established with a stop above the level for protection. The 50-day moving average provides an early hurdle, so consider squaring the position if the price cannot meaningfully push beyond it. But if it can, 2.0600 or 2.0450 screen as appropriate trade targets.
Even though momentum indicators are neutral overall, it’s clear bullish momentum is weakening fast. The price action over the past week also makes for a compelling short case, with the tombstone doji of August 20 followed by a break of the August 7 uptrend and an extension of the bearish move down to 2.0750.
While there is second-tier economic data released in Australia on Wednesday in the form of the inflation indicator, the first month of the quarter tends to be dominated by goods prices, making the overall signal for RBA policymakers hard to trust when evaluating broader inflation trends. As such, it tends to have very limited market impact.
Good luck!
DS

GBPAUD POSSIBLE BUY SETUP ***RISK MANAGMENT*** **potential bullish setup**
* Price was in a **downtrend** (black descending trendline, red arrows showing lower highs).
* A **Break of Structure (BOS)** occurred, meaning the bearish trendline was broken → signaling possible trend reversal.
* Price is now in a **demand zone** (blue box), where buyers are expected to step in.
* The setup suggests a **long entry from the demand zone** with a target toward the **supply zone** above (red box near 2.09571).
* Stop-loss is just below the demand zone (\~2.07428).
**Idea:** Wait for confirmation in the blue zone → Buy → Target the upper resistance zone.

GBPAUD sell limit Nice rejection of 2.10 resistance, consolidating market ill look for a buy at support unless we see a break downwards.

GBP_AUD LONG FROM SUPPORT|
✅GBP_AUD is going down now
But a strong support level is ahead at 2.0750
Thus I am expecting a rebound
And a move up towards the target of 2.0785
LONG🚀
✅Like and subscribe to never miss a new idea!✅

GBP/AUD – Falling Wedge Buy SetupOn the 4H timeframe, price is forming a falling wedge pattern, which is a bullish reversal signal.
I’m looking at two potential long entries:
1️⃣ Aggressive Entry – Buying near the current lows of the wedge (around 2.0780), anticipating a reversal from wedge support.
2️⃣ Conservative Entry – Waiting for a confirmed breakout above wedge resistance for more confirmation before entering.
🎯 Targets:
TP1: 0.382 Fib retracement – 2.0910
TP2: 0.5 Fib retracement – 2.0885
TP3: 0.618 Fib retracement – 2.0860
🛡 Stop Loss: Just below recent swing low / wedge support (~2.0780 for breakout entry, slightly lower for aggressive entry).
📊 RSI is showing early signs of bullish divergence, which may support a reversal.
Bias: Bullish – expecting a breakout to the upside after wedge completion.
Risk Management: Position sizing based on SL distance; risking a small % of account per trade.

GBPAUD bearish rejection at 2.0870 resistanceThe GBPAUD pair is currently trading with a bearish bias, aligned with the broader downward trend. Recent price action shows a retest of the falling resistance, suggesting a temporary relief rally within the downtrend.
Key resistance is located at 2.0870, a prior consolidation zone. This level will be critical in determining the next directional move.
A bearish rejection from 2.0870 could confirm the resumption of the downtrend, targeting the next support levels at 2.0660, followed by 2.0590 and 2.0540 over a longer timeframe.
Conversely, a decisive breakout and daily close above 2.0870 would invalidate the current bearish setup, shifting sentiment to bullish and potentially triggering a move towards 2.0930, then 2.0970.
Conclusion:
The short-term outlook remains bearish unless the pair breaks and holds above 2.0870. Traders should watch for price action signals around this key level to confirm direction. A rejection favours fresh downside continuation, while a breakout signals a potential trend reversal or deeper correction.
This communication is for informational purposes only and should not be viewed as any form of recommendation as to a particular course of action or as investment advice. It is not intended as an offer or solicitation for the purchase or sale of any financial instrument or as an official confirmation of any transaction. Opinions, estimates and assumptions expressed herein are made as of the date of this communication and are subject to change without notice. This communication has been prepared based upon information, including market prices, data and other information, believed to be reliable; however, Trade Nation does not warrant its completeness or accuracy. All market prices and market data contained in or attached to this communication are indicative and subject to change without notice.

GBPAUD bullish idea1. Key Support Level
Price is sitting right above a horizontal support zone (~2.0780), previously respected around August 16–19.
This level could act as a bounce zone or be vulnerable to a breakdown.
2. RSI Indicator
RSI is at 36.34, nearing oversold territory (30 level).
No clear bullish divergence yet, but the momentum is slowing, which may hint at a potential pause or bounce.

GBP/AUD Bull Power: Eyeing the Perfect Fib 0.382 Buy Entry!Analysis:
Currently observing GBP/AUD on the 1H timeframe. The pair is in a strong bullish trend, confirmed by consistent Higher Highs (HH) and Higher Lows (HL).
🔍 Technical Setup:
Trend: Bullish
Divergence: Bearish divergence spotted on momentum indicators – suggesting a short-term pullback.
Pattern: Trend Line support intact.
Harmonics: None detected.
Bias: Bullish
Fibonacci Play: Expecting price to retrace to Fib 0.382 to form a fresh HL before continuation.
Entry Plan: Buy Limit at 2.07388 with SL at 2.06399 and TP1 at 2.08377.
Risk/Reward: 1:1 (Risk $50, Reward $50 on 0.08 lots, 0.5% risk on $10K account).
📊 Currency Index Confirmation:
GBP Index is strongly bullish, indicating Pound strength.
AUD Index is strongly bearish, showing Aussie weakness.
This aligns perfectly with the bullish bias on GBP/AUD.
📰 Fundamental Drivers:
Recent UK economic data (e.g., better-than-expected GDP growth & positive services PMI) has strengthened GBP.
AUD weakness driven by falling commodity prices and cautious RBA policy tone.
Risk-off market sentiment has reduced demand for AUD as a commodity currency.
Trade Plan:
Buy Limit: 2.07388
SL: 2.06399
TP1: 2.08377
Lot Size: 0.08
Risk: 0.5% ($50)
Reward: 0.5% ($50)
💬 What’s your view on GBP/AUD? Do you see the same setup?
📍 Drop your analysis in the comments — let’s discuss!
❤️ Like if you find this useful, 🔄 share to help other traders, and ✅ follow me for more trade setups.
#GBPAUD #ForexSignals #PriceAction #SwingTrading #ForexStrategy #FibonacciTrading #ForexAnalysis #TradingSetup #CurrencyTrading #TechnicalAnalysis #BullishTrend #ForexCommunity #FXTrader #PriceActionTrading #TradeSetup #ForexCharts #MarketAnalysis #ForexLife #TrendTrading #TraderLife #ForexEducation #GBPIndex #AUDIndex

GBP/AUD Bullish Flag with Strong Fundamentals | Buy Stop SetupI’m closely monitoring GBPAUD on the 1H timeframe. The pair has been in a strong bullish trend and is now forming a bullish flag pattern after the recent double top.
The previous bearish divergence has been completely diluted, and indicators are aligning for further upside momentum:
✅ EMA confirms bullish strength
✅ MACD (12,16) is flashing a buy signal
✅ Moving Averages point to continued upside
✅ TradingView Heatmap shows +0.18%, reinforcing bullish bias
Fundamentals Supporting GBP/AUD Bullish Bias
GBP Currency Index → Bullish ✅ showing consistent strength.
AUD Currency Index → Bearish ❌ confirming AUD weakness.
GBP Strength: UK inflation remains sticky above BoE’s 2% target, keeping the Bank of England on a hawkish path. Recent UK wage growth data also supports potential tightening bias.
AUD Weakness: The RBA has signaled a more dovish stance, with markets pricing limited room for further hikes. Falling commodity prices (iron ore, coal) weigh further on AUD.
Risk Sentiment: A stronger USD environment and global risk-off sentiment are adding pressure to commodity currencies, including AUD.
Yield Differential: UK’s higher bond yields compared to Australia support capital inflows into GBP.
👉 Both technical breakout + fundamental divergence (GBP strong / AUD weak) point to a bullish continuation.
📝 Trading Plan:
I’ll wait for a clean breakout of the last Higher High (HH) before entering, to avoid false signals. This way, if the market confirms the bullish continuation, our trade executes; if not, no loss occurs.
📌 Trade SetupPair: GBP/AUD – TF: 1H
Trend: Bullish
Pattern: Bullish Flag after Double Top
Bias: Bullish
📌 Entry (EP): Buy Stop @ 2.08683
📌 Stop Loss (SL): 2.07737
📌 Take Profit (TP1): 2.09629
💰 Lot Size: 0.16 (1% Risk on $10,000 A/c)
⚖️ Risk/Reward: 1:1
📉 Risk: $100 | 📈 Reward: $100
🔥 What do you think? Do you agree with this setup, or do you see another angle? Drop your views below 👇 — let’s discuss and learn together! Don’t forget to like, comment, follow, and share if you find this analysis valuable.
#GBPAUD #ForexTrading #PriceAction #TechnicalAnalysis #TradingView #ChartAnalysis #ForexSetup #SwingTrading #ForexSignals #BullishTrend #ForexMarket #ForexTrader #TradeSetup #BreakoutTrading #ForexStrategy #PriceActionTrading #ForexCommunity #ForexCharts #ForexTechnicalAnalysis #TradingSetups #DayTrading #MarketAnalysis #ForexEducation #TradeSmart #ForexLife #TrendTrading #CurrencyTrading #RiskManagement #BullishFlag #ForexAnalysis

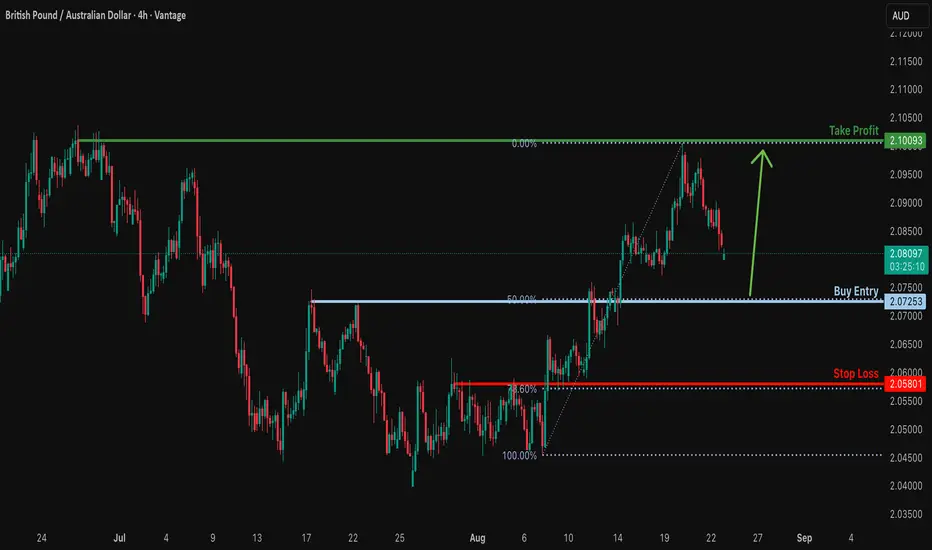
Falling towards 50% Fibonacci support?GBP/AUD is falling towards the support level, which is a pullback support that aligns with the 50% Fibonacci retracement and could bounce from this level to our take profit.
Entry: 2.0725
Why we like it:
There is a pullback support that aligns with the 50% Fibonacci retracement.
Stop loss: 2.0580
Why we like it:
There is an overlap support that lines up with the 78.6% Fibonacci retracement.
Take profit: 2.1009
Why we like it:
There is a multi-swing high resistance.
Enjoying your TradingView experience? Review us!
Please be advised that the information presented on TradingView is provided to Vantage (‘Vantage Global Limited’, ‘we’) by a third-party provider (‘Everest Fortune Group’). Please be reminded that you are solely responsible for the trading decisions on your account. There is a very high degree of risk involved in trading. Any information and/or content is intended entirely for research, educational and informational purposes only and does not constitute investment or consultation advice or investment strategy. The information is not tailored to the investment needs of any specific person and therefore does not involve a consideration of any of the investment objectives, financial situation or needs of any viewer that may receive it. Kindly also note that past performance is not a reliable indicator of future results. Actual results may differ materially from those anticipated in forward-looking or past performance statements. We assume no liability as to the accuracy or completeness of any of the information and/or content provided herein and the Company cannot be held responsible for any omission, mistake nor for any loss or damage including without limitation to any loss of profit which may arise from reliance on any information supplied by Everest Fortune Group.
GBPAUD Bearish Trend ContinuationDears,
This is my HTF 2RR trade idea for next week. I believe the chart is self-explanatory.
The price rejected a strong resistance after sweeping liquidity, and then the short-term uptrend has been broken, signaling a long-term downtrend continuation going forward.

22.08.25 Morning ForecastPairs on Watch -
FX:EURCAD
FX:GBPAUD
A short overview of the instruments I am looking at for today, multi-timeframe analysis down to what I will be looking at for an entry. Enjoy!


GBP/AUD SHORT FROM RESISTANCE
GBP/AUD SIGNAL
Trade Direction: short
Entry Level: 2.096
Target Level: 2.089
Stop Loss: 2.100
RISK PROFILE
Risk level: medium
Suggested risk: 1%
Timeframe: 1h
Disclosure: I am part of Trade Nation's Influencer program and receive a monthly fee for using their TradingView charts in my analysis.
✅LIKE AND COMMENT MY IDEAS✅

XABCD
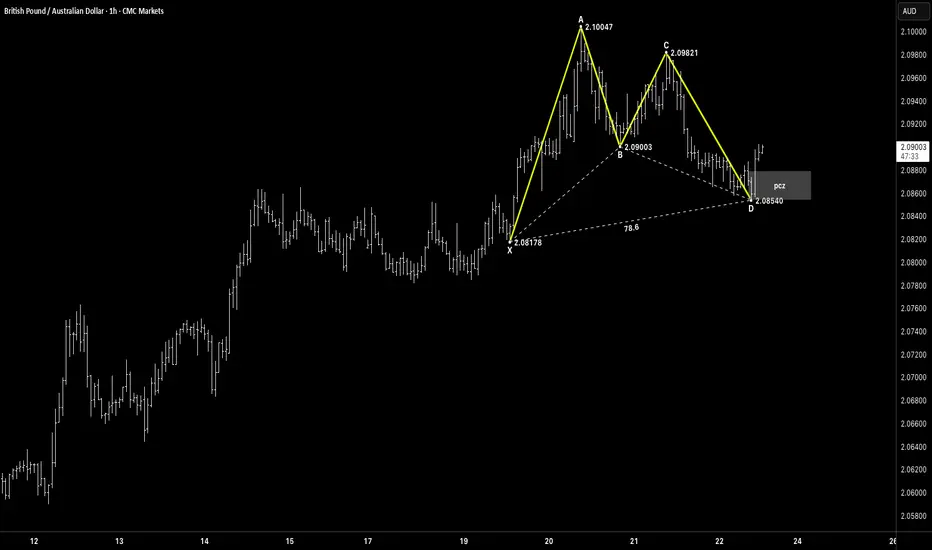
Hey awesome traders! Hope you’re enjoying a well-deserved holiday. Quick summer check-in: GBPAUD just completed a clean Bullish Gartley into the PRZ, and buyers are reacting at D—poolside or beach, plan it, execute it, manage the profit.
📌 Pattern Overview
Pattern: Gartley (Bullish)
Bias: Long from D/PCZ on confirmation and structure reclaim
🔑 Key Levels
X: 2.08178
A: 2.10047
B: 2.09003
C: 2.09821
D (PRZ): 2.08540
PCZ: 2.084 – 2.087 (XA 78.6% + AB=CD/BC 1.27–1.618 confluence)
📐 Confirmation Triggers
First reaction off D printed.
Stronger confirmation: reclaim/close above 2.0900 (B pivot).
Hold of higher-lows inside 2.084–2.087 keeps the setup valid.
⚡ Trade Plan
Plan A (confirmation entry):
Wait for close > 2.0900, buy the retest.
Targets: 2.10293 – 2.10707 (T1 zone).
Trail once price clears 2.100.
Plan B (PRZ fade, smaller size):
Scale in on basing/higher-lows 2.084–2.087.
Add on 2.0900 reclaim.
🛡 Risk Management
Invalidation (aggressive): clean close below 2.0854 (D).
Conservative invalidation: below 2.0818 (X).
Stops: under 2.084–2.085 (tight) or under 2.0815–2.0820 (structure).
Move stop to BE after ~1R; partials at T1.
🎯 Targets & Path
T1: 2.10293 – 2.10707 (≈ 78.6%–100% of AD).
If momentum persists after T1, look for continuation legs toward prior swing supply.

GBP-AUD Growth Ahead! Buy!
Hello,Traders!
GBP-AUD is trading in an
Uptrend and the pair is making
A local bearish correction
So after the retest of the
Horizontal support of 2.0860
We will be expecting a rebound
And a move up
Buy!
Comment and subscribe to help us grow!
Check out other forecasts below too!
Disclosure: I am part of Trade Nation's Influencer program and receive a monthly fee for using their TradingView charts in my analysis.


GBPAUD Counter-Trend Sell OffD1- Price approached Key resistance level tested multiple times at (2.10394 - 2.09663).
D1 - Price was rejected strongly at the level closing with shooting star.
H4 - Potential Double top forming waiting for bearish close to take the trade at (2.10056 - 2.09839).

GBPAUD potential road mapGBPAUD. could be continuation triangle in final stage of minor abc: c leg up to trend line down sloping.
