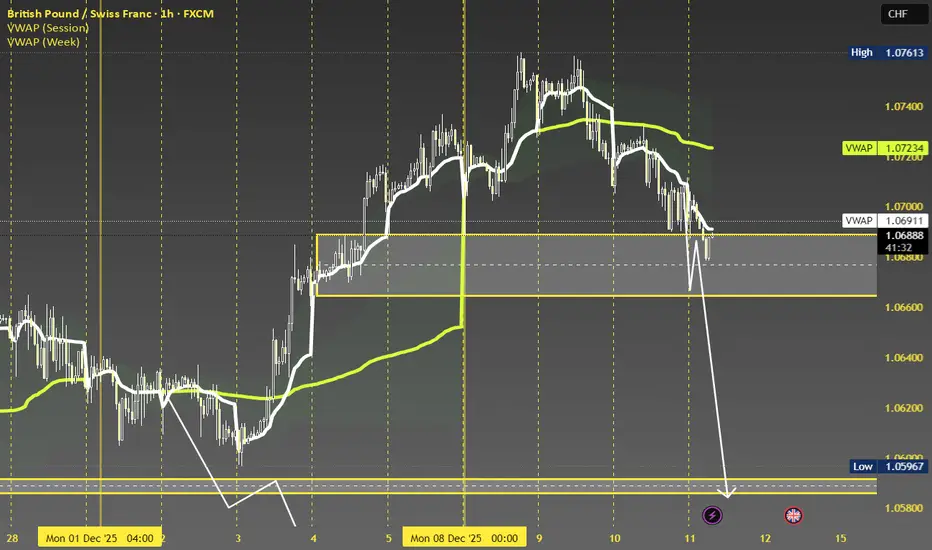
RIGHT SHOULDER POTENTIALLY FORMING BELOW KEY LEVELHello traders!
Here’s a GBP/CHF sell idea based on market structure, trend, momentum, and supporting fundamentals.
(This is market analysis, not financial advice. Always use proper risk management and seek additional confirmation before entering a trade.)
📉 Market Structure
• Overall bearish trend since mid-year (clear lower highs and lower lows).
• The recent rally into December appears corrective rather than impulsive.
• Price has rejected a prior supply / resistance zone, reinforcing bearish structure.
➡️ This move looks like a pullback into structure, not a trend reversal.
🔑 Key Sell Condition
Sell bias confirmed after a daily close below the 1.06700–1.07000 zone.
Why this matters:
• Confirms buyers failed to hold reclaimed structure
• Signals sellers are back in control
• Helps avoid getting trapped selling too early
🎯 Trade Plan
Entry
• Sell on a retest of the zone
(1.06700 – 1.07000)
Targets
1. TP1: 1.06000 (Intraday)
→ First demand / reaction low
2. TP2: 1.05500 (Swing)
→ Deeper demand & trend continuation level
Stop Loss
• Above the recent rejection high / supply zone
(Conservative traders may wait for a deeper pullback to tighten risk.)
🧠 Why This Setup Is Clean
• Daily timeframe confirmation ✅
• Rejection from prior supply ✅
• Trend alignment (sell rallies) ✅
• Clear invalidation if price reclaims the zone ❌
🇬🇧 UK Economic Data — Bearish GBP Pressure
📉 UK GDP Weakness
• UK GDP contracted 0.1% in October 2025, marking two consecutive months of contraction.
• This raises recession risks and increases pressure on the BoE to ease policy.
➡️ Why it matters:
Slower growth typically leads to currency weakness as markets price in lower rates and reduced yield appeal.
💷 BoE Rate Cut Expectations
• Markets are pricing in a BoE rate cut (potentially December 2025), with expectations for further easing into 2026.
➡️ FX implication:
Lower interest rates reduce GBP’s attractiveness relative to safer or more stable currencies like CHF.
📊 Inflation & Structural Weakness
• UK inflation remains elevated but is clearly easing.
• Structural growth issues and low business confidence continue to weigh on the pound.
🇨🇭 Swiss Economic Data — CHF Support Nuance
🟢 Swiss Inflation Softening
• Swiss inflation has fallen more than expected, occasionally weakening CHF in pairs like USD/CHF.
➡️ This may limit upside in CHF at times — however…
🏦 SNB Policy & Growth Outlook
• Switzerland maintains very low policy rates, with inflation historically subdued.
• The IMF has lowered Switzerland’s growth forecast, but overall stability remains intact.
➡️ Why CHF still strengthens:
Despite low rates, CHF remains a safe-haven currency, often strengthening during risk-off conditions.
📊 Why Fundamentals Support a GBP/CHF Drop
• ✅ BoE easing bias → GBP weakness
• ✅ Safe-haven demand for CHF during uncertainty
• ✅ Relative growth divergence favors CHF over GBP
📌 Final Conclusion
If UK data continues to weaken while CHF remains relatively stable, this strengthens the case for:
➡️ GBP/CHF breaking lower from resistance
🎯 Targeting 1.06000 and potentially 1.05500
Analyze for additional confirmations and good luck to all traders!
British Pound / Swiss Franc
No trades
Market insights

GBP/CHF SHORT FROM RESISTANCE
Hello, Friends!
GBP/CHF pair is trading in a local uptrend which we know by looking at the previous 1W candle which is green. On the 4H timeframe the pair is going up too. The pair is overbought because the price is close to the upper band of the BB indicator. So we are looking to sell the pair with the upper BB line acting as resistance. The next target is 1.067 area.
Disclosure: I am part of Trade Nation's Influencer program and receive a monthly fee for using their TradingView charts in my analysis.
✅LIKE AND COMMENT MY IDEAS✅

Hopping to buy GBPCHF (week 12-15)Hi forex trader
Here is a bearish chart that has turn with a BO
Most may buy at 1.06
I want IN at 1.05 and sell at 1.075

Possible long run on #GBPCHFTrade idea: LONG OANDA:GBPCHF
Going long on GBPCHF pair as it has reached the last Fibbonacci retracement level 78%. As we can see, a clear break of structure to the up side and price is showing some signs of weakness.
Entry Price: 1.0630
Stop-Loss (SL) 1.0600
Take-profit (TP) 1.0769
With a clear RRR of 1:3
DISCLAIMER: This is not financial advice. All trading involves risk. Do your own research

GBPCHF LOCAL LONG|
✅GBPCHF is approaching a key ICT demand zone after a corrective pullback. Price is likely to retest demand to mitigate imbalance and fill inefficiency before bullish continuation. Expect renewed displacement toward buy-side liquidity once demand is respected. Time Frame 6H.
LONG🚀
✅Like and subscribe to never miss a new idea!✅

GBPCHF...4H Pullback With Extreme Momentum Reading GBPCHF is currently in a clean 4H uptrend, but price is pulling back into a moderate support zone. What makes this setup interesting is the behavior of momentum during the pullback.
Structure
The uptrend is intact
Price is pulling back into a previously respected support level
Price has temporarily broken below the 50 EMA while approaching support
Momentum
Momentum is extremely low at –92, which is an unusually deep reading for a pullback.
When momentum gets this stretched, we often see sharp reversal signals if the structure supports it.
What We’re Watching
At the support zone, we will wait for:
A clear reversal candle (hammer, engulfing, strong rejection candles, etc.)
Volume stepping in
Momentum turning upward from the extreme level
No trade yet — just preparing.
This one could become a clean VMS continuation setup if buyers step in at support.
Not financial advice.

GBPCHF corrective pullback support at 1.0600The GBPCHF remains in a bullish trend, with recent price action showing signs of a corrective pullback within the broader uptrend.
Support Zone: 9490 – a key level from previous consolidation. Price is currently testing or approaching this level.
A bullish rebound from 1.0600 would confirm ongoing upside momentum, with potential targets at:
1.0708 – initial resistance
1.0736 – psychological and structural level
1.0776 – extended resistance on the longer-term chart
Bearish Scenario:
A confirmed break and daily close below 1.0600 would weaken the bullish outlook and suggest deeper downside risk toward:
1.0584 – minor support
1.0555 – stronger support and potential demand zone
Outlook:
Bullish bias remains intact while the GBPCHF holds above 1.0600. A sustained break below this level could shift momentum to the downside in the short term.
This communication is for informational purposes only and should not be viewed as any form of recommendation as to a particular course of action or as investment advice. It is not intended as an offer or solicitation for the purchase or sale of any financial instrument or as an official confirmation of any transaction. Opinions, estimates and assumptions expressed herein are made as of the date of this communication and are subject to change without notice. This communication has been prepared based upon information, including market prices, data and other information, believed to be reliable; however, Trade Nation does not warrant its completeness or accuracy. All market prices and market data contained in or attached to this communication are indicative and subject to change without notice.

GBPCHF: Market of Buyers
Looking at the chart of GBPCHF right now we are seeing some interesting price action on the lower timeframes. Thus a local move up seems to be quite likely.
Disclosure: I am part of Trade Nation's Influencer program and receive a monthly fee for using their TradingView charts in my analysis.
❤️ Please, support our work with like & comment! ❤️

GBPCHF Will Grow! Long!
Please, check our technical outlook for GBPCHF.
Time Frame: 1h
Current Trend: Bullish
Sentiment: Oversold (based on 7-period RSI)
Forecast: Bullish
The price is testing a key support 1.066.
Current market trend & oversold RSI makes me think that buyers will push the price. I will anticipate a bullish movement at least to 1.071 level.
P.S
The term oversold refers to a condition where an asset has traded lower in price and has the potential for a price bounce.
Overbought refers to market scenarios where the instrument is traded considerably higher than its fair value. Overvaluation is caused by market sentiments when there is positive news.
Like and subscribe and comment my ideas if you enjoy them!

GBPCHF SELL IDEAAnother slow week for, CHF has possibilities to get even stronger. We can take advantage of the pair if the price continue fall
GBPCHF is Ready for a breakthroughHello Traders
In This Chart XAGUSD HOURLY Forex Forecast By FOREX PLANET
today XAGUSD analysis 👆
🟢This Chart includes_ (XAGUSD market update)
🟢What is The Next Opportunity on XAGUSD Market
🟢how to Enter to the Valid Entry With Assurance Profit
This CHART is For Trader's that Want to Improve Their Technical Analysis Skills and Their Trading By Understanding How To Analyze The Market Using Multiple Timeframes and Understanding The Bigger Picture on the Charts


Strong bullish momentum?GBP/CHF is falling towards the pivot whic aligns with the 23.6% Fibonacci retracement and could bounce to the 1st resistance.
Pivot: 1.0664
1st Support: 1.0615
1st Resistance: 1.0774
Disclaimer:
The opinions given above constitute general market commentary and do not constitute the opinion or advice of IC Markets or any form of personal or investment advice.
Any opinions, news, research, analyses, prices, other information, or links to third-party sites contained on this website are provided on an "as-is" basis, are intended to be informative only, and are not advice, a recommendation, research, a record of our trading prices, an offer of, or solicitation for, a transaction in any financial instrument and thus should not be treated as such. The information provided does not involve any specific investment objectives, financial situation, or needs of any specific person who may receive it. Please be aware that past performance is not a reliable indicator of future performance and/or results. Past performance or forward-looking scenarios based upon the reasonable beliefs of the third-party provider are not a guarantee of future performance. Actual results may differ materially from those anticipated in forward-looking or past performance statements. IC Markets makes no representation or warranty and assumes no liability as to the accuracy or completeness of the information provided, nor any loss arising from any investment based on a recommendation, forecast, or any information supplied by any third party


GBPCHF BUYSHere’s the thought process behind this GBPCHF setup and why I executed it the way I did:
1. Higher-Time-Frame Context
Price has been in a clear bullish structure, consistently breaking previous highs and respecting major demand zones. The key thing I’m tracking is how price keeps holding premium/discount structure cleanly and respecting institutional levels.
2. First Trade – Breakout + Demand Retest
The first long position was taken after:
Price broke above a major HTF resistance level (now support).
We got a clean retest into demand, aligning with the ascending trendline.
Bullish orderflow remained intact, showing continuation.
Price followed through perfectly, validating that the market was still being accumulated by larger players.
3. Mid-Range Correction – Bullish Continuation
After the first push:
Price formed a descending correction channel, a classic re-accumulation pattern.
Liquidity built above equal highs inside the range.
Once the descending channel was broken, momentum shifted back to the upside.
This confirmed continuation and gave me confidence that the bullish trend was not finished.
4. Second Entry – Break of Structure + Retest
My latest entry came after:
Clean BOS to the upside, clearing the internal lower-time-frame liquidity.
Price then pulled back into the last bullish orderblock, lining up perfectly with a fresh ascending trendline.
The overall structure remained bullish, creating a high-probability continuation setup.
This is where I executed the new long position.
5. Confluence Stack
The trade is supported by multiple institutional confluences:
✔ Market Structure:
Strong bullish orderflow, consistent HH/HL formations.
✔ Liquidity Engineering:
Previous equal highs swept → new liquidity generated above current highs → targets align.
✔ Re-Accumulation Pattern:
The corrective downward channel signaled institutional accumulation, not reversal.
✔ Trendline Respect:
Trendline has been respected multiple times, acting as dynamic support.
✔ Discount Entry:
Pullback returned to a discounted area relative to the bullish impulse leg.
6. What I’m Watching Next
I’m currently monitoring:
Continuation of the trendline respect
Possible break and retest of the minor ascending trendline
→ This would add even more confluence for a push into higher targets.
Targets remain the next liquidity levels above recent highs.
As long as the trendline and bullish structure hold, I’ll stay in this trade and let it run toward the next premium levels.

GBPCHF: Breaks the Channel — Bullish Continuation Ahead?GBPCHF: Breaks the Channel — Bullish Continuation Ahead?
GBPCHF has successfully broken out of the descending channel, showing renewed bullish momentum after months of gradual decline.
The buyers are regaining control, and the pair is now heading toward key resistance levels.
If the price holds above the channel breakout zone, we may see a continuation toward the first target at 1.09200.
A sustained move above 1.09200 opens the door toward the higher resistance zone near 1.11500, which remains the major bullish target for the coming weeks.
You may find more details in the chart!
Thank you and Good Luck!
❤️PS: Please support with a like or comment if you find this analysis useful for your trading day❤️

GBPCHF LONG Market structure bullish on HTFs 3
Entry at Daily AOi
Weekly Rejection at AOi
Daily Rejection at AOi
Previous Daily Structure Point
Around Psychological Level 1.06500
Touching EMA H4
H4 Candlestick rejection
Rejection from Previous structure
TP: WHO KNOWS!
Entry 100%
REMEMBER : Trading is a Game Of Probability
: Manage Your Risk
: Be Patient
: Every Moment Is Unique
: Rinse, Wash, Repeat!
: Christ is King.

GBPCHF FREE SIGNAL|SHORT|
✅GBPCHF price has tapped into a higher-timeframe supply zone after running buy-side liquidity above recent swing highs, creating an ICT bearish rejection that shifts order-flow toward discount levels and favors a corrective move lower.
—————————
Entry: 1.0754
Stop Loss: 1.0782
Take Profit: 1.0710
Time Frame: 6H
—————————
SHORT🔥
✅Like and subscribe to never miss a new idea!✅

GBPCHF SellHello traders, I just took this setup. The trend is most likely to continue downwards and the price is currently sitting in a resistance level which previously acted as support in three levels. The risk reward ratio is 1 to 3.25 which a very ratio.

GBPCHF bullish breakout continuation supported at 1.0664The GBPCHF remains in a bullish trend, with recent price action showing signs of a breakout within the broader uptrend.
Support Zone: 1.0664 – a key level from previous consolidation. Price is currently testing or approaching this level.
A bullish rebound from 1.0664 would confirm ongoing upside momentum, with potential targets at:
1.0746 – initial resistance
1.0776 – psychological and structural level
1.0817 – extended resistance on the longer-term chart
Bearish Scenario:
A confirmed break and daily close below 1.0664 would weaken the bullish outlook and suggest deeper downside risk toward:
1.0646 – minor support
1.0624 – stronger support and potential demand zone
Outlook:
Bullish bias remains intact while the GBPUSD holds above 1.0664. A sustained break below this level could shift momentum to the downside in the short term.
This communication is for informational purposes only and should not be viewed as any form of recommendation as to a particular course of action or as investment advice. It is not intended as an offer or solicitation for the purchase or sale of any financial instrument or as an official confirmation of any transaction. Opinions, estimates and assumptions expressed herein are made as of the date of this communication and are subject to change without notice. This communication has been prepared based upon information, including market prices, data and other information, believed to be reliable; however, Trade Nation does not warrant its completeness or accuracy. All market prices and market data contained in or attached to this communication are indicative and subject to change without notice.


GBPCHFGBPCHF price is near the support zone of 1.06034-1.05876. If the price cannot break above 1.05732, it is expected that the price will rebound. Consider buying in the red zone.
🔥Trading futures, forex, CFDs and stocks carries a risk of loss.
Please consider carefully whether such trading is suitable for you.
>>GooD Luck 😊
❤️ Like and subscribe to never miss a new idea!

GBPCHF higher bullish from here expected
OANDA:GBPCHF trend based analysis, in last periods we are have strong bearish trend. First time i am expect changes in period 31.10 - 7.11,
but price is make one more bearish.
In this week we having bullish trend and from here expecting and higher bullish.
SUP zone: 1.05300
RES zone: 1.07000, 1.07550
