GBP/JPY - Breakout (22.08.2025)The GBP/JPY TRADENATION:GBPJPY pair on the M30 timeframe presents a Potential Buying Opportunity due to a recent Formation of a Breakout Pattern. This suggests a shift in momentum towards the upside and a higher likelihood of further advances in the coming hours.
Possible Long Trade:
Entry: Consider Entering A Long Position around Trendline Of The Pattern.
Target Levels:
1st Resistance – 200.02
2nd Resistance – 200.42
🎁 Please hit the like button and
🎁 Leave a comment to support for My Post !
Your likes and comments are incredibly motivating and will encourage me to share more analysis with you.
Best Regards, KABHI_TA_TRADING
Thank you.
Disclosure: I am part of Trade Nation's Influencer program and receive a monthly fee for using their TradingView charts in my analysis.
GBPJPY trade ideas

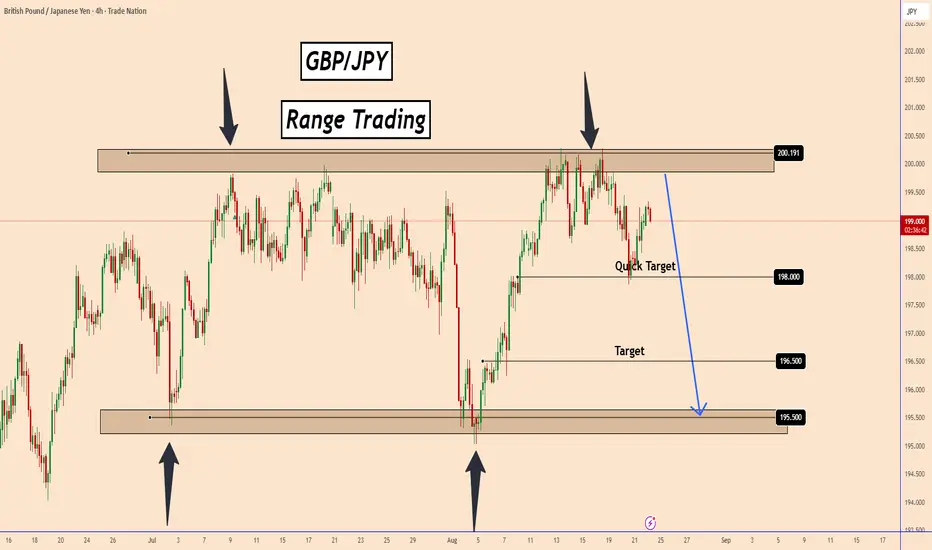
GBPJPY: Potential Range Trading Setup - Remains IntactGBPJPY: Potential Range Trading Setup - Remains Intact
From the last analysis I posted, GBPJPY fell by almost -115 pips, but everything was wiped out again.
The price could not fall any further, so we may see a larger correction taking place before GBPJPY takes a clear direction.
Overall, our analysis remains intact, considering that the price did not move much from its primary position.
Considering that it is still August, volume is still low and nothing is taking direction in general, so with the new month we may see movement and perhaps GBPJPY may start the swing move we are expecting.
The first support level is around 198. If this level fails, the next likely targets are 196.50 and 195.50, as shown on the chart.
You may find more details in the chart!
Thank you and Good Luck!
PS: Please support with a like or comment if you find this analysis useful for your trading day
Disclosure: I am part of Trade Nation's Influencer program and receive a monthly fee for using their TradingView charts in my analysis.

GBPJPY: Potential Range Trading SetupGBPJPY: Potential Range Trading Setup
GBPJPY recently tested a strong resistance area near 200 and reacted with a pullback. This suggests the pair might be gearing up for another move lower.
Risk remains elevated across all XXXJPY pairs, especially since the yen has been weak for an extended period. Based on current price action, GBPJPY appears to be forming a range — with signs pointing to a possible breakdown.
The first support level is around 198. If this level fails, the next likely targets are 196.50 and 195.50, as shown on the chart.
You may find more details in the chart!
Thank you and Good Luck!
PS: Please support with a like or comment if you find this analysis useful for your trading day
Disclosure: I am part of Trade Nation's Influencer program and receive a monthly fee for using their TradingView charts in my analysis.
GBPJPY – Bulls Knocked Out, Bears Step In!After rejecting the 200.00 resistance, GBPJPY broke below key structure and shifted momentum to bearish.
Price is now retesting the broken support turned resistance, aligned with a descending trendline.
🔎 As long as this area holds, the bias remains bearish with potential for another downward leg.
👉 Plan: Look for short opportunities around the retest zone.
📚 Always follow your trading plan regarding entry, risk management, and trade management.
Good luck!
All Strategies Are Good; If Managed Properly!
~Rich
Disclosure: I am part of Trade Nation's Influencer program and receive a monthly fee for using their TradingView charts in my analysis.

Long trade
📒 Trade Journal Entry
Pair: GBPJPY
Date: Monday, 25th August 2025
Time: 10:00 PM
Session: Tokyo Session PM
Time Frame: 15 min
📊 Trade Details
Direction: Buyside
Entry Price: 198.491
Profit Level (TP): 199.183 (+0.35%)
Stop Level (SL): 198.422 (−0.03%)
Risk-Reward (RR): 10.63 : 1
🧠 Context / Trade Notes
Trade aligned with session-based liquidity sweep around Tokyo PM.
RSI was in mid-range (~54), suggesting recovery from oversold conditions.
Volume profile shows spike in activity near lows, consistent with accumulation.
Key levels respected:
TWO: 198.582 acting as intraday support.
TWH: 199.3 and YDH: 199.226 as potential liquidity magnets.
Buyside imbalance zone (highlighted on chart) gave entry confirmation.
✅ Trade thesis:
Reactive buy from 198.491 was based on liquidity sweep into support (TWL 198.279) with bullish RSI and VWAP alignment. Target set just below daily high liquidity at 199.183 for precision exit.

GBP/JPY UpdateNext move on the way focus on proper risk management & stay disciplined. Wishing you successful trades...!!
Key Reason:
1.Drop base drop structure.
2.Price taken out buy side inducement.
3.Minor MSS formed.
4.Fib. customized level.
Wait for retracement and than switch into lower time frame for confirmation. Let's see how it will work. This is not a financial advice take it with your own risk.

I'm on gbp/jpy chartGbp/jpy
I believe we are heading to 207.856 Level
The market is bullish so we might have opportunity to buy somewhere around 197.634

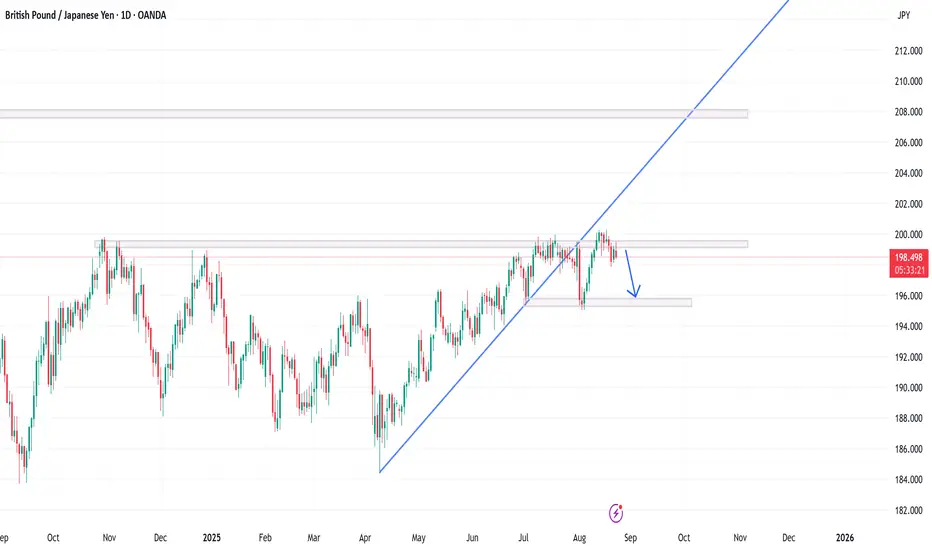
GBPJPY Daily – Double Top Signals Potential ReversalAnalysis:
GBPJPY has recently tested the 199.400 daily resistance zone and failed to break higher. On the daily timeframe, we can clearly see the formation of a Double Top (M pattern), which often signals exhaustion in bullish momentum.
Price rejected strongly from the resistance area, confirming sellers are defending this level.
The break below the ascending trendline adds further weight to bearish sentiment.
If momentum continues, the next key support sits around 195.500, which aligns with previous structure and demand.
Scenarios:
Bearish case: Continuation toward 195.500 support.
Bullish case: Only a strong daily close above 199.400 would invalidate the bearish setup and potentially open doors toward 208.000.
Note: Traders should watch for confirmation before entering. Risk management remains crucial due to GBPJPY’s volatility.
💬 Do you think GBPJPY breaks down to 195.500, or will bulls defend 199.400?
📌 Follow me for more setups.
GBPJPY Major TrendlineGJ is approaching a third touch of a major trend line dating back to 9th April, 2025. I've identified a solid level of support around this area and think this is a valid area to go long!

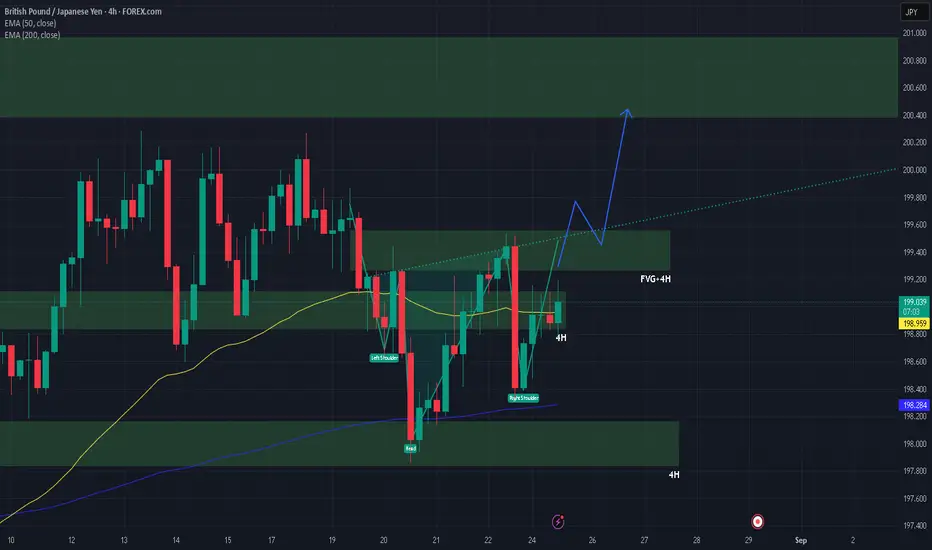
Bullish outlook for GBPJPY?Is this a valid possible reversal to a bullish trend? Broke structure and waiting for retest of the Fair Value Gap and break 4h resistance zone.
#GBPJPY:Will Price Reverse? In our previous idea, we had expressed our point of view on this pair and price did exactly what we had expected. Price dropped 600+ pips and then reversed right back to the entry zone. So what now? We now expect a similar movement while we need to wait for stronger confirmation.
Team Setupsfx


GBPJPY Technical & Order Flow AnalysisOur analysis is based on a multi-timeframe top-down approach and fundamental analysis.
Based on our assessment, the price is expected to return to the monthly level.
DISCLAIMER: This analysis may change at any time without notice and is solely intended to assist traders in making independent investment decisions. Please note that this is a prediction, and I have no obligation to act on it, nor should you.
Please support our analysis with a boost or comment!

GBPJPY : IMPORTANTHello friends
You can see that the downward waves are getting longer and the upward waves are getting shorter, which indicates the strength of the sellers, and a triangle has also formed, which compresses the price and can, in the event of a valid failure, go down another downward step, which will become a continuation triangle.
Don't forget risk and capital management.
*Trade safely with us*

GBPJPY Setup (1H)Price is breaking out of resistance around 198.950 – 199.070.
✅ Entry: 198.984 (Buy)
🎯 Take Profit: 199.657
🛑 Stop Loss: 198.740
I’m looking for continuation to the upside after retest of structure.

short position GBPJPYvery interesting, price failed to break higher, waiting for more sellers to showup and push even lower

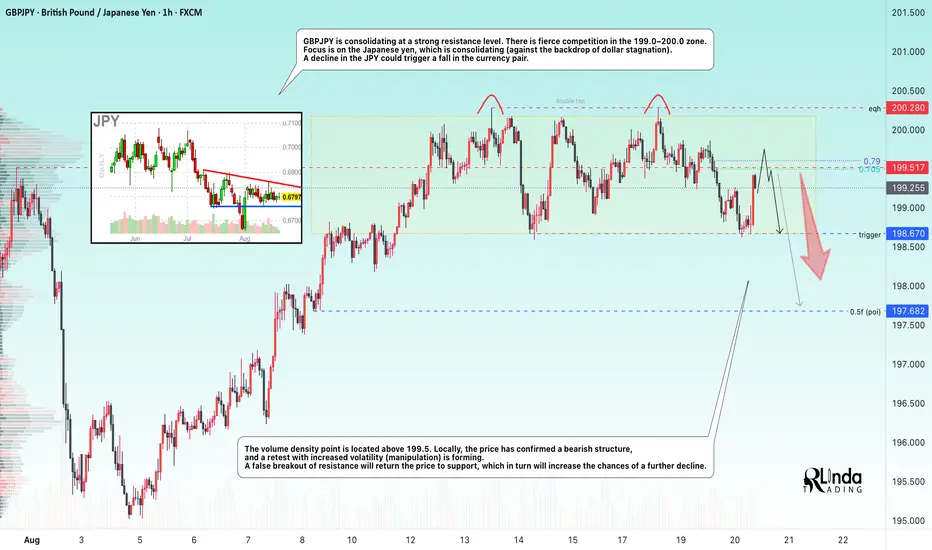
GBPJPY → False breakout and reversal patternFX:GBPJPY is forming a false breakout of strong resistance from D1. A trading range (consolidation) is forming, and market participants are fighting for the 199.0 - 200.0 zone.
GBPJPY is consolidating at strong resistance. A fierce battle is underway for the 199.0-200.0 zone. Focus is on the Japanese yen, which is consolidating (against a backdrop of dollar stagnation). A decline in the JPY could trigger a fall in the currency pair.
The volume density point is located above 199.5. Locally, the price has confirmed a bearish structure, and a retest is forming on increased volatility (manipulation). A false breakout of resistance will return the price to support, which in turn will increase the chances of a further decline
Resistance levels: 199.5, 200.28
Support levels: 198.67, 197.68
A double top reversal pattern is forming on the chart, indicating the presence of strong limit resistance, but the pattern has not yet been realized. The trigger is consolidation support. Locally, I expect a decline from 199.5 to retest the trigger, the breakout of which could trigger the reversal pattern.
Best regards, R. Linda!
GBP/JPY - Short trade Signal🚨 GBP/JPY – Short Setup Alert 🚨
Price just swept liquidity into a supply zone and rejected hard — classic smart money move. Structure is still bearish, and buyers show weak momentum.
📍 Entry: 198.928
⛔ Stop Loss: 199.455 (52.7 pips risk)
🎯 Take Profit: 197.099 (182.9 pips reward)
⚖️ R/R: 3.47R
🔎 Why I Like This Trade:
Liquidity sweep + rejection ✅
Bearish structure intact ✅
High confluence with demand zone below ✅
Strong 3.5R reward-to-risk ✅
This setup gives plenty of room for downside continuation. Managing risk is key here — I’m running it with tight stops, but still aiming for a big payoff.

GBPJPY Sell idea 1. Market Structure
• The pair recently created a lower high around the 199.25 zone, failing to break above previous resistance.
• Price has since made a lower low at 198.28, showing bearish intent.
• The current pullback into the supply area (199.00 – 199.25) suggests a possible continuation to the downside.
2. Supply & Demand Zones
• Supply zone (199.00 – 199.25): Previous rejection area where sellers stepped in.
• Demand zone (198.28): Minor support, but already tested and likely to be weak.
• Next strong demand is near 196.97, making it a logical target for bears.
3. Candlestick Behavior
• Current candles show rejection wicks near the supply zone.
• Momentum slowing down near resistance indicates possible exhaustion of buyers.
4. Trade Setup (Short Bias)
• Entry: Around 198.90 – 199.00 (supply retest).
• Stop-Loss (SL): Above 199.25 (previous high).
• Take-Profit (TP):
• TP1: 198.28 (local support).
• TP2: 196.97 (major target).
• Risk-to-Reward (R:R): Approximately 1:3, favoring sellers.
5. Confluences Supporting the Sell
• Lower high formation = bearish structure.
• Supply rejection at 199.00 zone.
• Risk/reward ratio is favorable (tight SL, extended downside potential).
• Psychological level 199.00 acting as resistance.
⸻
📉 Bearish Outlook
As long as GBPJPY trades below 199.25, the bearish bias remains valid. A clean break and close above this level would invalidate the setup and shift bias back to bullish.

GBPJPY – Bears Just Getting Started?1. Market’s Context
In my previous two analyses, I highlighted the high probability of a drop in GBPJPY and noted that as long as resistance holds, the preferred scenario is to look for selling opportunities.
Yesterday, the market finally broke below the 199.00 support, reaching a local low around 198.90.
________________________________________
2. The Key Question
Was this just the first step of a deeper bearish move?
________________________________________
3. Why the Bearish Case is Strong
• Resistance remains intact, limiting upside potential.
• Break of 199.00 support confirms bearish momentum.
• Current price action looks more like a corrective rebound than a reversal.
• Structure suggests the decline could just be starting.
________________________________________
4. Trading Plan
• I remain bearish.
• Selling rallies is back in play.
• Target: the 195.00 zone remains my focus.
________________________________________
5. Final Note 🚀
GBPJPY has confirmed the break—now it’s all about execution. Sell the rebounds, aim for 195.
Disclosure: I am part of TradeNation's Influencer program and receive a monthly fee for using their TradingView charts in my analyses and educational articles.

GBPJPY - HTF - UPTREND Risk Disclaimer
Trade on Your Own Risk
GBPJPY Correction TP1 --- 1:1 --> TP2 --- 1:2

Sel GBPJPYGBPJPY sell idea on the 1hr chart. This should be the main move for Monday. A bearish flag was used to identify the sell

GBP/JPY - Triangle Breakout (18.08.2025)The GBP/JPY pair on the M30 timeframe presents a Potential Buying Opportunity due to a recent Formation of a Triangle Breakout Pattern. This suggests a shift in momentum towards the upside and a higher likelihood of further advances in the coming hours.
Possible Long Trade:
Entry: Consider Entering A Long Position around Trendline Of The Pattern.
Target Levels:
1st Resistance – 200.79
2nd Resistance – 201.24
🎁 Please hit the like button and
🎁 Leave a comment to support for My Post !
Your likes and comments are incredibly motivating and will encourage me to share more analysis with you.
Best Regards, KABHI_TA_TRADING
Thank you.
Disclosure: I am part of Trade Nation's Influencer program and receive a monthly fee for using their TradingView charts in my analysis.
