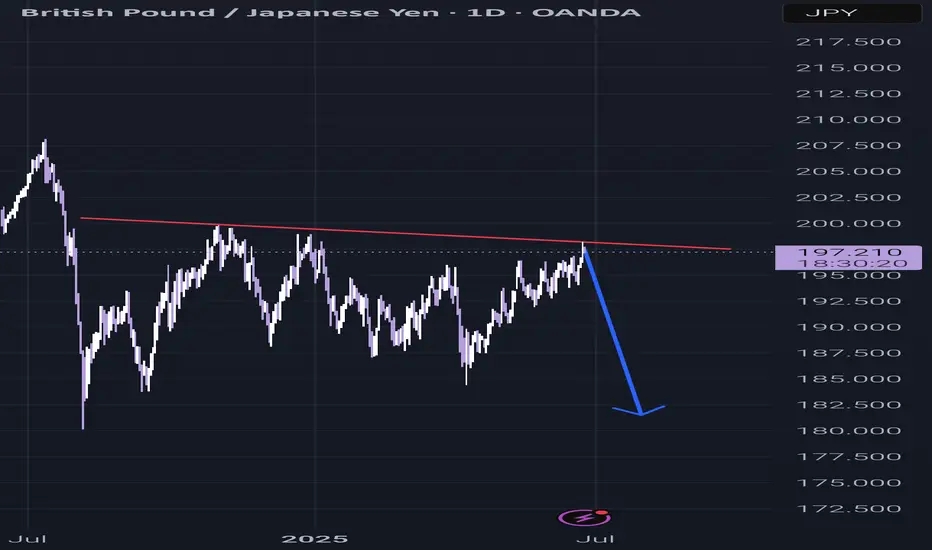
GBPJPY Ascending Triangle Breakout!
HI,Traders !
#GBPJPY is trading in an
Uptrend and the pair is
Now breaking out of the
Ascending Triangle so we
Are bullish biased now
And we will be expecting a
Further move up !
Comment and subscribe to help us grow !
GBPJPY trade ideas

GJ Showing Bearish Pressure.Hi there,
GJ looks bearish on the M30 chart, with a price target of 196.850 and a bias of 196.419.
If the price reverses and breaks through 198.010, that will invalidate the bias.
Happy Trading,
K.
Not trading advice

GBPJPY 4hr chart Analaysis I expect GBP/JPY to turn bullish, with a potential pullback from the 191.67–191.00 zone. It’s also possible that the price slightly dips lower, reaching around 190.50, before starting a bullish trend. From there, the price may rise towards the reversal zone at 195.38–196.00.
If it breaks above this zone, the next target could be around 198.04. That level is where I expect a potential bearish reversal to occur.
This is my personal analysis based on my current understanding of the market — it's not guaranteed to be 100% accurate, but I would estimate there's around an 80% probability of it playing out this way

GBPJPY SHORT FORECAST Q2 W26 D27 Y25GBPJPY SHORT FORECAST Q2 W26 D27 Y25
Professional Risk Managers
Welcome back to another FRGNT chart update
Diving into some Forex setups using predominantly higher time frame order blocks alongside confirmation breaks of structure.
Let’s see what price action is telling us today
Here are some trade confluences
Weekly Order Block Identified
Daily Order block identified
4H Order Block identified
15' Order block identified
Remember, to participate in trading comes always with a degree of risk, therefore as professional risk managers it remains vital that we stick to our risk management plan as well as our trading strategies.
The rest, we leave to the balance of probabilities.
Fail to plan. Plan to fail.
It has always been that simple.
Good luck with your trading journey, I shall see you at the very top.
Trade consistent, FRGNT X

GBPJPY: Let It Come Lower Before It Goes HigherGBPJPY swept the highs, broke structure, and is now giving signs of a clean retracement. There’s a visible FVG just below, and a small liquidity pocket that hasn’t been touched yet.
If price drops into that zone and respects it, we could see a strong bounce that takes us right back into the highs and beyond.
This setup looks like a simple buy-the-dip scenario , but only if the zone reacts cleanly. No rush. Let price come down. Watch for confirmation before thinking long.
Don’t chase it. Let it unfold.

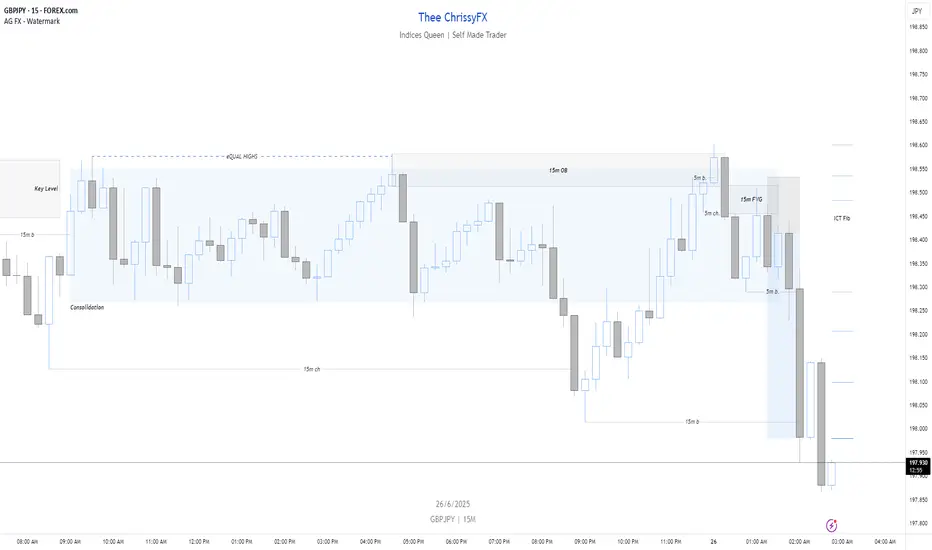
GBPJPY Shorts 6/26/25Priced formed a consolidation on Key Level 198.500 creating eQUAL Highs earlier in the day. Price broke out of the consolidation creating a bearish choch on the 15m timeframe. Price made a steep pull back into the consolidation once more tapping into a 15m OB while also taking out BSL the eQUAL High left behind. Within the 15m OB and key level there was a bearish 5m b/ch which created a 15m FVG. I drew a Fib from the 5m high/low which aligned with the 15m FVG and scaled down to the 1m time frame. From there I waited for a MsS/ch and entered the trade taking profit at the -1 deviation.
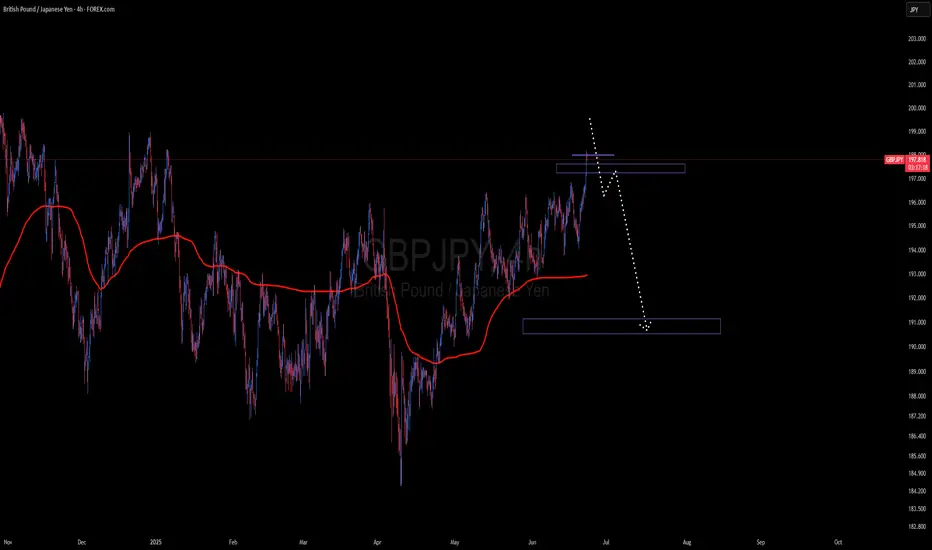
GBP/JPY 4-Hour Chart (OANDA) - June 26, 20254-hour performance of the British Pound (GBP) against the Japanese Yen (JPY) from OANDA, as of June 26, 2025, 11:14 AM PKT. The current exchange rate is 197.978, reflecting a decrease of 0.509 (-0.26%). The chart highlights a recent downward trend after reaching a peak near 199.548, with key support and resistance levels marked between 196.502 and 199.548.

GBPJPY SHORT FORECAST Q2 W26 D26 Y25GJ SHORT FORECAST Q2 W26 D26 Y25
Professional Risk Managers👋
Welcome back to another FRGNT chart update📈
Diving into some Forex setups using predominantly higher time frame order blocks alongside confirmation breaks of structure.
Let’s see what price action is telling us today! 👀
💡Here are some trade confluences📝
✅Weekly Order Block Identified
✅Daily Order block identified
✅4H Order Block identified
✅15' Order block identified
🔑 Remember, to participate in trading comes always with a degree of risk, therefore as professional risk managers it remains vital that we stick to our risk management plan as well as our trading strategies.
📈The rest, we leave to the balance of probabilities.
💡Fail to plan. Plan to fail.
🏆It has always been that simple.
❤️Good luck with your trading journey, I shall see you at the very top.
🎯Trade consistent, FRGNT X

CHECK GBPJPY SIGNAL READ CAPTAIN
Direction: Short (Sell Setup)
Entry Zone: Around 198500\198350
Stop Loss: 146350
Take Profits:
TP1: ~197800
TP2: ~197150
Final Target: 196400


GJ sugar high VS reevesThe sugar high will wear off as the risk on geo tension premium evaporates & the fiscal liability hits from Reeves' autumn budget, it's a 1 to 5 reward and I'm betting the farm, or in my case the seedling! happy hunting

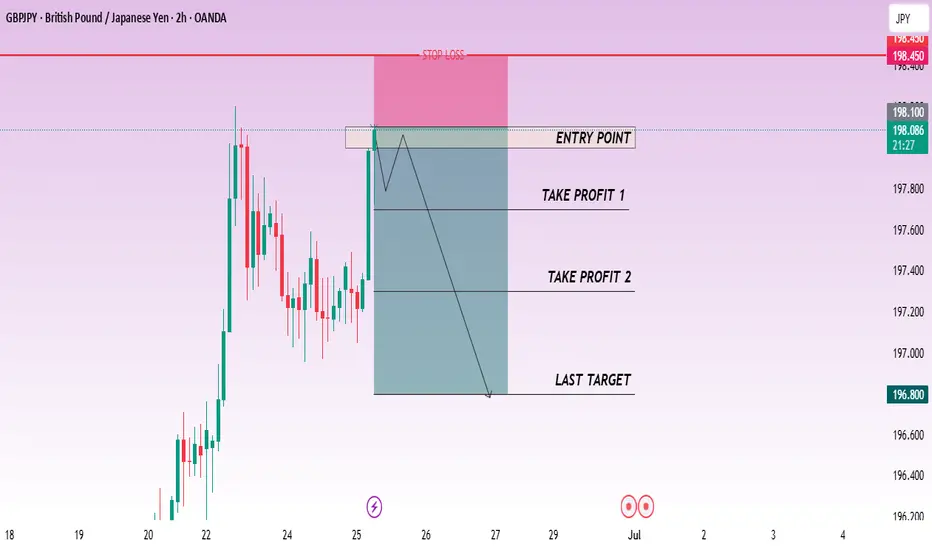
CHECK GBPJPY SIGNAL READ CAPTAINPair: GBP/JPY
Direction: Short (Sell Setup)
Current Price: ~198.054
Entry Zone: Around 198.100
Stop Loss: 198.450
Take Profits:
TP1: ~197.750
TP2: ~197.350
Final Target: 196.800
GJ-Wed-25/06/25 TDA-Bullish structure created, more upsidesAnalysis done directly on the chart
Follow for more, possible live trades update!
I often share my live trades in Tradingview public chat in London session, stay tuned!
Knowing when not to trade is as important as taking good trades.
Just like you can take good trades, good wins. Understanding when not
to trade, it can saves you from bad trades and avoidable losses.
Easy to say than done.
Active in London session!
Not financial advice, DYOR.
Market Flow Strategy
Mister Y

GBPJPY fromed Symmetrical Triangle Enter on Breakout 🔻 Bias: Bearish
Lower highs and tightening range indicate weakening bullish momentum.
A confirmed break below the 196.345 support could trigger a bearish move.
Downside targets:
TP1: 195.60
TP2: 195.23
🔍 Invalidation:
Bullish breakout above 197.59 would negate this setup and suggest trend continuation.
Strategy: Wait for a clean breakout and retest for confirmation. Use tight SL above the triangle if entering short.

GBPJPY: Price is trading at crucial level, Possible Swing MoveDear Traders,
GBPJPY, price is currently trading at very crucial area from where we can expect price to reverse, currently the price momentum shows a strong bearish presence. This can be a swing sell after looking at the data, price can touch the previous yearly low.

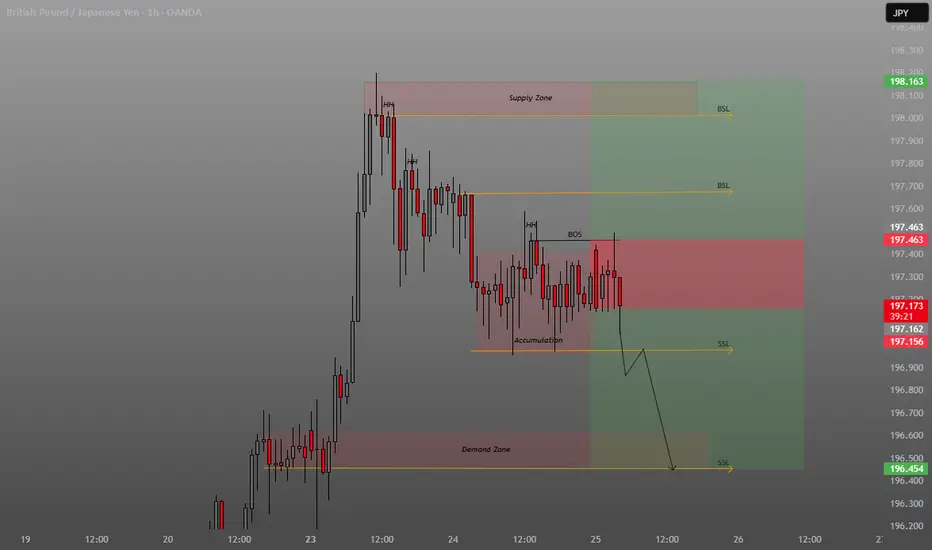
Indicates where institutional sellers may enter the market.smart money concept (SMC) trading setup. Here's a breakdown of what's depicted:
🔍 Chart Overview
Timeframe: 1 Hour (1H)
Instrument: GBP/JPY
Analysis Date: June 25, 2025
Price at Time of Screenshot: ~197.198
📌 Key Zones and Levels
Supply Zone (Top red box near 198.163):
Indicates where institutional sellers may enter the market.
Labeled with BSL (Buy-side Liquidity) above, suggesting liquidity resting above the highs.
Demand Zone (Bottom red box near 196.454):
Represents an area where institutional buying interest is expected.
SSL (Sell-side Liquidity) is marked just below, pointing to liquidity under previous lows.
Accumulation Zone (Middle of chart):
Consolidation area suggesting potential accumulation by smart money before a possible move down.
🏷 Annotated Elements
HH (Higher High) and BOS (Break of Structure):
"HH" indicates recent local high points.
"BOS" suggests a market structure break to the downside—typically a bearish signal in SMC.
SSL & BSL (Liquidity Zones):
SSL (Sell-side Liquidity): Stops of long positions below swing lows.
BSL (Buy-side Liquidity): Stops of short positions above swing highs.
Price Projection:
Arrows show a bearish projection, expecting price to drop from the current area (~197.2) towards the SSL near 196.454, possibly hitting the demand zone.
📉 Interpretation
Bearish Bias:
After the BOS and accumulation phase, the chart anticipates a breakdown, targeting liquidity below.
Entry/Exit Zones:
Potential short entry in the red supply/accumulation area.
Targeting the green demand zone near 196.500 for a take-profit.
GBPJPY 4Hr Chart Analaysis The GBP/JPY pair is showing signs of a potential bearish reversal. The key resistance level at 198.214 -199.372 may serve as a turning point, with price projected to decline toward the 190.588 support area in the upcoming sessions.
SHORT ON GBP/JPYGJ has given us a CHOC (change of character) on the Lower timeframes breaking a strong low.
I will be selling GJ to the next demand level basically catching the pullback to its overall UPTREND.
looking to catch 200-300 pips this week.


GBPJPY| Midweek OutlookEven though it’s midweek, I wanted to share an update on GBPJPY and walk you through the process so far.
Price has been showing clear bullish structure from the 4H down to the 30M, so I remained patient and waited for price to revisit and mitigate a bullish order block — and that’s exactly what we got.
Now that mitigation has played out, I’m watching closely for LTF confirmations to line up. Ideally looking for entry opportunities around 196.006 – 195.922, depending on how the lower timeframes react and confirm.
Not rushing anything — just executing based on structure, mitigation, and confirmation. I’ll continue updating as price develops.
#GBPJPY #SMC #OrderBlock #SmartMoneyConcepts #PriceAction #ForexTrading #GJSetup #MidweekOutlook #InducementKing #DayTrader
Bless Trading!

GBPJPY Bullish Momentum AnalysisGBPJPY Bullish Momentum Analysis
The GBPJPY pair is currently under bullish pressure, having broken through key resistance levels suggesting the potential for further upside continuation. This movement is supported by a weakening Japanese yen, driven in part by the continued strength of the US dollar and rising global yields.
Resistance Levels 200.00
Support Levels 196.000
Technically Key resistance and small correction the bullish structure has not broken the price returns break and get there resistance.
You May find more detils in the chart Ps Support with like and comments for more analysis.

SELL GBPJPY (SELL 197.100 , SL 200.100 , TP 194.100)GBPJPY will go down soon. It seems exhausted to go up since yesterday.
GBP/JPY Revisits 198.08All the way back in 2008, around the Financial Collapse, GBP/JPY posted a massive gap on the monthly chart and here we are, more than 16 years later, and that space on the chart continues to loom large.
The August 2008 close at 198.08 led into the September open at 193.61, and over the past couple of weeks those prices have played a big role in GBP/JPY price action, much as they have since last March when that zone finally came back into play when the gap was finally filled in April of last year.
Last week GBP/JPY had set up an ascending triangle formation, with resistance around the 196.50 area and a progression of higher-lows since April and through May and early-June. Bulls defended 193.61 on a pullback last week, and came back with a vengeance to drive a breakout into this week with that 198.08 level coming back into the picture to set the current highs.
If looking for Yen-weakness, I remain of the mind that this could be a more attractive venue than USD/JPY, further illustrated by the sizable pullback showing in the major pair today compared to the move in GBP/JPY. - js
