Never Miss This Bullish SetupOur analysis is based on multi-timeframe top-down analysis & fundamental analysis.
Based on our view the price will rise to the monthly level.
DISCLAIMER: This analysis can change anytime without notice and is only for assisting traders in making independent investment decisions. Please note that this is a prediction, and I have no reason to act on it, and neither should you.
Please support our analysis with a like or comment!
Let’s master the market together. Please share your thoughts and encourage us to do more by liking this idea.
GBPNZD trade ideas

GBPNZD (Bearsih) Power Of Three (Manipulation)What has been done will be done again there is nothing new under the sun ☀️ (W.D.G)

GBPNZD (Bearish) Head And Shoulders What has been done will be done again there is nothing new under the sun ☀️ (W.D.G)

GBPNZD: Bullish Continuation After Breakout 🇬🇧🇳🇿
GBPNZD is likely to keep rising after a retest of a recently
broken horizontal key level.
I will expect an up movement to 2.2 level.
❤️Please, support my work with like, thank you!❤️

GBP_NZD LOCAL BULLISH REBOUND|LONG|
✅GBP_NZD made a strong
Move up from the rising
Support just as we predicted
Then broke a local key level
Of 2.1940 which is now a
Support so we are bullish biased
And after the retest of the new
Support we will be expecting a
Local bullish rebound
LONG🚀
✅Like and subscribe to never miss a new idea!✅

LONG TERM ANALYSIS ON GBP/NZDGBP/NZD 1W - As you can see from the above illustration I believe price will continue this bullishness trading us up and into the Supply Zone marked out above, from there we may see price reverse.
In order for us to deem a valid entry to short this market, we will need to see price break structure to the downside once it trades into the Supply Zone. This will confirm that enough Supply has been introduced to flip the markets balance.
Until then we can absolutely look to take this market long, having that area of Supply as our TP target, all we need to do is look for more fractal areas of Demand to buy into this market from.
These areas of Demand will be seen as fair value gaps that need clearing or Order Blocks, price will pullback into these to clear liquidity and introduce more Demand to encourage price to trade higher.

An overview of GBPNZDOn the 4-hour timeframe, the pair is trending downward after breaking the neckline near 2.19432. This level, which has since turned into a resistance zone, was recently retested.
Despite the last bullish candle closing strongly, signaling potential upside strength, sellers may still regain control, driving the price down toward 2.18404, with a further drop possibly extending to the demand zone around 2.17220.
On the flip side, if bullish momentum holds, analysts anticipate a push to retest the 2.19432 resistance, with further targets at 2.20464 and a potential rally toward the supply zone near 2.21645. Breakouts and retracements at these key levels remain possible scenarios.
Upcoming Catalyst
On Thursday (GMT+4):
6:00 AM: The spotlight would be on the NZD with the release of inflation expectations an indicator that could stir market volatility for Kiwi pairs and it is expected to affect GBPNZD too, then by 11:00 AM, The UK steps into the spotlight with crucial GDP data, both month-over-month and quarter-over-quarter, set to hit the wire. Expect traders to closely monitor these figures for clues on the health of the British economy.

GBPNZD has correction wave 2 started yet?GBPNZD is lagging behind EURNZD It has just finished wave 5 of lower degree and now it is pushing up for a corrective wave 2. For the current price action am expecting a pullback for wave B before continuation to the upside to finish up wave 2 of higher degree.

11-2 GBPNZD 11-2 GBPNZD : Trend signal received from this pair which has been given a Score of -2, made up of: Cot Data 0, Retail sentiment 0, Seasonality 1, Trend reading -1, GDP 0, Manufacturing PMI 0, Services PMI -1, Retail Sales -2, Inflation -2 Employment Change 2 Unemployment Rate 0. Interest Rates 1. Sell entered at 2.18145. Tp at 2.160

potential small repricing if Mann came out slight hawkfair value deviation
supportive flows shud be here the further it dips
at least for the day
potential small repricing if Mann came out slight hawk
reprice pre-Mann also possible
for intraday shorters, begin to look for hedges
information created and published doesn't constitute investment advice!
NOT financial advice

GBP/NZD: Bearish Outlook Confirmed by Head and ShouldersThe GBP/NZD exchange rate at NZ$2.1922 reflects a persistent downtrend, confirming recent weakness in the British Pound against major counterparts. The formation of a head and shoulders pattern on the daily chart suggests further downside risk, with the pair testing key support levels. Market fluctuations between NZ$2.1754 and NZ$2.22 highlight ongoing volatility driven by external economic factors, including U.S. tariffs and mixed macroeconomic data from both the UK and New Zealand. The Pound remains under pressure due to inflation concerns and lackluster GDP growth, while the NZD struggles to capitalize on the Pound’s weakness amid subdued domestic data. The technical setup and broader macroeconomic landscape signal a potential continuation of bearish momentum for GBP/NZD.

Correction aheadGBPNZD has a very high likelihood to shift momentum in the coming hours
Not financial advice

GBPNZDThe GBPNZD has shown a strong bearish pattern on the 4 hour chart. There is a small trading range indicating an exhausted market, with the resistance being broken.

GBP/NZD Double Bottom & Divergence Hint Bullish ReversalThe GBPNZD pair, previously entrenched in a bearish trend, has exhibited signs of weakening downward momentum, marked by the emergence of bullish divergence. A decisive break above the prior lower high (LH) could signal a potential trend reversal, shifting the bias toward bullish territory. This view is further reinforced by the formation of a double-bottom pattern, a technical structure often indicative of exhaustion in selling pressure and a foundation for upward price action. Traders may monitor these developments for confirmation of a bullish reversal.

GBPNZD Looks Bearish & is Expected to Drop FurtherGBPNZD looks bearish and is expected to drop further. There is a Minor Support level that might slow the fall, but if the price breaks below it, the chances of a bigger drop will increase. Traders should watch this level closely, as breaking it could lead to more selling and push the price lower.

GBP_NZD GROWTH AHEAD|LONG|
✅GBP_NZD is falling down
But there is a strong rising
Support line below so after
The pair hits the support
We will be expecting a
Bullish rebound and a move up
LONG🚀
✅Like and subscribe to never miss a new idea!✅

GBPNZD 10/02/2025Weekly:
-Weekly highs.
-Impulse and correction pattern.
-Bearish weekly candle.
Daily:
-H&S pattern.
-IC.
4H:
-Bearish W pattern.
-H&S pattern.
-IC.

GPB/NZD "Pound vs kiwi" Forex Market Bullish Heist Plan🌟Hi! Hola! Ola! Bonjour! Hallo!🌟
Dear Money Makers & Robbers, 🤑 💰
Based on 🔥Thief Trading style technical and fundamental analysis🔥, here is our master plan to heist the GPB/NZD "Pound vs kiwi" Forex market. Please adhere to the strategy I've outlined in the chart, which emphasizes long entry. Our aim is the high-risk Red Zone. Risky level, overbought market, consolidation, trend reversal, trap at the level where traders and bearish robbers are stronger. 🏆💸Be wealthy and safe trade.💪🏆🎉
Entry 📈 : "The heist is on! Wait for the breakout (2.20800) then make your move - Bullish profits await!"
however I advise placing Buy limit orders within a 15 or 30 minute timeframe. Entry from the most recent or closest low or high level should be in retest.
Stop Loss 🛑: Using the 4H period, the recent / nearest low or high level.
Goal 🎯: 2.25000 (or) Escape Before the Target
Scalpers, take note 👀 : only scalp on the Long side. If you have a lot of money, you can go straight away; if not, you can join swing traders and carry out the robbery plan. Use trailing SL to safeguard your money 💰.
📰🗞️Fundamental, Macro, COT, Sentimental Outlook:
The GBP/NZD pair is currently exhibiting a bullish trend, driven by a combination of fundamental, macroeconomic, and sentimental factors.
🔱Fundamental Analysis:
The British Pound has been gaining strength due to the UK's robust economic indicators, while the New Zealand Dollar has been under pressure due to the country's trade balance and inflation concerns
🔱Macroeconomic Overview:
The Bank of England's (BoE) monetary policy decisions and the UK's economic growth are expected to support the British Pound. In contrast, the Reserve Bank of New Zealand's (RBNZ) interest rate decisions and New Zealand's economic growth may impact the New Zealand Dollar
🔱COT (Commitment of Traders) Report:
The latest COT report shows that speculative traders are bearish on the New Zealand Dollar, with a significant increase in short positions, suggesting a potential rise in the GBP/NZD pair
🔱Sentimental Outlook:
Market sentiment for the GBP/NZD pair is currently bullish, with 60% of traders expecting the pair to rise. The pair's technical levels, such as the 50-day and 200-day moving averages, are also indicating a bullish trend
🔱Positioning:
Institutional traders are positioning themselves for a potential rise in the GBP/NZD pair, with some expecting a target of 2.25000. Retail traders are also bullish on the pair, with many expecting a continuation of the uptrend
⚠️Trading Alert : News Releases and Position Management 📰 🗞️ 🚫🚏
As a reminder, news releases can have a significant impact on market prices and volatility. To minimize potential losses and protect your running positions,
we recommend the following:
Avoid taking new trades during news releases
Use trailing stop-loss orders to protect your running positions and lock in profits
📌Please note that this is a general analysis and not personalized investment advice. It's essential to consider your own risk tolerance and market analysis before making any investment decisions.
📌Keep in mind that these factors can change rapidly, and it's essential to stay up-to-date with market developments and adjust your analysis accordingly.
💖Supporting our robbery plan will enable us to effortlessly make and steal money 💰💵 Tell your friends, Colleagues and family to follow, like, and share. Boost the strength of our robbery team. Every day in this market make money with ease by using the Thief Trading Style.🏆💪🤝❤️🎉🚀
I'll see you soon with another heist plan, so stay tuned 🤗

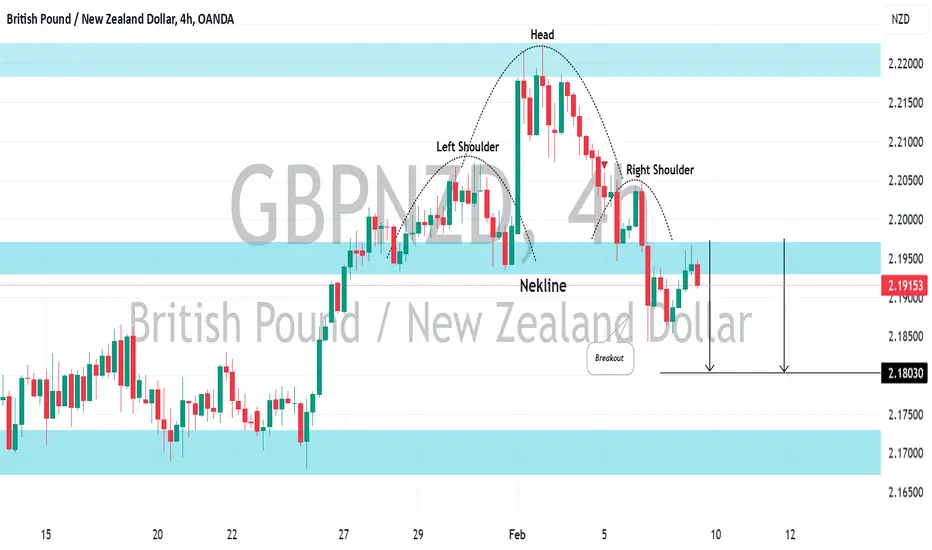
GBPNZD: Explanation of the Bearish PatternGBPNZD recently reached a key resistance level and formed a head and shoulders pattern.
Last week, the price broke below the neckline and is now retesting it, showing a strong bearish response.
Selling pressure seems to be building, suggesting a potential downward move soon.
The target for this decline is around 2.1803.

Gbpnzd super bullish Gbpnzd is super bullish on the weekly timeframe, price broke out of a major resistance zone, gave tripple bottom, broke out and retested it with nice bullish candlestick confirmation candle.

GBN/NZD Elliot waves update: Is wave B forming a triangle?GBP/NZD has completed a leading diagonal for Wave A, signaling a potential corrective structure. Wave B appears to be unfolding as a triangle, suggesting a continuation pattern before Wave C develops. Traders should watch for confirmation of the triangle breakout for the next move. Stay prepared for potential trading opportunities #elliotwavesglobal


GBPNZD: Bearish Pattern ExplainedGBPNZD recently hit a significant level of resistance and then formed a head and shoulders pattern.
The neckline of this pattern was broken last week and the price is now retesting it and we're seeing a positive bearish reaction.
It appears that selling pressure is accumulating, indicating a potential bearish move in the near future.
The target for this move is around 2.1803.