GBPNZD: Bearish Continuation Setup in FocusI’m closely monitoring GBPNZD as price tests this current region. Here’s the plan:
The Setup
Price is hovering near a key area of interest around 2.15485–2.15781.
I’m observing how price reacts here to determine if bearish momentum will continue.
If sellers remain strong, I’m looking for a further push down toward the green level at 2.13336, which is my target zone.
The Plan
1️⃣ I’ll wait to see if price respects this resistance zone or shows rejection, confirming that sellers remain in control.
2️⃣ My stop loss will be placed strategically above the resistance zone to manage risk effectively.
3️⃣ The goal is to capitalize on a bearish continuation toward the green support line at 2.13336.
Why This Makes Sense
This area has previously acted as a significant turning point for price. If resistance holds, it sets up a clean move toward the next major support zone, offering a strong risk-to-reward opportunity.
Mindset Tip:
"It’s not about guessing the market’s next move—it’s about reacting to what it shows you. Stay patient, and let the levels do the talking."
GBPNZD trade ideas

GBPNZDWe can attempt to short GBPNZD from specified level as it make LH , also 0.618 FIB level intact indicate that it moves downward.
SL , TP mention in chart

GBP/NZD Simple Short Setup.GBPNZD has drifted lower on continue GBP weakness.
Rising back to the upside of the current newly formed downtrend we can see early rejection of longs occurring.
On a day with little news, we may see further price drifts before continuation.

GBPNZD - Will the pound continue to rise?!The GBPNZD currency pair is located between the EMA200 and EMA50 in the 4H timeframe and is moving in its downward channel. In case of a downward correction, we can see the demand zone and buy this currency pair in that range with the appropriate risk reward. Breaking the ceiling of the descending channel will provide the way for this currency pair to rise to the specified resistance range.
Barclays Institute Remains Optimistic About the British Pound’s Growth Until 2025
Key highlights of the analysis are as follows:
• Strengthening ties between the UK and the European Union are expected to provide long-term support for the British economy and pound, boosting its positive outlook.
• The financial packages announced by the UK government, amounting to approximately 1% of GDP, have stimulated domestic demand and delayed the Bank of England’s (BoE) interest rate cut cycle.
• A critical uncertainty lies in whether higher labor costs will lead to inflationary pressures or a reduction in employment, both of which could impact supply.
• The UK’s trade deficit in goods with the United States indicates that, compared to the Eurozone, Britain is less exposed to the direct risks of potential US tariffs. This creates a favorable distinction for the pound over the euro.
Barclays predicts that the pound will maintain a positive trajectory through 2025, supported by fiscal resilience, limited exposure to tariff risks, and structural improvements in UK-EU relations. These factors position the pound for gains against both the dollar and the euro, though uncertainties related to labor costs remain a critical factor to monitor.
Remarks by Ramsden:
Ramsden, a member of the Bank of England, noted that wage growth is more likely to align closer to 2% rather than 4%. He highlighted that the economy is on track to return to normalcy, with inflation stabilizing at a low level and expected to continue this trend.
In the short term, inflation is anticipated to remain near the target, while in the long term, it could fall significantly below it. However, the impact of higher social insurance taxes on key economic indicators like prices, wages, and unemployment remains unclear.
New Zealand’s Economic Outlook:
Meanwhile, New Zealand’s Treasury has forecast a deeper economic downturn, which is placing greater pressure on tax revenues. According to Dominic Stephens, the Treasury’s chief economic advisor, the economic contraction has been sharper than expected, posing serious challenges for the government’s efforts to reduce its budget deficit.
Recent evidence suggests that economic and fiscal forecasts, set to be released on December 17, will likely be further downgraded. Data indicates that New Zealand consumers are spending less than they did last year, and businesses remain pessimistic about their economic prospects.

GBPNZD | BUY & SELLGBPNZD on daily buy trend but also H & S PATTERN appears.
on h4 price making trend continuation pattern also making double bottom that confirm our buy entry and as we know in double bottom price go up and them again down also we have reversal pattern on daily also it confirm our sell entry after buy..
enjoyyy/....


#GBPNZD 4HGBPNZD 4-Hour Analysis
The GBPNZD pair is trading within a downtrend channel on the 4-hour chart and is nearing the channel's lower support line. This support zone has historically provided opportunities for bullish reversals within the channel. Waiting for the price to touch this level ensures a safer entry for a potential buy position.
Technical Outlook:
- Pattern: Downtrend Channel Support
- Forecast: Bullish (Wait for Support Touch, Then Buy)
- Entry Strategy: Enter a buy position near the channel’s support line after confirmation of a reversal signal.
Traders should watch for confirmation through bullish candlestick patterns or indicators like RSI reflecting oversold conditions. Proper risk management is essential, with stop-loss orders placed below the support line to guard against a potential breakdown. Targets can be set at the midline or upper boundary of the channel for potential profit.

GBPNZD bearish expectations
GBPNZD price is make two strong bullish pushes from 4.Oct. currently DESCENDING CHANNEL visible, price is make bearish bounce on strong zone 2.16600.
Expecting this point now is exhaustion and expectations are to see higher bearish continuation from here
SUP zone: 2.17000
RES zone: 2.14700, 2.14100

GBP/NZD BULLS ARE STRONG HERE|LONG
Hello, Friends!
We are targeting the 0.978 level area with our long trade on GBP/NZD which is based on the fact that the pair is oversold on the BB band scale and is also approaching a support line below thus going us a good entry option.
✅LIKE AND COMMENT MY IDEAS✅


GBPNZD, Bearish ChannelBearish Channel
Towards new lows
Expected to touch channel Bottom
Sell @ CMP
stoploss at LH
target towards 1:1

GBPNZD Buy OpportunityKey Observations:
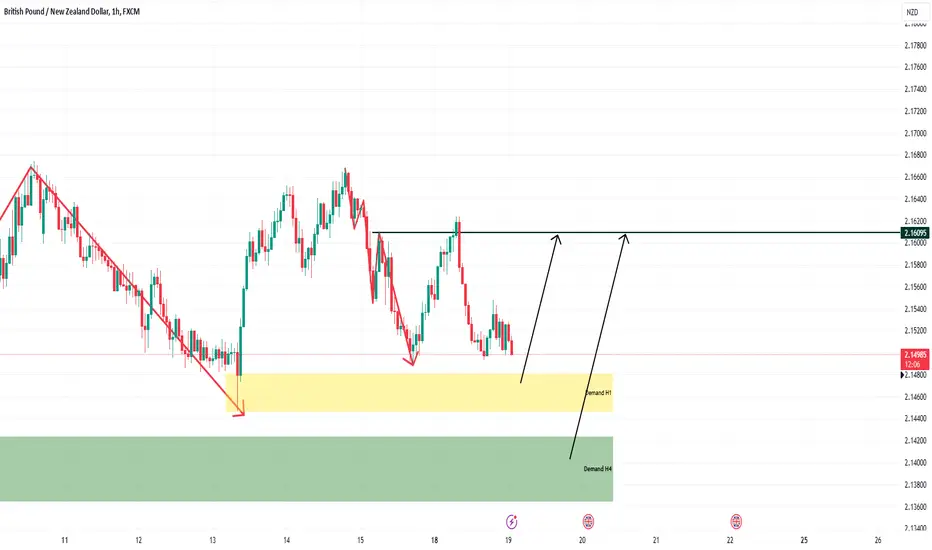
Demand Zones:
Yellow Zone (Demand H1): This area represents a short-term demand zone where price has previously reversed upwards.
Green Zone (Demand H4): This is a stronger demand zone from the 4-hour timeframe, indicating a higher likelihood of a bullish response if the price revisits this area.
Price Action:
The price shows a series of lower highs and lower lows, indicating a prior bearish trend.
A recent reversal from the yellow demand zone suggests some bullish momentum.
Potential Targets:
Two arrows pointing upwards indicate potential target areas around 2.16095, which may act as resistance.
Market Structure:
The downward red arrows mark previous bearish waves.
The upward move from the demand zone may signify a corrective or new bullish phase.
Analysis:
Bullish Outlook:
If the price sustains above the yellow demand zone, it could aim for the marked resistance level at 2.16095. A break above this level could signal further upside.
GBPNZD Pushing itself in a buy directionHello Traders
In This Chart GBPNZD 4 HOURLY Forex Forecast By FOREX PLANET
today GBPNZD analysis 👆
🟢This Chart includes GBPNZD market update)
🟢What is The Next Opportunity on EURNZD Market
🟢how to Enter to the Valid Entry With Assurance Profit
This CHART is For Trader's that Want to Improve Their Technical Analysis Skills and Their Trading By Understanding How To Analyze The Market Using Multiple Timeframes and Understanding The Bigger Picture on the Charts


GBPNZD: Weak Market & Bearish Forecast
Remember that we can not, and should not impose our will on the market but rather listen to its whims and make profit by following it. And thus shall be done today on the GBPNZD pair which is likely to be pushed down by the bears so we will sell!
❤️ Please, support our work with like & comment! ❤️

GBPNZD: Bullish Forecast & Bullish Scenario
The analysis of the GBPNZD chart clearly shows us that the pair is finally about to go up due to the rising pressure from the buyers.
❤️ Please, support our work with like & comment! ❤️

GBPNZDLooking for buys from the new demand that was created after taking out previous structure lows. But this is a slightly lower risk play

GBPNZD: Turning bearish if the 1D MA50 breaks.GBPNZD is neutral on its 1D technical outlook (RSI = 48.440, MACD = 0.004, ADX = 26.806), trading right over its 1D MA50. If broken, it will be the validation of the new bearish wave of the 1 year Channel Down. The 1D RSI is forming the very same Arc pattern as the May bearish wave. Upon validation, we will get short and aim for the 1D MA200, over the 0.786 Fibonacci level (TP = 2.12500).
## If you like our free content follow our profile to get more daily ideas. ##
## Comments and likes are greatly appreciated. ##


GBPNZD is BearishPrice is in a downtrend, and seems like that after a small retracement and testing the descending trendline it will continue its journey south. An evening doji star has also appeared further confirming bearish sentiments, moreover there is also a bearish divergence on hourly time frame indicating the control of bears. Targets are mentioned on the chart.

Lingrid | GBPNZD in CONSOLIDATION zoneFX:GBPNZD is currently ranging after a downward move, establishing a zone with defined resistance and support levels. The market is creating higher lows and lower highs, indicating it is moving sideways. Currently, the price is trending upward toward the channel following a false breakout of the support level. I anticipate a potential fake breakout of the previous resistance and the channel boundary. If the price rejects this zone by forming a rejection candle, such as a long-tailed bar, we can consider shorting the market. My goal is the support zone around 2.15170
Traders, if you liked this idea or if you have your own opinion about it, write in the comments. I will be glad 👩💻

GBPNZD 4hr LongGBPNZD
✅ 4hr Long ✅
💰ENTRY: 2.16190
👎STOP LOSS: 2.15729
TP TARGETS
⏰TP1
⏰TP2
⏰TP3
✅ 1. Weekly Time Frame: Price has been breaking bullish and trending above the 10, 50, 200 EMAs.
✅ 2. Daily Time Frame: Price has been breaking bullish and trending above the 10, 50, 200 EMAs.
✅ 3. 4hr Time Frame: Price has made a valid correction into the 10 EMA.
✅ 4. Price has made a Swing Low Engulfing candle above the 50ema.
This is a great example of my systematic system.

GBPNZD: Bullish Continuation & Long Trade
GBPNZD
- Classic bullish setup
- Our team expects bullish continuation
SUGGESTED TRADE:
Swing Trade
Long GBPNZD
Entry Point - 2.1473
Stop Loss - 2.1401
Take Profit - 2.1603
Our Risk - 1%
Start protection of your profits from lower levels
❤️ Please, support our work with like & comment! ❤️
