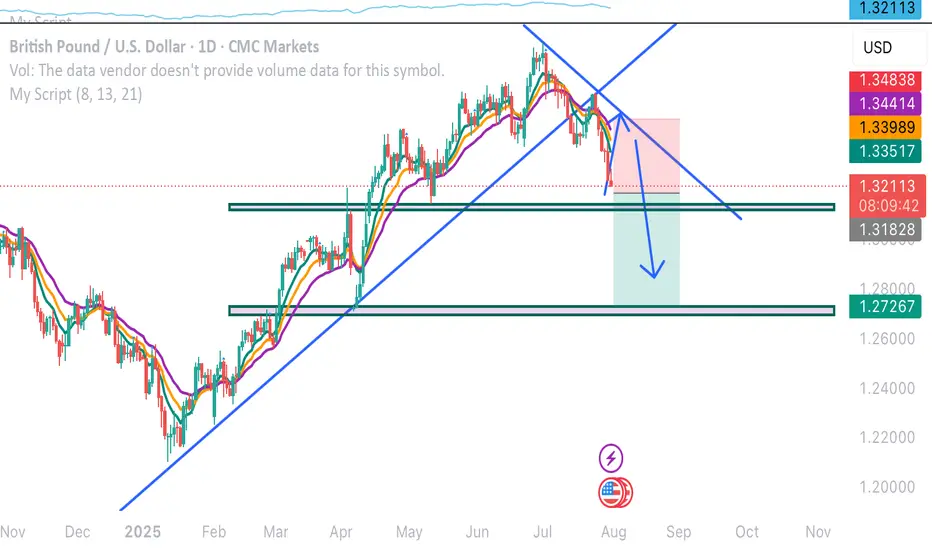
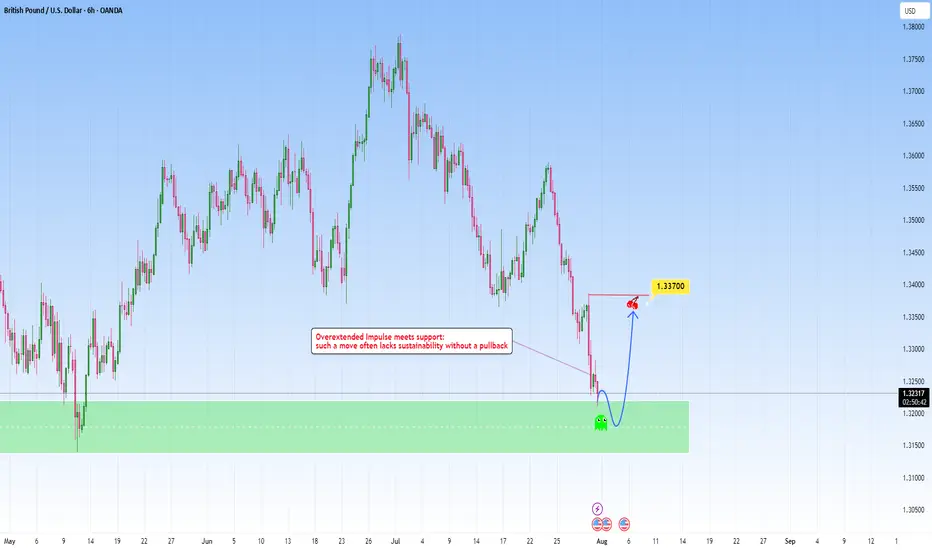
GBPUSD: Overextended move meets with supportAfter a steep and aggressive sell-off, price has tapped into a clear zone. This recent move wasn't gradual: it was impulsive and sharp, which tells us one key thing: exhaustion is likely.
The overextension into it without any meaningful pullback typically highlights imbalance, where price moves ahead of structure and becomes vulnerable to correction. But price doesn’t move in straight lines forever. Markets that fall too quickly tend to burn out just as fast. When such aggressive pushes meet with a clean, resistance like this one, they often trigger the exact opposite, a snapback correction.
I am now watching for signs of absorption and accumulation. This could play out in the form of sideways candles, wick rejections, or a sudden reversal spike. These are early signs that smart money might be stepping in.
My projected target would be toward the 1.33700 area, from the last impulsive drop. It’s a classic mean reversion setup, not just technical but psychological. Traders who chased the move late may find themselves trapped, fueling the correction as they’re forced to exit.
GBPUSD trade ideas
GBPUSD – Bearish Bounce Loading?Hello TradingView Family / Fellow Traders. This is Richard, also known as theSignalyst.
📈GBPUSD has been overall bearish trading within the falling channel marked in red and it is currently in a correction phase.
Moreover, the blue zone is a strong supply.
📚 As per my trading style:
As #GBPUSD approaches the red circle zone, I will be looking for bearish reversal setups (like a double top pattern, trendline break , and so on...)
📚 Always follow your trading plan regarding entry, risk management, and trade management.
Good luck!
All Strategies Are Good; If Managed Properly!
~Rich
Disclosure: I am part of Trade Nation's Influencer program and receive a monthly fee for using their TradingView charts in my analysis.

GBPUSD Technical Overview GBPUSD Technical Overview
GBPUSD recently peaked at 1.3790, aligning with a key historical resistance zone from October 2021. On the Daily Chart, this move completed a significant bearish pattern, suggesting the potential for further downside.
Over the last 7 trading sessions, the pair has declined nearly 400 pips, moving decisively lower.
Given the steep drop, a technical correction may be on the horizon before GBPUSD potentially resumes its bearish trajectory, as indicated by the current chart setup.
If NFP data can be strong today, GBPUSD could extend to the first target 1.3100 or 1.3000 as shown in the chart.
Overall, GBPUSD looks like it has started a downtrend.
Let's see how the price will unfolds.
You may find more details in the chart!
Thank you and Good Luck!
PS: Please support with a like or comment if you find this analysis useful for your trading day
Disclosure: I am part of Trade Nation's Influencer program and receive a monthly fee for using their TradingView charts in my analysis.

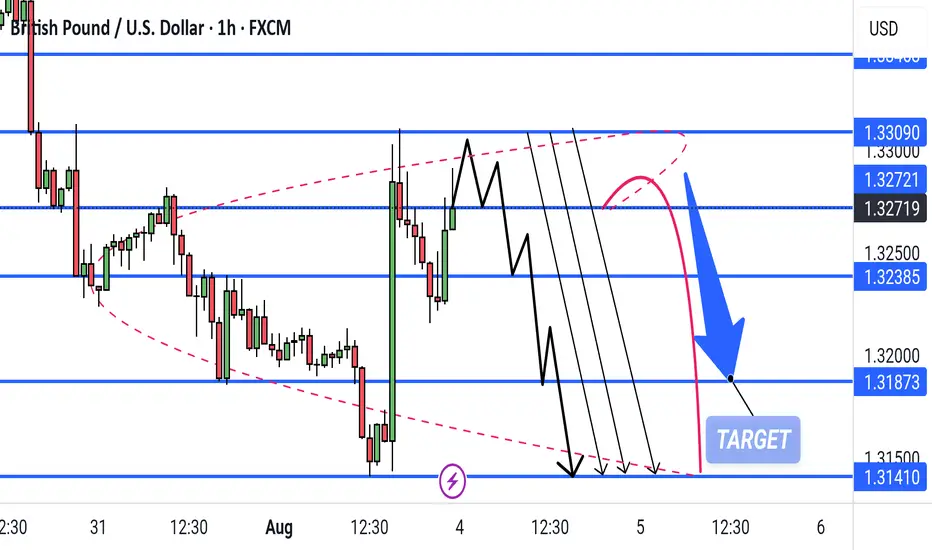
GBP/USD Bearish Wedge Breakdown Setup Targeting 1.31873This is a 1-hour GBP/USD chart showing a bearish setup. Price is currently at resistance (1.32719) within a rising wedge pattern. Multiple black arrows suggest potential bearish breakdown scenarios targeting 1.31873, with a deeper drop possible toward 1.31410. The red path indicates a less likely bullish fakeout before reversal.
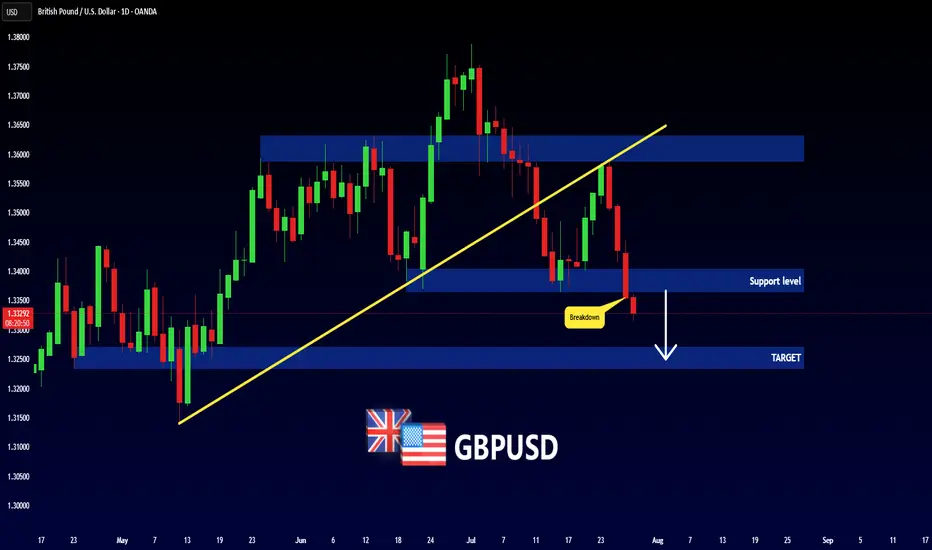
GBPUSD - NEW BREAKDOWN !Hello Traders !
The GBPUSD broke the support level (1.34037 - 1.33650).
This key level becomes new resistance!
So, I expect a bearish move📉
_______________
TARGET: 1.32710🎯
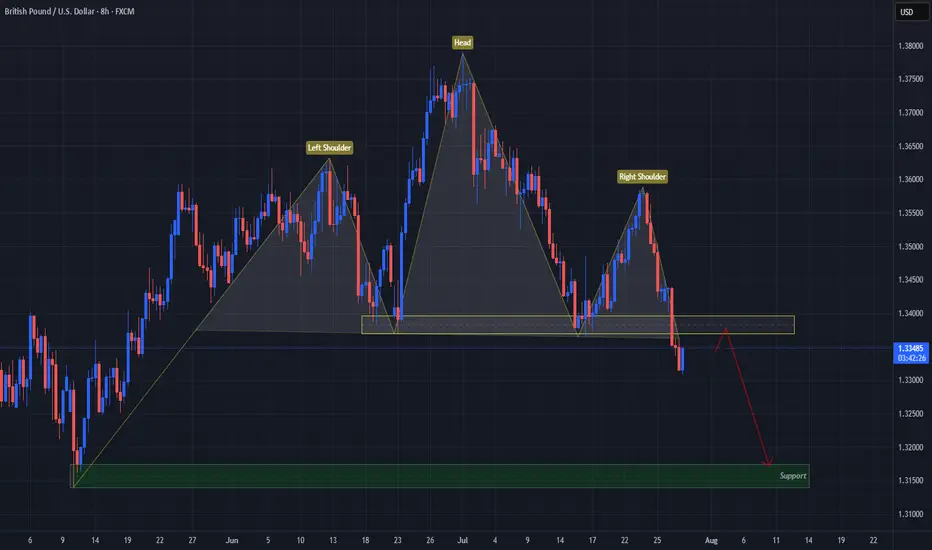
USD Turns GBP On Its "Head"FX:GBPUSD has formed a Head & Shoulders Pattern!
Price has already broken down below the "Neckline" to Confirm that Pattern.
Currently, Price is working its way back up to retest the Breakout and if the level is strong enough and holds, we could see Price follow through with its reversal to lower prices!
If the retest is successful, the May 12th Lows of 1.31741 - 1.31394 could be a good Support level to set as a Price Target.
Now we wait for a Retest!
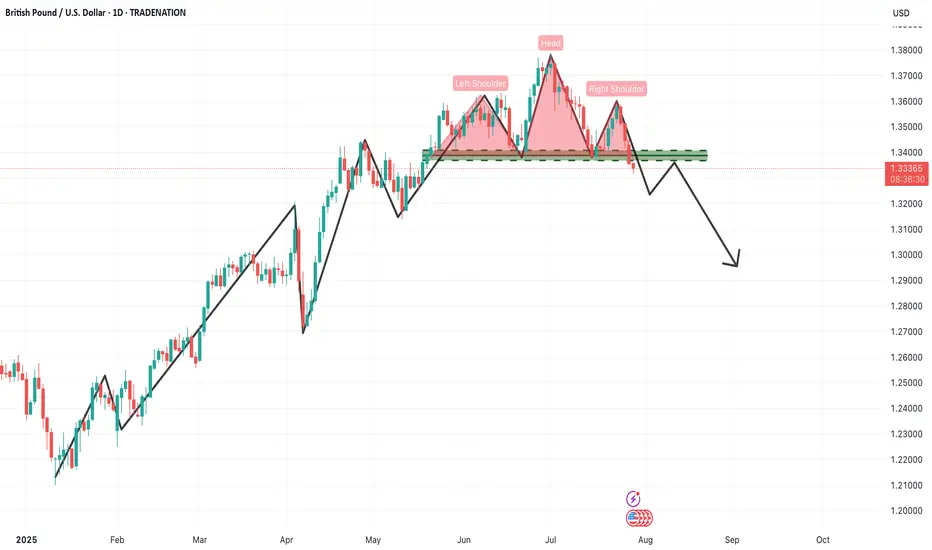
GBPUSD – Daily Timeframe Analysis: Head & Shoulders PatternThe GBPUSD daily chart is currently presenting a textbook Head & Shoulders reversal pattern, a powerful bearish signal that often marks the end of an uptrend and the beginning of a new downward cycle. This setup demands attention from swing and positional traders alike, especially considering the size and clarity of the structure.
🔍 Pattern Breakdown
Left Shoulder: Formed in late May, establishing a significant high before a corrective move.
Head: A higher peak was made in early June, which now stands as the pattern's highest point.
Right Shoulder: A lower high formed in mid-July, indicating weakening bullish momentum.
Neckline: The crucial horizontal support zone around 1.3330–1.3340 was tested multiple times and has now been decisively broken, triggering a confirmed bearish setup.
📊 Technical Significance
This Head & Shoulders pattern becomes especially meaningful due to:
Multiple rejections at the neckline, confirming its strength as support-turned-resistance.
Bearish volume expansion on the breakdown, adding weight to the selling pressure.
Formation on a daily timeframe, suggesting a long-term trend reversal rather than a short-term pullback.
📌 Trading Strategy for Traders
✅ Sell Setup (Short Position)
Entry: Around the neckline zone on retest (1.3320–1.3340)
Stop Loss: Above the right shoulder (~1.3550)
Targets:
🎯 Target 1: 1.3100 (psychological and horizontal support)
🎯 Target 2: 1.2900 (measured move from head to neckline)
🎯 Target 3: 1.2650–1.2600 (extended downside zone based on structure)
⚠️ Risk Management Tips:
Don’t chase the breakdown — wait for a pullback/retest of the neckline to get a better risk/reward entry.
Ensure position sizing is appropriate based on the stop loss distance.
If price reclaims the neckline with strong bullish momentum and closes above 1.3350, exit short and reevaluate.
🧠 What Traders Should Keep in Mind
Macro Fundamentals: Watch upcoming economic events like BoE rate decisions, US NFP, and inflation data, which can cause volatility and impact the technical scenario.
Dollar Index (DXY) trend should also be monitored closely. If DXY rallies, GBPUSD breakdown can accelerate.
Trendline Confirmation: Align this with any break of rising trendlines drawn from previous lows.
📌 Final Thought
This pattern marks a crucial turning point in GBPUSD. The momentum has clearly shifted from buyers to sellers, and the breakdown opens up significant downside room. As a swing or position trader, this is a high-probability setup with a clear invalidation point (above the right shoulder) and a favorable risk-reward ratio.
📉 Patience and precision are key here. Let price come to you at the neckline, confirm rejection, and then take the trade with confidence.
=================================================================
Disclosure: I am part of Trade Nation's Influencer program and receive a monthly fee for using their TradingView charts in my analysis.
=================================================================
GBPUSD Setup GBP/USD is forming a bullish channel on the 30-minute chart. Price is expected to break above resistance near 1.3365, targeting the 1.3455 zone. Stop loss is set below the channel at 1.3312.

GBP/USD 4H Chart – Head and Shoulders Breakdown with Bearish Currency Pair: GBP/USD (British Pound vs US Dollar)
Timeframe: 4-Hour (4H)
Platform: TradingView
---
🔍 Pattern Identified:
Head and Shoulders Pattern
Left Shoulder, Head, and Right Shoulder are marked.
The neckline is broken, confirming a bearish trend reversal.
The trendline from March to June was also broken, supporting a downtrend.
---
📍 Current Price (at screenshot time):
Around 1.32778
---
🎯 Sell Setup – Target Levels:
🔻 First Target:
Price: 1.30072
Labelled: "1st TARGET POINT"
This is a near-term support level or conservative projection of the Head and Shoulders move.
🔻 Second Target:
Price: 1.28023
Labelled: "2nd TARGET POINT"
This is a deeper target, likely the full measured move of the pattern.
---
📈 Entry & Risk Management:
Suggested Sell Entry Zone: Around 1.32778
Stop-Loss (SL): Consider placing above the Right Shoulder area (around 1.3350–1.3380)
Take-Profit (TP):
TP1: 1.30072
TP2: 1.2802

GBPUSD shows signs of a potential recoveryGBPUSD shows signs of a potential recovery towards the resistance zone. This price action indicates a possible short-term reversal or consolidation phase. We are currently observing for confirmation signals such as:
These could signal a build-up for a move back toward the key resistance at 1.34400. Traders should stay alert for price behaviour near this level as it may act as a turning point or breakout trigger.
You may find more details in the chart.
Trade wisely best of luck buddies.
Ps: Support with like and comments like for better analysis.

GBP/USD pair on a 4H timeframMy analyzing the GBP/USD pair on a 4H timeframe using the Ichimoku Cloud and Volume Profile (Visible Range), along with marked support and resistance zones. From this image, I can guide you with a target price level, but you'll need to validate with price action confirmation.
Observations:
1. Ichimoku Cloud (Kumo):
Price is currently trading above the cloud, indicating a bullish bias.
However, the cloud ahead is thin and flat, suggesting weak support if a pullback happens.

GBP/USD Bearish Breakdown with Downside PotentialThe GBPUSD chart indicates a bearish trend, with price breaking below a key ascending support line. This breakdown suggests a shift in momentum, favoring sellers. The price is currently trading below the Ichimoku cloud, which reinforces the bearish bias. A pullback to the broken support zone may offer a retest before further decline. The structure points toward lower lows, and the chart outlines two potential support levels where price may react. Continued downside is expected if the current resistance zone holds. Bearish continuation appears likely as long as price remains below the recent high and beneath the cloud.
Entry Sell: 1.33360
First Target point: 1.32250
Second Target point: 1.30000
If you found this analysis helpful, don’t forget to drop a like and comment. Your support keeps quality ideas flowing—let’s grow and win together! 💪📈

GBPUSD: The Bears Have it! Sell it!Welcome back to the Weekly Forex Forecast for the week of Aug 4 - 8th.
In this video, we will analyze the following FX market:
GBPUSD
Even against a weakened USD, the GBP is weaker.
July ended with an aggressive bearish candle. August may see more of the same.
Then there is talk of interest rate cuts coming.....
Enjoy!
May profits be upon you.
Leave any questions or comments in the comment section.
I appreciate any feedback from my viewers!
Like and/or subscribe if you want more accurate analysis.
Thank you so much!
Disclaimer:
I do not provide personal investment advice and I am not a qualified licensed investment advisor.
All information found here, including any ideas, opinions, views, predictions, forecasts, commentaries, suggestions, expressed or implied herein, are for informational, entertainment or educational purposes only and should not be construed as personal investment advice. While the information provided is believed to be accurate, it may include errors or inaccuracies.
I will not and cannot be held liable for any actions you take as a result of anything you read here.
Conduct your own due diligence, or consult a licensed financial advisor or broker before making any and all investment decisions. Any investments, trades, speculations, or decisions made on the basis of any information found on this channel, expressed or implied herein, are committed at your own risk, financial or otherwise.

DeGRAM | GBPUSD is forming the falling wedge📊 Technical Analysis
● GBPUSD is attempting a reversal from the lower boundary of a descending channel after forming a short-term double-bottom near 1.3138.
● Price is now climbing toward 1.3258 resistance, supported by bullish divergence and a break of the local falling wedge.
💡 Fundamental Analysis
● The USD is under pressure ahead of key NFP data, as ISM manufacturing misses weighed on Treasury yields.
● Positive UK PMI and consumer lending data have supported GBP, with BoE policy expectations firming above neutral.
✨ Summary
Long bias above 1.3138. Breakout targets 1.3258 ➜ 1.3423. Setup valid while price holds above 1.3110 support.
-------------------
Share your opinion in the comments and support the idea with a like. Thanks for your support!

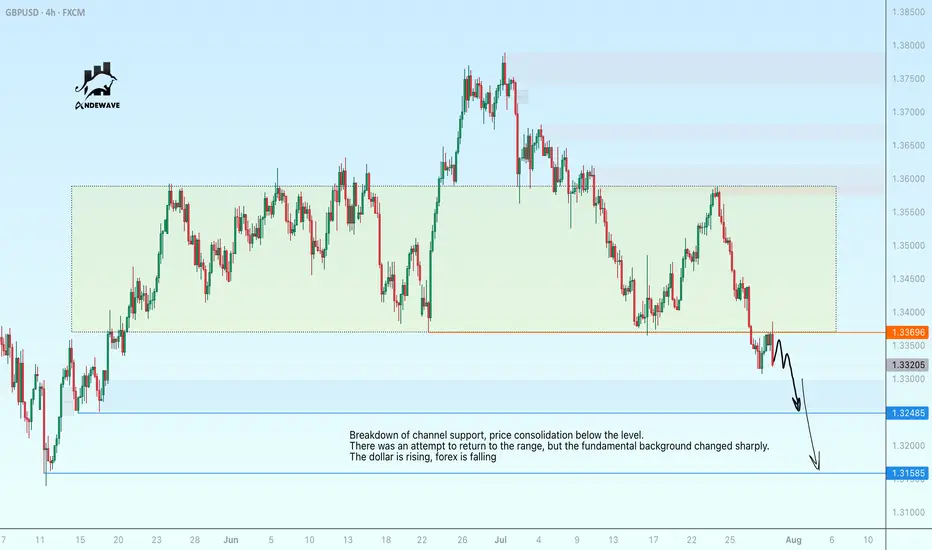
GBPUSD has consolidated in the selling zoneBreakdown of channel support, price consolidation below the level. There was an attempt to return to the range, but the fundamental background changed sharply. The dollar is rising, forex is falling.
GBPUSD may continue its local decline to 1.3158.
#GBPUSD: Pullback Trade Confirmed?!📈GBPUSD rebounded from the highlighted key support level,
As a confirmation signal i observed a strong bullish Change of Character (CHoCH) on the 4-hour timeframe following its test.
The target is set at 1.3350.

GBP/USD: Sell setup shaping upHey everyone, what’s your take on GBP/USD right now?
After breaking below the trendline, GBP/USD tried to retest the area but failed to hold. Price is now hovering around 1.329, and the selling pressure is still clearly present.
This current setup is aiming toward the Fibonacci 1.618 extension zone around 1.287. In the short term, a pullback could play out based on Dow Theory, and the highlighted zone might offer a prime shorting opportunity.
My bias: SELL on the retest — with tight risk management, clear TP and SL in place.
Now it’s your turn — what’s your outlook? Drop your thoughts in the comments below.
Good luck and trade smart! 💼📉

GBPUSD I Its ready for the deeper pullback - COT OverviewHey what up traders welcome to the COT data and Liquidity report. It's always good to go with those who move the market here is what I see in their cards. I share my COT - order flow views every weekend.
🎯 Non Commercials added significant longs and closed shorts at the same time. So for that reason I see the highs as a liquidity for their longs profits taking.
📍Please be aware that institutions report data to the SEC on Tuesdays and data are reported on Fridays - so again we as retail traders have disadvantage, but there is possibility to read between the lines. Remember in the report is what they want you to see, that's why mostly price reverse on Wednesday after the report so their cards are hidden as long as possible. However if the trend is running you can read it and use for your advantage.
💊 Tip
if the level has confluence with the high volume on COT it can be strong support / Resistance.
👍 Hit like if you find this analysis helpful, and don't hesitate to comment with your opinions, charts or any questions.
Analysis done on the Tradenation Charts
Disclosure: I am part of Trade Nation's Influencer program and receive a monthly fee for using their TradingView charts in my analysis.
"Adapt what is useful, reject what is useless, and add what is specifically your own."
— David Perk aka Dave FX Hunter ⚔️

DeGRAM | GBPUSD reached the lower boundary of the channel📊 Technical Analysis
● GBPUSD has broken out of a falling wedge within a descending channel, reclaiming the lower boundary of the broader structure.
● Price is consolidating just above 1.33160 support and appears ready to retest the 1.34650 resistance, aided by a series of higher lows and a bullish break of short-term trendlines.
💡 Fundamental Analysis
● Weakening USD sentiment continues after Friday’s softer core PCE and downward revision of Michigan inflation expectations.
● UK economic sentiment improved after recent wage growth and mortgage approval data exceeded forecasts, bolstering GBP.
✨ Summary
Breakout from wedge confirms bullish bias. Support at 1.33160; target 1.34650 short-term. Watch for rally continuation while holding above 1.33625.
-------------------
Share your opinion in the comments and support the idea with a like. Thanks for your support!

GBPUSD slipping fast – Is 1.30 the next magnet?Hey traders, what’s your take on GBPUSD today?
Overall, the pair is deepening its bearish trend after losing the key 1.3400 level. At the time of writing, GBPUSD is hovering around 1.3272 with no signs of a short-term bottom in sight.
The main catalyst for this drop is the strong bullish momentum of the U.S. dollar. A series of upbeat U.S. economic data – including jobs reports, personal consumption expenditures (PCE), and consumer confidence – all exceeded expectations, fueling USD strength. Meanwhile, the Bank of England (BoE) remains cautious amid slowing growth and cooling inflation, offering little support for the pound.
From a technical perspective, momentum has clearly shifted in favor of the bears. Price remains pressured below both the 34 and 89 EMAs, confirming strong downside momentum. The previous break below the rising trendline and failure to hold above the prior support zone – around the 0.5–0.618 Fibonacci retracement – further supports the ongoing bearish bias.
Looking ahead, if the selling pressure continues and the current support gives way, GBPUSD could fall toward the 1.272 Fibonacci extension at 1.3129. If that level fails to hold, 1.3004 (Fibo 1.618) becomes the next key downside target. These are crucial zones to monitor for potential price reactions in the coming sessions.
In short, the probability of further downside is higher than a meaningful recovery. With both technical and macro forces favoring the bears, GBPUSD may remain under pressure in the days ahead – unless a strong catalyst from the UK emerges to shift sentiment. What’s your outlook on this scenario? Let’s discuss in the comments below!

GBPUSD FORMS HEAD & SHOULDER PATTERN IN 1D TIME FRAME CHARTGBP/USD Forms Head and Shoulders Pattern - Bearish Breakdown Expected
The GBP/USD currency pair has developed a clear Head and Shoulders (H&S) reversal pattern on the 1-DAY chart, signaling potential weakness ahead. This technical formation - characterized by a central peak (head) flanked by two lower highs (shoulders) - suggests the recent uptrend may be exhausting as sellers gain control.
Current Market Structure
Price action remains confined within a bearish framework, making consistent lower highs and lower lows since failing at the pattern's right shoulder. The pair now tests critical support near the neckline of the H&S formation. A confirmed break below this level would validate the pattern and likely accelerate downward momentum.
Key Levels to Watch
- *Downside Target*: 1.27300 emerges as the next major support if bearish momentum sustains
- Resistance Zone: The 1.37900 level now acts as formidable overhead resistance
- Neckline Break: A daily close below current support would confirm the H&S pattern
Trading Implications
The technical setup favors:
1) Maintaining short positions while price holds below the right shoulder high
2) Watching for increased volume on breakdown moves to confirm bearish conviction
3) Considering long positions only if buyers reclaim 1.37900 resistance
Risk Factors
Traders should monitor:
- UK inflation data and BoE policy signals
- Fed interest rate expectations
- General USD strength across currency markets
This pattern projects approximately 900 pips of potential downside if fully realized. However, traders should wait for confirmed breakout momentum rather than anticipating the move, as false breakdowns remain possible in current market conditions. Proper position sizing and stop-loss placement above recent swing highs remains essential for risk management.
Note: Forex trading involves substantial risk. Always conduct your own analysis before entering positions.

GBPUSD BUY TIGER SETUP LOOOOOOOOOOOONGwelcome
we have strong mitigation order block on time frame weekly and daily
and on 4H we have break downtrend and retest on it
and we in well discount area
and we have demand on high time frame
so this is good idea for buying
Don't forget to follow me
so that get refresh analysis

GBPUSD OUTLOOKHey traders what’s your take on this ? If it breaks the that zone, expect a bearish continuation