Liquidity in Trading: The Basics You Must Understand👉 If you can’t identify liquidity, you become the liquidity.
It's not an indicator, It's not a pattern. It's not a theory.
It's how the markets actually move.
Every trader has seen it happen: you take a position at the “obvious” level, only to get stopped out by a quick wick — and then the market runs exactly where you expected. That wasn’t bad luck. That was liquidity.
In this post, you’ll learn few main forms of liquidity that move markets and how to avoid being stop hunted and actually use such a phenomena for your advantage.
Don't be a liquidity
Price doesn’t move randomly inside ranges. It hunts liquidity at the edges.
• Retail trap: Traders pile orders right at the range high/low.
• Smart money: Hunt's edges of range before starting the move.
Wait for the sweep of those levels. The stop runs happen first, the real move comes after.
⚠️ If a pivot level gets tapped multiple times, it's on purpose. Smart money are creating illusion of strong support / Resistance.
Les informed traders trades patterns like : Double bottom, Double top and they put the stop losses above the range - This creates a Liquidity cluster which smart money needs to execute their orders. They will come for it before the real move happen.
How to enter continuation
Even in strong trends, price doesn’t move in straight lines.
• Consolidation → Expansion: Liquidity builds during pullbacks or sideways pauses, then gets released in a sharp move.
• Retracement → Expansion: don’t chase the first pullback. Wait for at least 50% pullbacks. Not earlier. Best setup is when it has all like the one below.
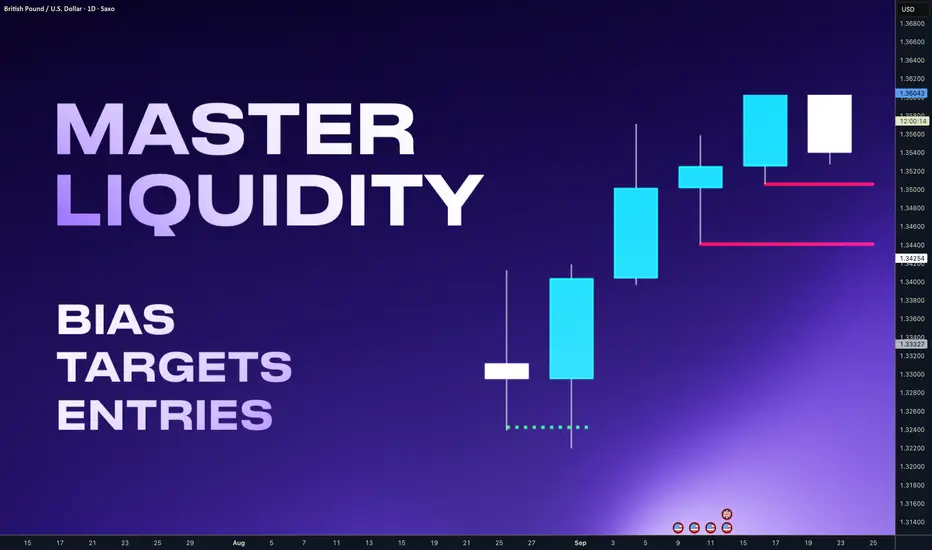
Double top as liquidity, range, 50% pullback , stop hunt
• Double tops and Triple tops are engendered liquidity if you see it expect price go thru that levels
The win isn’t catching the exact bottom. It’s catching a clean entry with strong Trend continuation - low timeframe reversal and with right timeframe allignements.
So here is again GBPUSD example where we had the weekly range, stop hunt to 50% of the swing.
After stop hunt occurs you wait for. H4 OB being created in other words engulf of last bulky down candle and clean close above. Then you can enter with SL below the stop hunted lows, not only that traders was liquidated there but also another group of traders entered shorts and they will be now liquidated above that double top and its your target.
Importance of key level
Even when smart money moves price to the highs where it seems there is not key level always look left price mostly stop just right above or below the key level. Ranges for some time makes false move in the direction which sucks traders in to to a trade and then they hit key level and go that direction.
If the move is not going from key level it's a trap. We can use many types of levels, but here is a tip for the forex Whole, quarter, half levels are strong. If your order block, supply / demand occurs or classic support occurs around that level it will have higher probability and its not because of psychological level. It's because these levels are what institutions are trading.
Stop hunts are not your enemy — unless you ignore it. The market makers hunts liquidity before it moves. By starting thinking about the markets this was way you will recognize and will be able to visualize future movements.
Summary
Big challenge is waiting patiently for the stop hunt to happen. And yes sometimes price moves without a stop hunt and you will miss a move. But it's always better not to be in a trade you want to be than being In trade you dont want to be.
Shift from being the exit liquidity to being the trader who patiently waits, confirms, and executes with precision.
🩸 Spot the trap. 🩸 Wait for the sweep. 🩸 Trade with intention.
Dont trust me and fact check this on your chart for your confidence. It's only way to start to see markets differently.
David Perk aka Dave FX Hunter
GBPUSD trade ideas
GBP/USD - Breakout (US - CPI Data) (11.09.2025)The GBP/USD Pair on the M30 timeframe presents a Potential Selling Opportunity due to a recent Formation of a Breakout Pattern.
This suggests a shift in momentum towards the downside in the coming hours.
Possible Short Trade:
Entry: Consider Entering A Short Position around Trendline Of The Pattern.
Target Levels:
1st Support – 1.3475
2nd Support – 1.3441
🎁 Please hit the like button and
🎁 Leave a comment to support for My Post !
Your likes and comments are incredibly motivating and will encourage me to share more analysis with you.

GBPUSD Pullback Toward 1.34800 as Dollar Struggles on Soft DataHey Traders, in today's trading session we are monitoring GBPUSD for a buying opportunity around the 1.34800 zone. The pair is trading in an uptrend, with price currently in a correction phase as it approaches this key support/resistance level.
Structure: The broader bias remains bullish, though price is retracing after recent highs.
Key level in focus: 1.34800 — a significant area where buyers may look to re-enter in line with the trend.
Fundamentals: The U.S. Dollar Index (DXY) is approaching 97.850 resistance while struggling to push higher following a series of softer data releases. Most notably, the recent soft CPI print has increased expectations for potential rate cuts, keeping pressure on the dollar and supporting GBPUSD’s upside outlook.
Trade safe,
Joe.

GBPUSD – Which Way Next?Hello everyone, what do you think about FX:GBPUSD ?
The pair is currently trading around 1.3450, after rebounding from a short-term support zone. Earlier, a sharp drop pushed GBPUSD lower, but buyers quickly stepped in. If buying pressure is strong enough, the pair could retest the 1.3500 – 1.3520 area.
On the other hand, the Support Zone remains a target for sellers. This is a crucial short-term phase: Buy if price holds support – Sell if it fails at resistance.
Which direction do you think GBPUSD will take? 📉📈

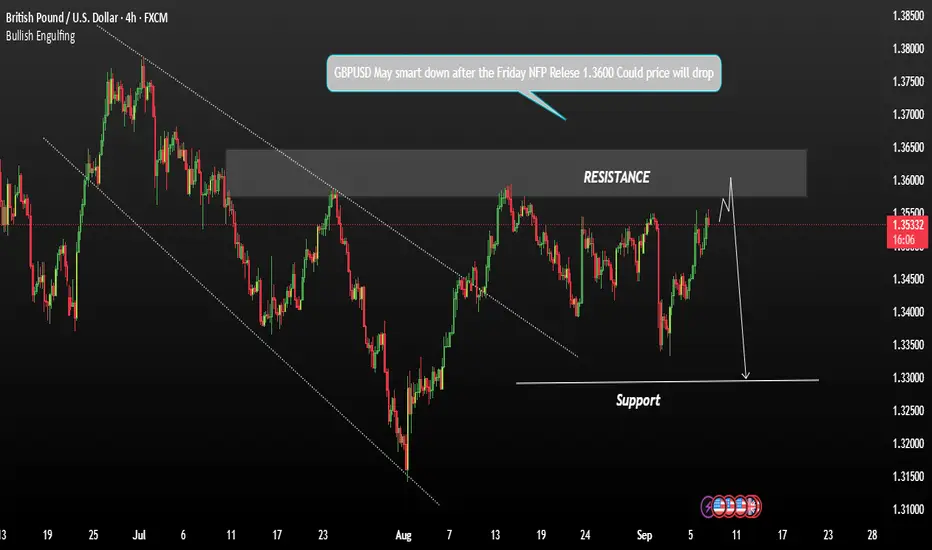
GBPUSD may start a downward move from the Resistance Zone againGBPUSD may start a downward move from the Resistance Zone again
After Friday’s NFP release, GBPUSD climbed to 1.3550, where it ran into its first resistance.
If the rally continues, the next key level is around 1.3590, a zone where price has repeatedly stalled in recent months.
However, I believe the upside is likely exhausted, and the risk of a reversal is growing.
A drop toward 1.3455 and possibly 1.3360 could unfold in the coming days.
You may find more details in the chart!
Thank you and Good Luck!
❤️PS: Please support with a like or comment if you find this analysis useful for your trading day❤️

GBP/USD | Pound at 1.3535 – Watching for Deeper Drop! (READ)By analyzing the GBP/USD chart on the 4-hour timeframe, we can see that the price is trading around 1.3535. If it closes and holds below 1.3553, we can expect more downside.
The possible bearish targets are 1.3513, 1.3480, and 1.3473. The key demand zones are 1.3480–1.3500 and 1.3448–1.3460.
Please support me with your likes and comments to motivate me to share more analysis with you and share your opinion about the possible trend of this chart with me !
Best Regards , Arman Shaban

GBPUSD Faces Strong Ceiling at 1.36 – Drop to 1.32 Ahead?The first half of this year was strongly bullish for GBPUSD, with the pair climbing from 1.20 to 1.37 — a rally of nearly 1,700 pips (14%).
However, after topping in July, cable corrected around 600 pips, only to find solid support at 1.32 in August. From there, a rebound followed, pushing price back up to 1.36 by the end of the month.
Looking at the chart, we can see a clear technical picture: while GBPUSD has rebounded from support, it has also formed a very strong ceiling at 1.36. This zone has now been reinforced by a bearish pin bar printed just two days ago.
Going forward, as I already highlighted in my DXY analysis, I expect a rebound in the USD — and this will almost certainly translate into a drop in cable.
From a purely technical standpoint:
• 1.36 = strong resistance, validated by the pin bar and multiple rejections.
• 1.34 is the first support and can act as a soft target.
• In the medium term, I expect GBPUSD to revisit 1.32.
The strategy is clear: sell the rallies into resistance, as the pair appears to be at the beginning of a corrective leg lower. 🚀

GBPUSD may distribute to 1.38 GBPUSD breaks through the downward resistance that has been holding back the market for a month and tests the resistance at 1.3600. Technically, a false breakout could lead to a minor correction before a rally to 1.368 - 1.380.
Scenario: If GBPUSD breaks through resistance at 1.35886 - 1.3600 and forms a local consolidation above this zone, then the resistance of the formed consolidation can be considered a trigger and traded as a breakout with the aim of continuing growth.
However, based on the current situation, I expect a slight pullback, for example to 1.355 - 1.350, before growth to the specified targets.

GBP/USD –> Bearish Channel in Play, Watching for Short EntriesHello guys!
The pair remains under pressure, trading inside a descending channel that has been guiding price action for several weeks. Each rally attempt has been capped by the channel’s upper boundary, confirming the overall bearish sentiment.
Observations:
Resistance Zone: The upper boundary of the channel near 1.3520 – 1.3560 continues to reject bullish attempts.
QML Zone: Around 1.3340 – 1.3360, this level has provided support, but repeated tests are weakening it.
Bearish Structure: Lower highs and lower lows inside the channel confirm sellers are still in control.
📉 Bearish Scenarios:
Aggressive Entry: Short positions could be considered on rejection from the mid-level resistance inside the channel (1.3480).
Conservative Entry: Alternatively, waiting for a deeper retest of the channel’s upper boundary (1.3520–1.3560) offers a safer confirmation before entering short.
🎯 Targets:
Initial target: 1.3380 (QML zone)
Extended target: 1.3313 (channel support and marked key level)
As long as the price trades within this descending channel, the outlook stays bearish. A confirmed break below 1.3313 could open the door for further downside in the coming sessions.
Disclaimer: As part of ThinkMarkets’ Influencer Program, I am sponsored to share and publish their charts in my analysis.

Lingrid | GBPUSD Resistance Rejection - Shorting Opportunity FX:GBPUSD has rejected the resistance zone near 1.36000 after printing a higher high, confirming seller presence at the top of the structure. Price is now moving below the 1.3550 area, with the upward trendline acting as near-term resistance. If this line gives way, a move toward 1.3450 becomes likely as part of a corrective phase. The broader chart suggests a potential shift from bullish momentum into consolidation or a deeper pullback. Until buyers reclaim 1.36000, short-term pressure leans to the downside.
💡 Risks:
A dovish Fed stance or weak CPI data could weaken the dollar, pushing GBPUSD back above resistance.
Strong UK GDP or employment figures may reassert bullish momentum and limit the downside.
A risk-on rally in global markets could support GBP demand and stall the corrective decline.
If this idea resonates with you or you have your own opinion, traders, hit the comments. I’m excited to read your thoughts!

GBPUSD: Understanding Resistance ZonesGBPUSD: Understanding Resistance Zones
In this video, I explained :
How to spot a strong resistance zone ?
How can you trade it in a real-time example?
You Can Watch the video for further details.
Thank you!

GBPUSD: Pressing 1.355 – waiting for a clear breakoutHello everyone,
On the H4 chart, GBPUSD maintains a bullish structure: higher lows and price holding above the Ichimoku cloud. Following the breakout on 9 September that left an FVG base at 1.343–1.348, the market is now compressing just below 1.355–1.358. This kind of consolidation often precedes an impulsive move. Should an H4 candle close firmly above 1.358, the 1.362–1.366 zone and even 1.370 become the next objectives.
On the news side, the latest US August PPI print came in soft, easing yields and the DXY, thus reducing pressure on GBPUSD. Looking ahead, jobless claims data and Fed commentary will be in focus: if the tone stays tilted towards easing, it will be difficult for the USD to strengthen significantly at these highs. From the UK side, GDP, industrial production figures, and BoE signals will also act as catalysts; positive data or a less dovish stance could provide the springboard for GBP to break through 1.358.
My bias is bullish, waiting for confirmation above 1.358 to extend the upward move.
What about you – do you think GBPUSD will break the ceiling soon?

Gbpusd forecastLive market analysis on gbpusd sellside and buy side model - pure technical analysis but how I think will play out over next few days

GBPUSD: Bearish-Neutral, But Showing Signs Of WeaknessWelcome back to the Weekly Forex Forecast for the week of Sept 8 - 12.
In this video, we will analyze the following FX market: GBPUSD
The GBPUSD has been a little more bearish than EURUSD. This is still the case. Bearish and moving sideways. There was a sweep of buy side liquidity Friday, but a late retreat back into the range of last weeks range. This may indicate weakness going into this week, and I am looking for price to turn over, as it is still inside correction territory.
Enjoy!
May profits be upon you.
Leave any questions or comments in the comment section.
I appreciate any feedback from my viewers!
Like and/or subscribe if you want more accurate analysis.
Thank you so much!
Disclaimer:
I do not provide personal investment advice and I am not a qualified licensed investment advisor.
All information found here, including any ideas, opinions, views, predictions, forecasts, commentaries, suggestions, expressed or implied herein, are for informational, entertainment or educational purposes only and should not be construed as personal investment advice. While the information provided is believed to be accurate, it may include errors or inaccuracies.
I will not and cannot be held liable for any actions you take as a result of anything you read here.
Conduct your own due diligence, or consult a licensed financial advisor or broker before making any and all investment decisions. Any investments, trades, speculations, or decisions made on the basis of any information found on this channel, expressed or implied herein, are committed at your own risk, financial or otherwise.

GBP/USD|EMA200 Support&Trendline Holding–Bullish Potential AheadThe GBP/USD daily chart is respecting the 200 EMA (blue line) as dynamic support, while also holding above the long-term uptrend line.
Key points from the chart setup:
✅ EMA200 acting as strong support – price rejected near this level multiple times.
✅ Uptrend structure intact – higher highs & higher lows remain valid.
✅ Descending triangle breakout – potential bullish continuation if price holds above trendline.
✅ Next resistance: 1.3457 zone.
✅ Support zone: 1.3205 demand area.
📈 If GBP/USD sustains above the EMA200 & trendline, bullish continuation toward 1.3457+ remains in play. A clean break below may open downside toward 1.3205 support.
This is not financial advice. Always use risk management.

GBPUSD consolidation to move downsideGBP/USD Outlook Price is consolidation to move downside After Friday’s NFP release, GBP/USD climbed to 1.3600, a key resistance level that has repeatedly capped price in recent months. The 1.3600 area is a major supply zone, where price often struggles to sustain gains. Upside momentum looks exhausted, and the risk of reversal is increasing.
If selling pressure emerges at resistance, a corrective downtrend could unfold. and there First key support lies near 1.3450, with a deeper move potentially extending towards 1.3300.
You may find more details in the chart.
Trade wisely Best Of Luck.
Ps; Support with like and comments for better analysis.
GBPUSD: Bearish Continuation is Highly Probable! Here is Why:
The recent price action on the GBPUSD pair was keeping me on the fence, however, my bias is slowly but surely changing into the bearish one and I think we will see the price go down.
Disclosure: I am part of Trade Nation's Influencer program and receive a monthly fee for using their TradingView charts in my analysis.
❤️ Please, support our work with like & comment! ❤️

double BottomDOBLE BOTTOM:-
single touch
neckline
second touch
taking 50% with fib tool and hence wait for retest .
entry at breakout from neckline and BOOM

GBPUSD 1HThe price on the 1-hour time frame has reached a very strong supply zone after absorbing liquidity above the previous highs in two equal steps. Therefore, after absorbing liquidity FVG and returning to supply zones on the 1-hour time frame, with the appearance of a bearish engulfing setup, we can expect a significant drop.

GBP/USD - Markets Are ShiftingDear Friends in Trading,
Markets are shifting...How I see it
Check out 3D & 3W Time Frames:
It will take an unforeseen Macro event of epic proportions to push the
cable through the indicated confluence.
Although not impossible.
I sincerely hope my point of view offers a valued insight.
Thank you for taking the time study my analysis.

Sell GBPUSDWe have waited for a signal from GBPUSD for the whole week. Finally, we may have something here. 1,35666 looks a strong resistance and a great sell entry

GBPUSDHello Traders! 👋
What are your thoughts on GBPUSD?
After rejecting a resistance area, GBP/USD has entered a corrective phase and is now approaching a high-confluence support zone, where multiple technical elements align
Price is expected to show bullish reaction within the support zone after some short-term consolidation.
Holding above this area could trigger a new impulsive wave toward previous resistance levels
As long as price stays above the support, the bullish bias remains valid.
A break and close below 1.31300 would invalidate the bullish setup, potentially opening the door for a deeper correction.
Don’t forget to like and share your thoughts in the comments! ❤️

