Gbpusd down trend GBP/USD Daily Chart – Price is facing resistance at 1.3685 and showing bearish pressure. If rejection continues, it may head towards Support 1 at 1.3348, and further down to Support 2 at 1.3130.
GBPUSD trade ideas

GBP/USD Soars Sharply: Can This Breakout Hold?Technical Analysis:
Price Pattern: GBP/USD is currently in an uptrend with strong support at 1.34300 and resistance near 1.35900.
EMA: The 34-period EMA has crossed above the 89-period EMA, indicating the strength of the uptrend.
Signal: Price has just broken through the 1.35200 resistance zone, suggesting that the strong uptrend may continue.
News:
After remarks from Fed officials at the Jackson Hole Symposium, the USD weakened, allowing GBP/USD to benefit and providing an opportunity for further gains.
Trading Strategy:
Uptrend: If price stays above 1.35200, the pair could continue rising, targeting 1.35900 and potentially 1.36500.
Support Levels: If price pulls back and holds above 1.34300, the uptrend will be further confirmed.

GBP/USD SetupThis GBP/USD 1H analysis shows a bearish outlook. Price is expected to reverse down from the current level with a stop loss at 1.3592, aiming for the target zone around 1.3343. The chart highlights potential pullbacks before continuing lower within the downtrend channel.

GBPUSD: Bearish Outlook on Fundamental and Structure AnalysisGBPUSD: Bearish Outlook Based on Fundamentals and Structure Analysis
On Friday, before the press conference, everything moved aggressively against the USD. It was a strange move because it happened suddenly without any news and before Powell said hello.
At the time Powell sent the rate cut message, the USD did not strengthen. However, the market expected a rate cut in September and that is why the USD was strong during the week.
I also read that the market is pricing in a rate cut, but these words are just like old legends now, as the USD priced in this rate cut several times and is very cheap so far. The rate cut was great news.
Technical Analysis:
GBPUSD hit two of our targets from the previous analysis and bounced back higher on Friday.
Considering all of the above, despite the USD being weak, I think GBPUSD could fall back down from the red soon, following the old scenario. This structure zone located near to 1.3590 proved to be strong and it can push the price back down again.
You may find more details in the chart!
Thank you and Good Luck!
PS: Please support with a like or comment if you find this analysis useful for your trading day
Disclosure: I am part of Trade Nation's Influencer program and receive a monthly fee for using their TradingView charts in my analysis.
GBP/USD (1H timeframe).GBP/USD (1H timeframe) with Ichimoku cloud and target zones drawn.
From what I see on my chart:
Current price: ~1.3467
First target (TP1): around 1.3400 – 1.3410 zone (first red "TARGET POINT")
Second target (TP2): around 1.3280 – 1.3290 zone (lower red "TARGET POINT")
📌 So my chart is showing a bearish setup with:
TP1 ≈ 1.3400
TP2 ≈ 1.3280

GBPUSD at 1.35250 Resistance as DXY Eyes 98.100 SupportHey Traders, in today's trading session we are monitoring GBPUSD for a selling opportunity around 1.35250 zone, GBPUSD is moving within a descending channel, with price correcting higher toward the 1.35250 resistance zone — an area that previously acted as support.
Meanwhile, the U.S. Dollar Index (DXY) remains in an uptrend and is approaching the 98.100 support area, which may influence GBPUSD direction if buyers step in.
Watching how GBPUSD reacts at 1.35250 in relation to DXY’s behavior could provide insight into whether the current correction ends or extends further.
Trade safe, Joe.

GBPUSD Breakout and Potential RetraceHey Traders, in today's trading session we are monitoring GBPUSD for a buying opportunity around 1.34800 zone, GBPUSD was trading in a downtrend and successfullly managed to break it out. Currently is in a correction phase in which it is approaching the retrace area at 1.34800 support and resistance zone.
Trade safe, Joe.

GBPUSD Long Setup: Strong Services & Weak USD in FocusToday, we will examine the long position of GBPUSD ( OANDA:GBPUSD ) together from a fundamental and technical perspective .
Please stay with me.
GBPUSD Fundamental Analysis :
GBP Strength Signals:
CPI y/y: 3.8% vs 3.7% expected → higher inflation → less likelihood of rate cuts → supports GBP.
Flash Services PMI: 53.6 vs 51.8 expected → strong service sector → positive for GBP.
GBP Weak Signals:
Flash Manufacturing PMI: 47.3 vs 48.2 expected → contraction in manufacturing → short-term pressure on GBP.
USD Weak Signals:
US Unemployment Claims: 235K vs 226K expected → weaker labor market → negative for USD.
Summary:
Overall, data favors GBP over USD. Short-term to medium-term, GBPUSD is likely to show upside momentum, driven by strong services, higher inflation, and weaker USD labor data. Watch for upcoming US data or Fed comments that could change this bias.
Note: Flash Manufacturing/Services PMI will publish soon.
Note: Tomorrow, we will have Fed Chair Powell speak.
------------------------------------------
Now let's take a technical look at the GBPUSD on the 4-hour timeframe .
GBPUSD is currently moving near the Heavy Support zone($1.343-$1.313) and Potential Reversal Zone(PRZ) .
In terms of Elliott wave theory , GBPUSD seems to have completed the corrective waves . The first signal to confirm the end of the corrective waves could be the break of the upper line of the descending channel . The corrective wave structure is most likely a Double Three Correction(WXY) .
I expect GBPUSD to rise to at least $1.357 AFTER the break of the upper line of the descending channel .
Second Target: $1.363
Note: Stop Loss(SL): 1.3326 USD = Worst Stop Loss(SL)
Please respect each other's ideas and express them politely if you agree or disagree.
British Pound / U.S Dollar Analysis (GBPUSD), 4-hour time frame.
Be sure to follow the updated ideas.
Do not forget to put a Stop loss for your positions (For every position you want to open).
Please follow your strategy and updates; this is just my Idea, and I will gladly see your ideas in this post.
Please do not forget the ✅' like '✅ button 🙏😊 & Share it with your friends; thanks, and Trade safe.

GBPUSD Faces Pressure as Dollar Strength Reasserts ControlGBPUSD has staged a corrective rally in recent sessions, but the recovery is already showing signs of fading. Price has stalled at a key resistance zone, and sellers are beginning to step back in, eyeing deeper downside. With UK fundamentals under strain and the U.S. dollar supported by resilient macro data, the path of least resistance appears tilted toward further weakness in cable.
Current Bias
Bearish – downside continuation favored as the rally runs into resistance.
Key Fundamental Drivers
U.S. dollar demand underpinned by safe-haven flows and strong macro resilience.
Bank of England dovish tilt after its recent rate cut, with policymakers cautious on growth risks.
UK growth slowdown, particularly in services and housing markets, weighing on sterling sentiment.
Trade and tariff uncertainty amplifying pressure on UK-linked assets.
Macro Context
Interest rate expectations: The Fed is expected to hold rates higher for longer, while the BoE is already cutting, increasing yield divergence against sterling.
Economic growth trends: UK economic growth remains fragile, with weak consumer demand and stagnant investment. U.S. data has been relatively stronger.
Commodity flows: Lower oil imports may give slight GBP support, but overall trade dynamics favor USD strength.
Geopolitical themes: Ongoing tariff disputes, Brexit trade adjustments, and global slowdown fears limit sterling’s upside potential.
Primary Risk to the Trend
A sudden resurgence in UK inflation or unexpectedly hawkish BoE commentary could support sterling and trigger a sharp squeeze higher.
Most Critical Upcoming News/Event
UK CPI print (key for BoE rate expectations)
U.S. PMI and Fed commentary (signals on U.S. growth and policy stance)
Leader/Lagger Dynamics
GBPUSD is often a lagger relative to EURUSD, reacting to broader USD flows rather than leading them.
The pair can influence GBP-crosses like GBPNZD, GBPJPY, and GBPCHF, particularly during UK-centric news.
Key Levels
Support Levels: 1.3424, 1.3160
Resistance Levels: 1.3590, 1.3715
Stop Loss (SL): 1.3720
Take Profit (TP): 1.3424 (first target), 1.3160 (extended target)
Summary: Bias and Watchpoints
GBPUSD remains under downside pressure, with rallies into resistance continuing to attract sellers. The bearish bias is intact, with a stop loss at 1.3720 protecting against a breakout reversal, and take-profit levels eyed at 1.3424 and 1.3160. With UK fundamentals deteriorating and U.S. data supporting dollar strength, traders should keep a close watch on upcoming UK CPI and U.S. Fed communications, as these events will likely dictate the next decisive move. Until then, the pair looks poised to extend lower.

GBPUSD I Daily Range I Key Level - FVG I Target Full rangeDaily Range was manipulated and rejected - followed by an order block which is change. in order flow to the bullish side. Im targeting opposing side of the range.
What is your opinion?
Good luck
David Perk aka Dave FX Hunter

GBPUSD Reached on Resistance Suggesting Downside PhaseGBPUSD has recently pushed higher with momentum Price is now approaching a clear resistance zone, showing an initial rejection from that level. If the rejection strengthens at the current top resistance, we could see a short-term pullback toward 1.34000. This would be a healthy retracement before any further bullish attempts.
The key support in focus is 1.34000.
If price consolidates and breaks above the top resistance with strong volume, it could open room for continuation higher, with the previous rejection becoming invalid.
You May find more details in the Chart.
Ps; Support with like and comments for better analysis Thanks for understanding.

GBPUSD: Bearish Momentum Persists Amid Weak Fundamentals ? FX:GBPUSD continues to show weakness both technically and fundamentally. The price action has shifted clearly from the previous upward channel to a clear downward structure, and sellers are still in control.
From a technical perspective, the pair has failed to hold above key resistance levels and continues to respect the descending trendline. Each retest of the upper boundary has been met with rejection. With this structure intact, the path of least resistance remains downward, targeting the next support level.
On the fundamental side, the US dollar is recovering, while the British pound faces pressure as UK economic indicators, including growth and inflation, point to a downturn. As long as these conditions persist, GBPUSD is unlikely to make a significant recovery.
Unless the descending trendline is broken with conviction, the bearish trend remains dominant, with further declines likely toward lower support zones.

20.08.25 Morning ForecastPairs on Watch -
FX:GBPUSD
FX:EURUSD
FX:AUDJPY
OANDA:XAGUSD
A short overview of the instruments I am looking at for today, multi-timeframe analysis down to what I will be looking at for an entry. Enjoy!

GBPUSD – Bullish Pattern in Play?Hello everyone, what’s your view on FX:GBPUSD trend?
The pair is currently forming a potential inverse head and shoulders pattern , one of the strongest signals for a new bullish phase.
📌 Price is holding firmly above the key support zone at 1.340 – 1.322.
📌 If this support continues to hold, the potential target lies near 1.3750 , the previous swing high and completion point of the pattern.
The bullish outlook is favored, with buyers maintaining control. This could be a promising opportunity.
Do you think GBPUSD can reach the target of this analysis? Share your thoughts in the comments!

GBP/USD Outlook - Support Test in PlayHi everyone,
As highlighted in our previous idea, GBP/USD has now corrected into the 1.34400–1.34750 zone, where we expect strong support to emerge and potentially set the stage for a renewed push higher toward the 1.36850 resistance level. Should price extend lower in search of additional demand, the next key zone of interest comes in around 1.33800, where we’d look for buyers to step in.
A decisive break above 1.36850 would bring our next key upside targets into focus. The impulsive rally from the 1st August low continues to reinforce our bullish outlook on GBP/USD, and upcoming headlines through the rest of the week could provide the catalyst for the Cable to press on.
We’ll be monitoring price action closely to see how this structure develops in the sessions ahead.
The longer-term outlook remains bullish, with expectations for the rally to continue extending from the 1.20991 January low toward 1.40000 and 1.41700.
We’ll keep you updated throughout the week with how we’re managing our active ideas.
Thanks again for all the likes, boosts, comments, and follows — we really appreciate the support!
All the best for the week ahead.
Trade safe,
BluetonaFX

Strong sell gbpusdLong term selling possible
Fed now going to cut rates next month
Following the down parallel channel now

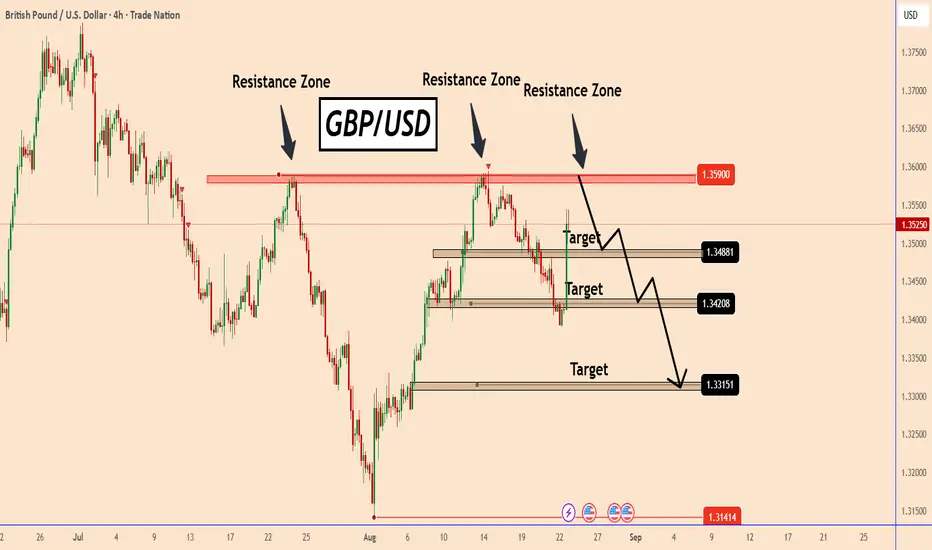
GBPUSD: Structure AnalysisGBPUSD: Structure Analysis
GBPUSD reached a strong structural resistance area near 1.3590.
In two weeks, GBPUSD rose by almost +450 after the BOE cut interest rates.
However, GBPUSD also rose because the US is expected to cut rates after the BOE cut rates.
As we can see for the same news, the market is not reacting in the same way.
Last week we had the CPI data and the market predicted a rate cut by the FED at the September meeting by 25 to 50 basis points.
US Treasury Secretary Bessent urges Fed cuts, citing models suggesting 1.5% lower rates.
Today, despite this good data, GBP did not rise more than 10 basis points.
The data we have from the US today is preliminary. All are important, but we can have a high impact.
Given that the CPI data has already been released, it is very likely that the CPI data will be consistent with the CPI data insofar as they reflect almost the same thing overall.
I am predicting a downward reaction in prices near our area. However, we need to be careful as the news could easily push the price either way. It is probably better to focus on a sell-off after the news.
You may find more details in the chart!
Thank you and Good Luck!
PS: Please support with a like or comment if you find this analysis useful for your trading day
Disclosure: I am part of Trade Nation's Influencer program and receive a monthly fee for using their TradingView charts in my analysis.

GBP/USD Growth – Breakout on News MomentumGBP/USD has strongly rebounded from the immediate support at 1.3490, holding above the trendline. This momentum is driving price action closer to the key resistance at 1.3650, where profit-taking pressure may emerge. A clear breakout above this level would confirm and extend the short-term bullish trend.
On the news side, the dovish remarks from Fed Chair Jerome Powell at Jackson Hole weakened the USD, providing a strong push for GBP/USD to break above 1.3500. In addition, markets are awaiting U.S. PMI data and the Fed’s upcoming policy direction, both of which could further support the pound’s upward momentum.
Suggested strategy: Traders may consider buying near the immediate support zone, setting a short-term target at 1.3650, with a further extension to 1.3720 if the breakout holds. A stop-loss should be placed below 1.3390 to limit risks in case of a trend reversal.

GBPUSD uptrend continuation, Fed rate cuts? The GBPUSD remains in a bullish trend, with recent price action showing signs of a consolidation breakout rally within the broader uptrend.
Support Zone: 1.3466 – a key level from previous consolidation. Price is currently testing or approaching this level.
A bullish rebound from 1.3466 would confirm ongoing upside momentum, with potential targets at:
1.3675 – initial resistance
1.3730 – psychological and structural level
1.3790 – extended resistance on the longer-term chart
Bearish Scenario:
A confirmed break and daily close below 1.3466 would weaken the bullish outlook and suggest deeper downside risk toward:
1.3414 – minor support
1.3390 – stronger support and potential demand zone
Outlook:
Bullish bias remains intact while the GBPUSD holds above 1.3466. A sustained break below this level could shift momentum to the downside in the short term.
This communication is for informational purposes only and should not be viewed as any form of recommendation as to a particular course of action or as investment advice. It is not intended as an offer or solicitation for the purchase or sale of any financial instrument or as an official confirmation of any transaction. Opinions, estimates and assumptions expressed herein are made as of the date of this communication and are subject to change without notice. This communication has been prepared based upon information, including market prices, data and other information, believed to be reliable; however, Trade Nation does not warrant its completeness or accuracy. All market prices and market data contained in or attached to this communication are indicative and subject to change without notice.

Head, shoulders, knees, and toes.This would be bonkers mate. Until the news comes out from the Hole, stuck in between walls.
Good luck. God bless.


Buy idea on GUICT Judas swing. There was an accumulation just above a 4h fair value gap. And after New York opening price, price took out sell side liquidity with a turtle soup move and mitigated the fair value gap below and proceeded to give a market structure shift to the up side. Looking to enter longs at the 1h order block opening price

GBP/USD Buy tradeGBP/USD Buy trade inverse head n shoulder
Buy Price: 1.3615
Stoploss : 1.3380
Target : 1.4041
