GBPUSD forming bearish trend in 1 hour time frameGBPUSD forming bearish trend in 1 hour time frame.
Market is forming lower low which shows indicates bearish trend.
Price is also forming Bearish flag pattern.
Market is expected to remain bearish in upcoming trading sessions.
On lower side market can hit the target levels of 1.35800 & 1.35100.
On higher side market may test the resistance level of 1.37900.
GBPUSD trade ideas

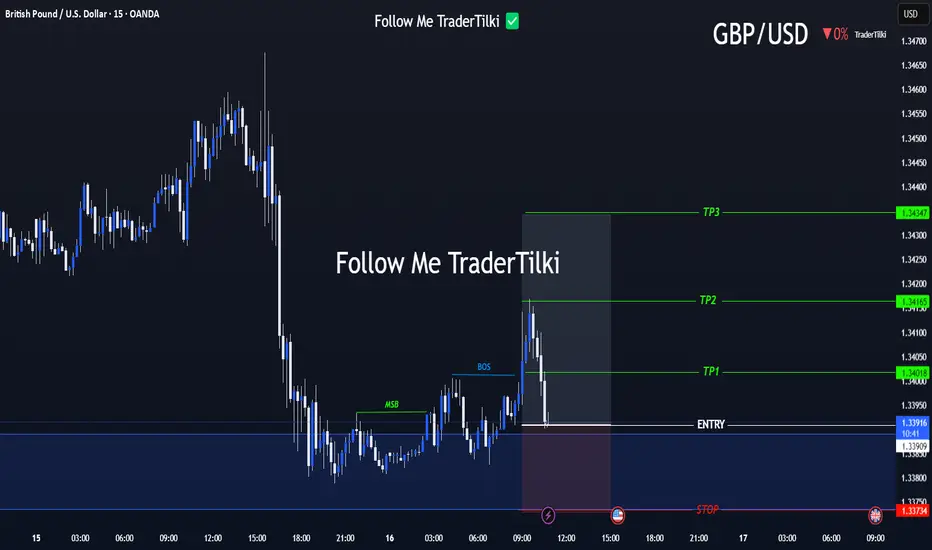
Strategic Entry, Clear Targets: The GBPUSD Game Plan Is Set📢 Hello Guys,
I've prepared a fresh GBPUSD signal for you:
🟢 Entry Level: 1.33918
🔴 Stop Loss: 1.33734
🎯 TP1: 1.34018
🎯 TP2: 1.34165
🎯 TP3: 1.34347
📈 Risk/Reward Ratio: 2,40
------
Your likes and support are what keep me motivated to share these analyses consistently.
Huge thanks to everyone who shows love and appreciation! 🙏
GBPUSD Week 29 Swing Zone/LevelsAfter 7 straight weeks of profitable gold trading, we’re shifting gears to GBPUSD.
Why this pair? It’s offering a classic low-risk, high-reward setup that many traders appreciate:
🔒 Stop Loss: 10–15 pips
🎯 Take Profit: 50–100 pips
We’re analyzing price action using a simple but powerful concept:
Each zone is drawn based on how the high and low of one day compares with the next. For example:
Monday’s high/low vs Tuesday’s range
Tuesday’s vs Wednesday’s, and so on
This method helps spot potential continuation zones as market structure unfolds across the week.
👉 The key? Patience, and letting the levels tell the story.
As always price action determines trades

GBPUSD h4 big downhe resistance at 1.36554 may be weak due to:
Multiple taps already
Reduced seller interest
A breakout above this zone could trigger short covering → sharp rally
✅ 2. Higher Low Structure
Recent low at 1.35475 held strong
Current consolidation appears like a bullish flag or accumulation range
Could indicate continuation, not rejection
GBPUSD SELL IDEA Fakeout Reversal Setup
If price dips into the support at 1.35475 again, it might:
Trap breakout traders
Reverse and form a new impulse leg upward
Target = 1.3700–1.3750 zone
Disruption Path: Bullish Breakout
Minor dip or tight range around current price
Break and hold above 1.3655
Acceleration toward 1.3700–1.3750
Disruption Invalidation
A strong close below 1.3540 with volume

GBPUSD LONG FORECAST Q3 D16 W29 Y25GBPUSD LONG FORECAST Q3 D16 W29 Y25
Welcome back to the watchlist GBPUSD ! Let's go long ! Alignment across all time frames.
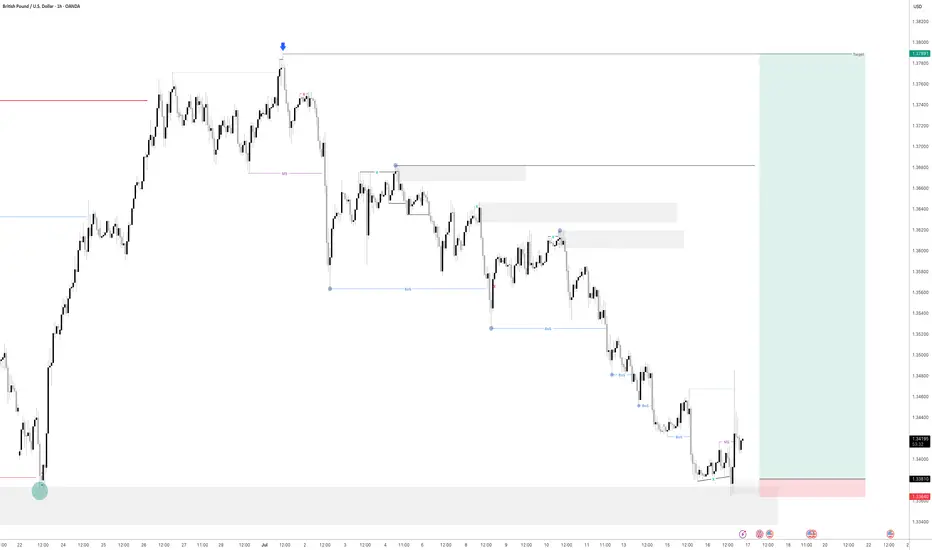
Professional Risk Managers👋
Welcome back to another FRGNT chart update📈
Diving into some Forex setups using predominantly higher time frame order blocks alongside confirmation breaks of structure.
Let’s see what price action is telling us today!
💡Here are some trade confluences📝
✅Daily order block
✅1H Order block
✅Intraday breaks of structure
✅4H Order block
📈 Risk Management Principles
🔑 Core Execution Rules
Max 1% risk per trade
Set alerts — let price come to your levels
Minimum 1:2 RR
Focus on process, not outcomes
🧠 Remember, the strategy works — you just need to let it play out.
🧠 FRGNT Insight of the Day
"The market rewards structure and patience — not emotion or urgency."
Execute like a robot. Manage risk like a pro. Let the chart do the talking.
🏁 Final Words from FRGNT
📌 GBPUSD is offering textbook alignment — structure, order flow, and confirmation all check out.
Let’s approach the trade with clarity, conviction, and risk-managed execution.
🔑 Remember, to participate in trading comes always with a degree of risk, therefore as professional risk managers it remains vital that we stick to our risk management plan as well as our trading strategies.
📈The rest, we leave to the balance of probabilities.
💡Fail to plan. Plan to fail.
🏆It has always been that simple.
❤️Good luck with your trading journey, I shall see you at the very top.
🎯Trade consistent, FRGNT X

GBPUSD is Nearing the Daily Trend!!!Hey Traders, in tomorrow's trading session we are monitoring GBPUSD for a buying opportunity around 1.34100 zone, GBPUSD is trading in an uptrend and currently is in a correction phase in which it is approaching the trend at 1.34100 support and resistance area.
Trade safe, Joe.
GBPUSD London PlayWhat I see and what I am in, already 1:3RR and will keep an eye for news in 2 hours as well as the lower levels marked
GBP/USD Rate Falls to Key Support LevelGBP/USD Rate Falls to Key Support Level
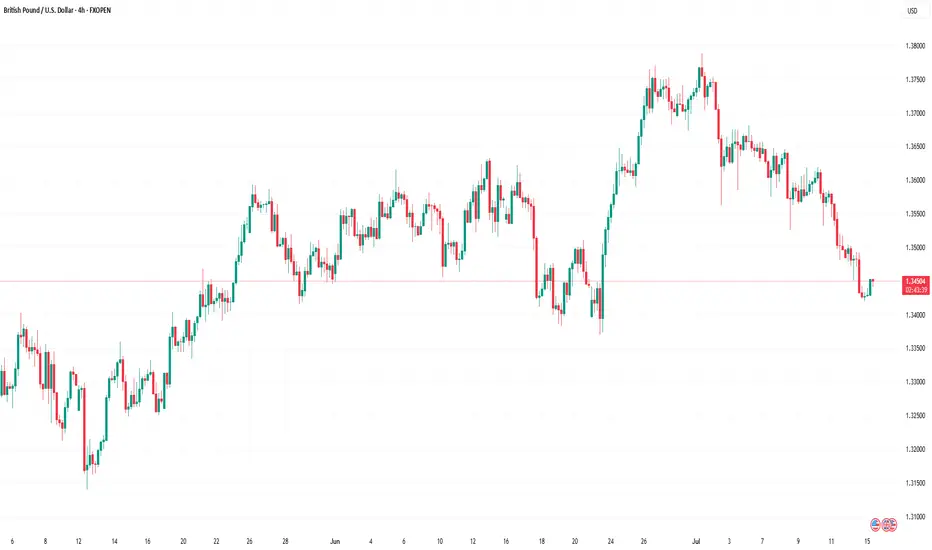
As of today, the GBP/USD chart indicates that the British pound has declined by more than 2% against the US dollar since the beginning of July. Notably, the pace of the decline accelerated on Friday and continued into Monday.
According to Reuters, the pound is under pressure due to market concerns over a potential economic slowdown amid an escalating trade war. Last week’s data confirmed a contraction in UK GDP, which could have far-reaching implications. In this context, criticism of the UK government’s failure to reduce public spending is becoming more pronounced.
What’s next for GBP/USD?
Technical Analysis of the GBP/USD Chart
From a bullish perspective, it is worth noting that the pair has fallen to a significant support level around 1.3425. This level previously acted as resistance in the spring, but after a breakout, it has now turned into support (as indicated by arrows on the chart). Additionally, the RSI indicator shows strong oversold conditions, which suggests a potential short-term rebound.
From a bearish standpoint, it is concerning that the sharp rally from point A to point B has been entirely erased by the July decline. This indicates that despite significant gains by the bulls, they failed to hold them—casting doubt on GBP/USD's ability to sustain growth in the medium term.
Ongoing pressure may lead to an attempt by bears to push GBP/USD below the June low at point A. However, it is also possible that bearish momentum will weaken thereafter, potentially leading to a recovery within the developing downward channel (marked in red).
This article represents the opinion of the Companies operating under the FXOpen brand only. It is not to be construed as an offer, solicitation, or recommendation with respect to products and services provided by the Companies operating under the FXOpen brand, nor is it to be considered financial advice.
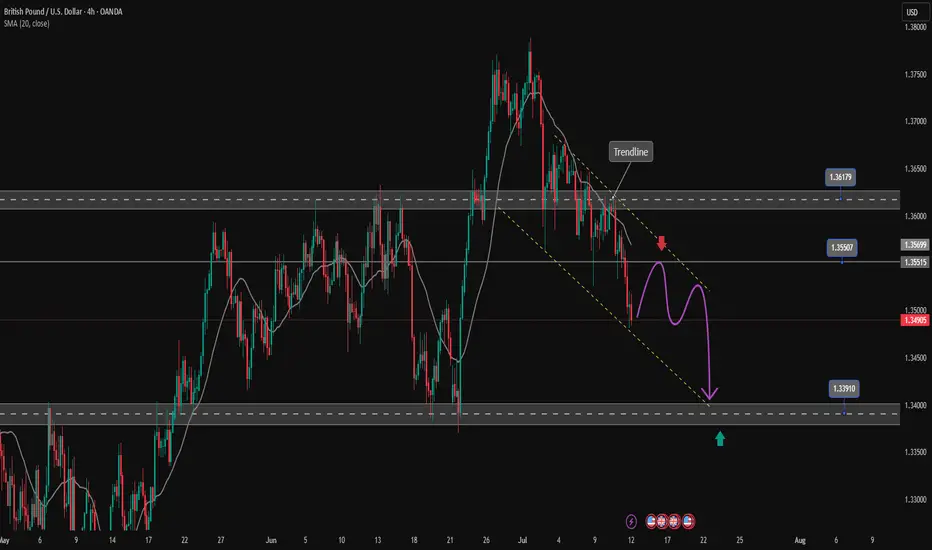
GBPUSD downtrend continuesOANDA:GBPUSD is trading in a bearish channel heading towards the important support zone of 1.340. This is the bottom support zone of last month so there is a lot of buying pressure in this zone. Any recovery of GBPUSD is considered a good opportunity to enter a SELL signal to the target. When the price breaks 1.361, the downtrend will really break.
Support: 1.340
Resistance: 1.355-1.361
SELL Trigger: rejection 1.355 with bearish confirmation
SELL zone 1.361 (Strong Resistance zone)
Target: 1.340
Leave your comments on the idea. I am happy to read your views.
GBPUSD → Correction amid a global bullish trend...FX:GBPUSD is testing the 1.345 - 1.35 area as part of a correction. The price is closing the imbalance zone and testing support, which may trigger a reaction. Further developments will largely depend on the dollar, which is testing resistance.
The daily market structure is quite strong. The correction against the backdrop of a strong trend is within acceptable limits, and bulls should fight to keep the price away from risk zones. GBPUSD, as part of the correction, closes the imbalance zone of 1.34 - 1.35 (0.7 - 0.79f) and forms a false breakdown of the intermediate support level of 1.3476. If buyers hold their ground in the 1.347-1.35 zone, the currency pair will be able to return to the global trend.
Support levels: 1.3476, 1.345, 1.3382
Resistance levels: 1.3511, 1.359, 1.375
Price consolidation above 1.349 - 1.350 will confirm the market's intentions. In this case, we can expect growth to 1.36 - 1.374.
Best regards, R. Linda!

Buy idea!Hello all. market break the IHS at London session and reverse from middle of no-where. It is time to go up again. you can use first TP and you can go for a longer position, but I prefer add my position size and close on first TP. we no it is an STS and will go up whole the NY session. be happy(wink)

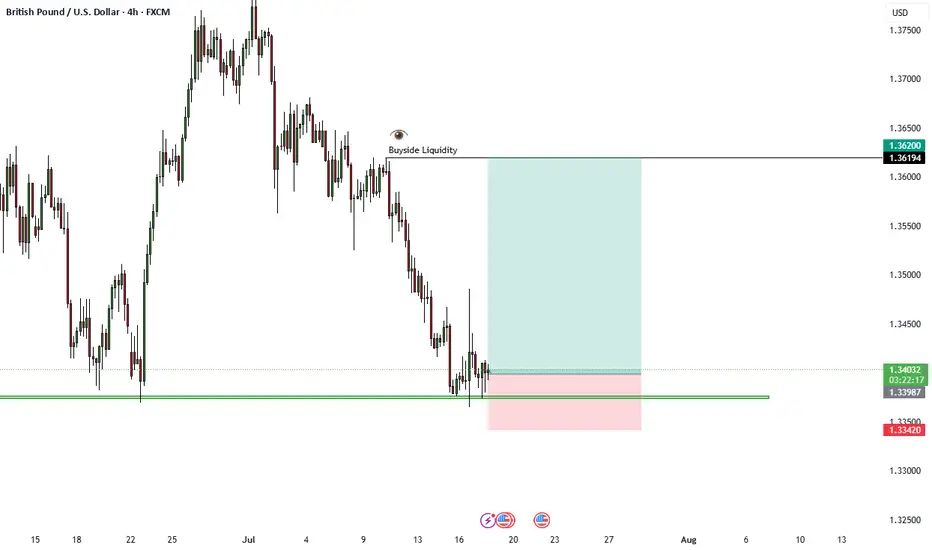
GBP/USD Consolidation Holds — Watching Demand Zone ReactionHi everyone,
Since last week, GBP/USD has continued to consolidate below the 1.36200 level, with several failed attempts to break higher reinforcing this area as firm resistance for now. Following the latest rejection, price moved lower into the 1.35300–1.34600 demand zone, where we’re watching closely for signs of renewed buying interest.
This zone has previously acted as a solid support base, and a reaction here could set the stage for another push higher in the coming sessions. However, if buyers fail to step in convincingly, there remains scope for a deeper retracement before the next attempt to challenge resistance.
We’ll continue to monitor the price action closely to see which scenario plays out and share updates as the structure develops.
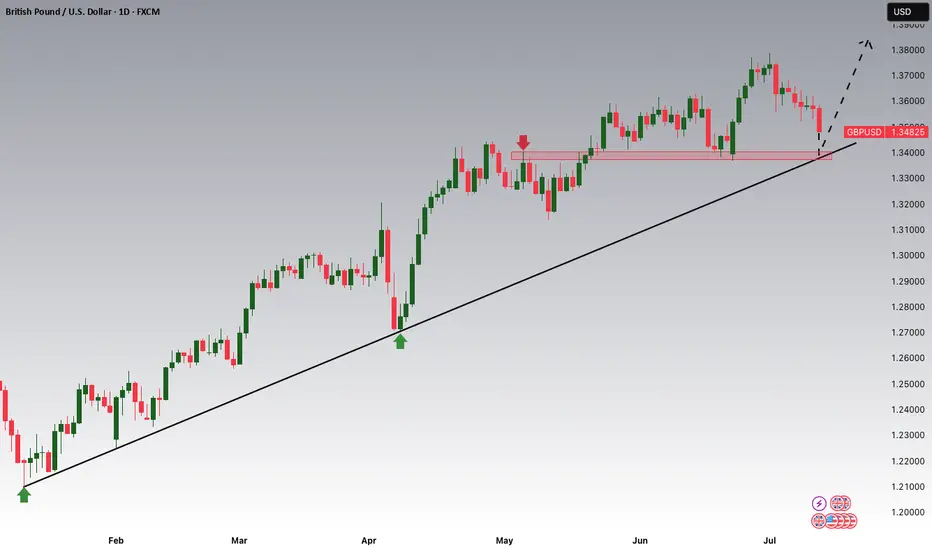
A drop into this area was highlighted as the more probable short‑term path, and we’re now looking for GBP/USD to find support in this region; and more importantly, to hold above the 1.33800 level to form the base for another push higher.
As previously noted, a decisive break above 1.37500 would renew our expectation for further upside, with the next key target around 1.38400. We'll be monitoring price action closely to see how it unfolds.
We’ll continue to provide updates on the projected path for GBP/USD as price approaches this target.
The longer-term outlook remains bullish, and we expect the rally to continue extending further from the 1.20991 January low towards 1.40000 and 1.417000.
We’ll be keeping you updated throughout the week with how we’re managing our active ideas. Thanks again for all the likes/boosts, comments and follows — we appreciate the support!
All the best for the week ahead. Trade safe.
BluetonaFX

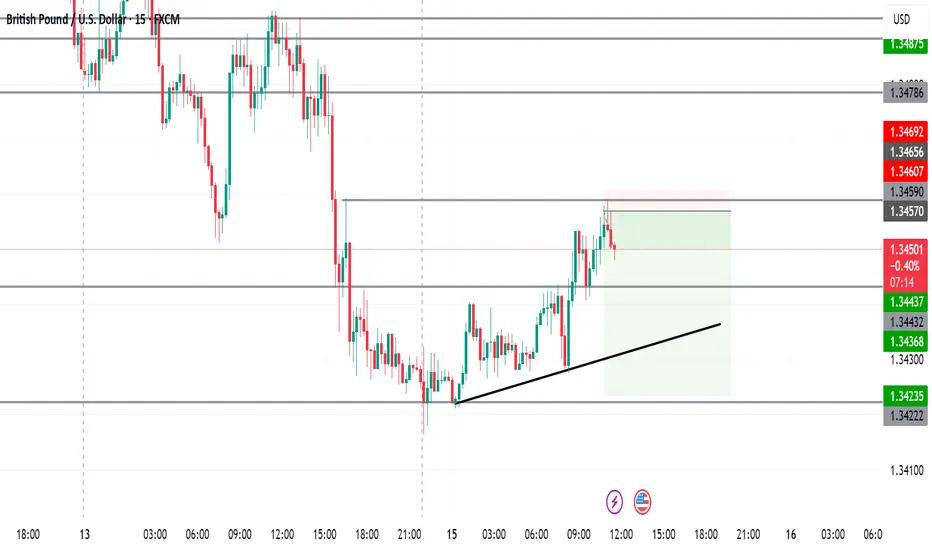
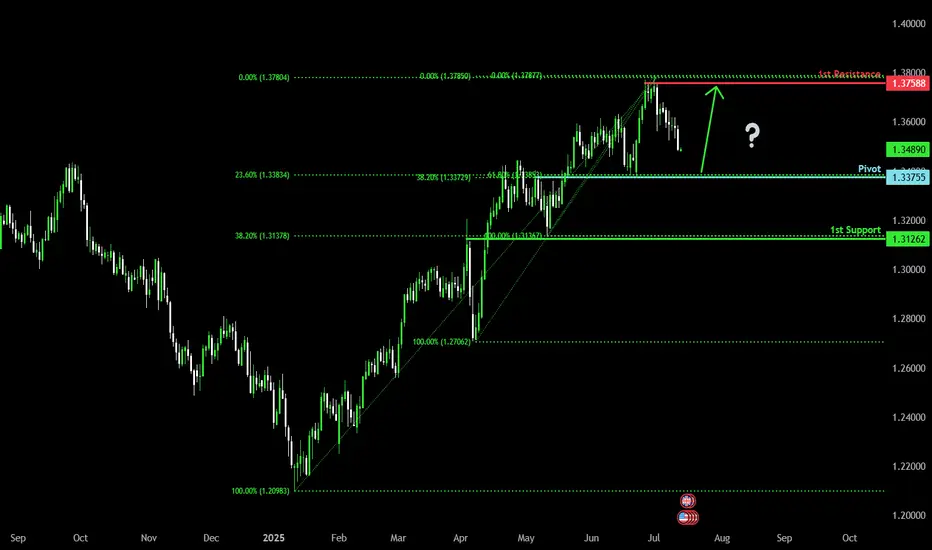
Bullish bounce off overlap support?The Cable (GBP/USD) is falling towards the pivot and could bounce to the 1st resistance which acts as a pullback resistance.
Pivot: 1.3375
1st Support: 1.3126
1st Resistance: 1.3758
Risk Warning:
Trading Forex and CFDs carries a high level of risk to your capital and you should only trade with money you can afford to lose. Trading Forex and CFDs may not be suitable for all investors, so please ensure that you fully understand the risks involved and seek independent advice if necessary.
Disclaimer:
The above opinions given constitute general market commentary, and do not constitute the opinion or advice of IC Markets or any form of personal or investment advice.
Any opinions, news, research, analyses, prices, other information, or links to third-party sites contained on this website are provided on an "as-is" basis, are intended only to be informative, is not an advice nor a recommendation, nor research, or a record of our trading prices, or an offer of, or solicitation for a transaction in any financial instrument and thus should not be treated as such. The information provided does not involve any specific investment objectives, financial situation and needs of any specific person who may receive it. Please be aware, that past performance is not a reliable indicator of future performance and/or results. Past Performance or Forward-looking scenarios based upon the reasonable beliefs of the third-party provider are not a guarantee of future performance. Actual results may differ materially from those anticipated in forward-looking or past performance statements. IC Markets makes no representation or warranty and assumes no liability as to the accuracy or completeness of the information provided, nor any loss arising from any investment based on a recommendation, forecast or any information supplied by any third-party.
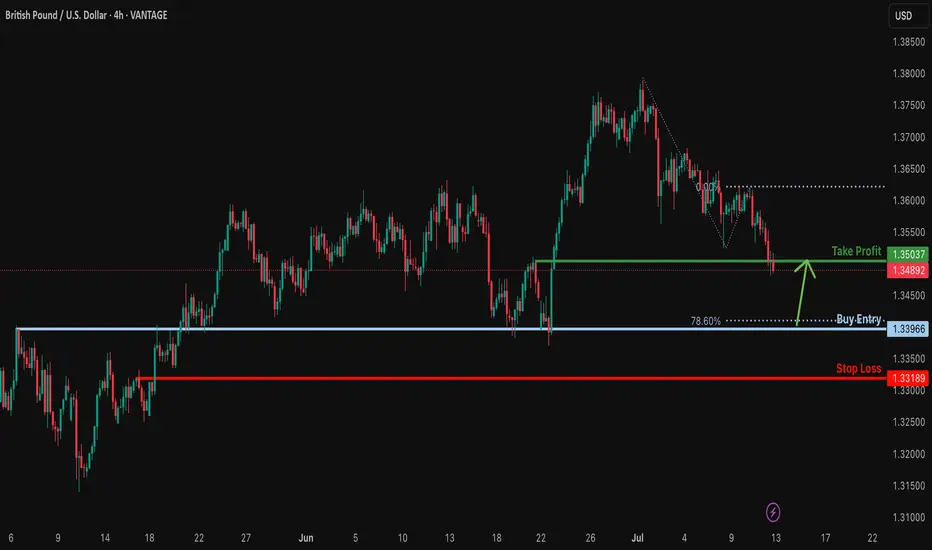
Falling towards major support?The Cable (GBP/USD) is falling towards the support which is an overlap support that lines up with the 78.6% Fibonacci projection and could bounce from this level to our take profit.
Entry: 1.3396
Why we like it:
There is an overlap support that lines up with the 78.6% Fibonacci projection.
Stop loss: 1.3318
Why we like it:
There is a pullback support.
Take profit: 1.3503
Why we like it:
There is a pullback support.
Enjoying your TradingView experience? Review us!
Please be advised that the information presented on TradingView is provided to Vantage (‘Vantage Global Limited’, ‘we’) by a third-party provider (‘Everest Fortune Group’). Please be reminded that you are solely responsible for the trading decisions on your account. There is a very high degree of risk involved in trading. Any information and/or content is intended entirely for research, educational and informational purposes only and does not constitute investment or consultation advice or investment strategy. The information is not tailored to the investment needs of any specific person and therefore does not involve a consideration of any of the investment objectives, financial situation or needs of any viewer that may receive it. Kindly also note that past performance is not a reliable indicator of future results. Actual results may differ materially from those anticipated in forward-looking or past performance statements. We assume no liability as to the accuracy or completeness of any of the information and/or content provided herein and the Company cannot be held responsible for any omission, mistake nor for any loss or damage including without limitation to any loss of profit which may arise from reliance on any information supplied by Everest Fortune Group.
skraaaaaaa!!!!!the trade played out as predicted you can chect my previous post for the comprehensive explanation of this trade
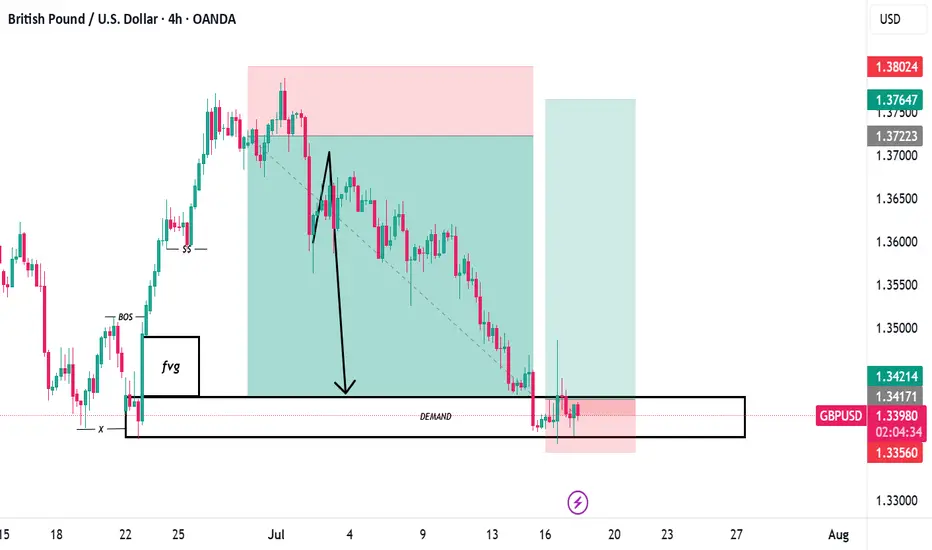
"Smart Money Trap Below Support – Reversal Setup Unfolding"🔍 GBP/USD Price Action Analysis – July 18, 2025
Chart Structure Breakdown:
BOS (Break of Structure):
Multiple BOS points highlight the overall shift in market structure. Initially bullish, the trend started reversing after the last BOS near mid-June.
Key Zones Marked:
Resistance Zone: ~1.37500–1.38500
This area has acted as a strong supply zone, capping previous bullish momentum.
Strong Support Zone: ~1.33150–1.33800
Price has shown strong bullish reactions here in the past, making this a critical demand area.
Current Market Condition:
Price: Currently trading around 1.34504
Recent Trend: Bearish, but approaching the strong support zone.
Projected Move:
The chart shows a possible liquidity grab below recent lows (fakeout), tapping into demand and then a bullish reversal back toward the 1.35735 level, aligning with the minor resistance.
Smart Money Perspective:
Expect a stop hunt (false break below support) before a move up.
Entry zone: Inside the strong support.
Target: Mid-level resistance ~1.35735.
Invalidated if price closes strongly below 1.33150.
🎯 Educational Title Ideas:
“GBP/USD Smart Money Play – Demand Zone Reaction Imminent?”
“BOS and Support: GBP/USD Setup for Reversal”
“GBP/USD Liquidity Sweep Before Bullish Move?”

GBPUSD - Is it Ready? Looking at GBPUSD
We have had a Market shift to the upside from a HTF Point of Interest. I am now waiting for price to come back into a 15min demand area and hopefully price will take off to the upside from here.
We have also swept liquidity before a drastic move to the upside.
Lets see how this one plays out
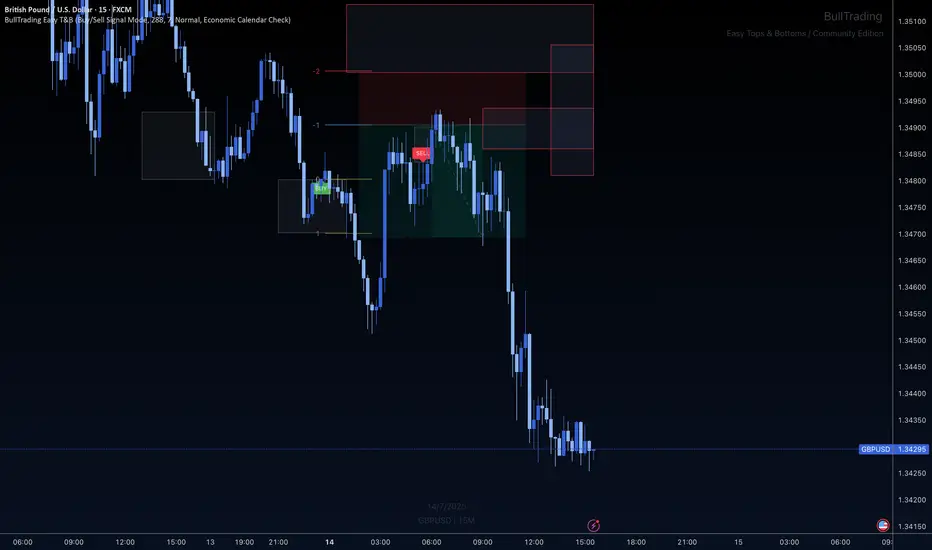
GBP/USD Breakdown Using BullTrading Easy Tops & BottomsIn this setup, GBP/USD broke down through a dynamic red zone printed by the BullTrading Easy Tops & Bottoms indicator (💥 Free for the entire community!).
This zone had previously acted as a potential resistance level, but price showed no respect on approach — instead, we saw strong acceleration through the level, confirming momentum and a liquidity imbalance.
🔍 Why This Mattered:
This indicator doesn’t predict — it highlights true dynamic support and resistance zones based on stop clustering and price behavior.
When price doesn’t respect a zone and breaks through it with strength, that alone tells a story:
When a support zone is broken, price will often rebalance ABOVE the same number of points/pips as the size of the zone itself — that’s your opportunity.
Smart money may be engineering a continuation move
The reaction after the zone is broken is key
In this case, the cleanest play was to use a SELL LIMIT above the broken support zone, and the market gave us clear bearish confirmation
📌 Educational Insight:
The edge isn’t just in the zones — it’s in how price reacts around them.
When a zone fails, it becomes a trigger point for directional bias.
Here, it offered a clean bearish confirmation to short the retest, with a precise stop-loss placed just above the broken structure.
✅ Lot sizing was adjusted based on the stop distance, usually 1:2 RR is optimal
Tighter SL = higher lot size
Wider SL = lower lot size
That keeps risk consistent and manageable.
GBPUSD Is Bearish! Short!
Take a look at our analysis for GBPUSD.
Time Frame: 1h
Current Trend: Bearish
Sentiment: Overbought (based on 7-period RSI)
Forecast: Bearish
The market is testing a major horizontal structure 1.341.
Taking into consideration the structure & trend analysis, I believe that the market will reach 1.338 level soon.
P.S
We determine oversold/overbought condition with RSI indicator.
When it drops below 30 - the market is considered to be oversold.
When it bounces above 70 - the market is considered to be overbought.
Disclosure: I am part of Trade Nation's Influencer program and receive a monthly fee for using their TradingView charts in my analysis.
Like and subscribe and comment my ideas if you enjoy them!

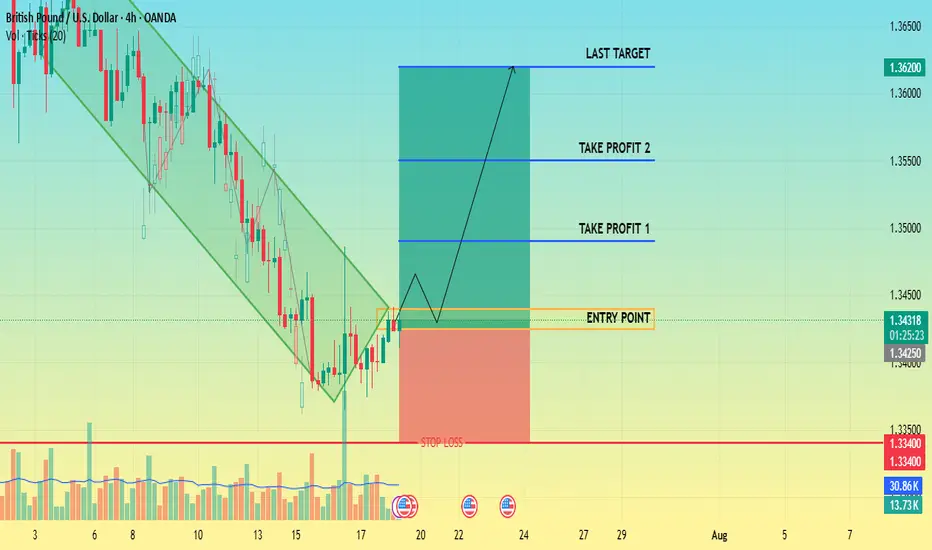
CHECK GBPUSD SIGNAL READ CAPTAIN📍 Trade Setup Overview
Trade Direction: Short (buy)
Entry Point: Around 1.34400 1.34250
Stop Loss: Around 1.33400
🎯 Target Levels
Take Profit 1:
1.34900
Take Profit 2:
1.35500
Last Target:
1.36200
Sell idea!Hello all. price enter a very special but difficult to recognize level and it can push the price lower. be happy. put your SL a little above my level. it is so tight.(wink)

GBPUSD- H4 BUY Price is moving in a channel and weekly show uptrend. Price reach strong area of Support, and FIBO show 78.60
Price show Divergency in Daily frame. All this can indicate that price is finish the correction and now ready to join the main uptrend.
