GBP/USD Short Setup – Rising Wedge BreakdownGBP/USD Short Setup – Rising Wedge Breakdown
Timeframe: 2H
The pair has formed a rising wedge pattern, typically a bearish reversal signal. Price has now broken below the lower trendline, suggesting a potential downside move.
Setup Details:
Entry: ~$1.3717 (post-breakout)
Stop Loss: ~$1.3826 (above recent highs)
Target Zone: $1.3477 to $1.3407
Technical Analysis:
Rising wedge pattern breakdown confirmed
Supertrend indicator has flipped bearish
Momentum divergence visible on lower timeframes (not shown)
Fundamental Context:
GBP remains under pressure due to weak UK economic data and ongoing BoE rate cut expectations
USD strength backed by persistent inflation concerns and hawkish Fed tone
Bias: Bearish (Short-Term Swing Trade)
Look for potential retests of broken support for confirmation. Manage risk accordingly as volatility may increase ahead of upcoming macro events
GBPUSD trade ideas

GBPUSD: Two Strong Bullish Area To Buy From ?GU is currently in a bullish trend when examined on a daily time frame. There are two potential areas for purchase. The first area is currently active, as we anticipate a price reversal from this point. There is a significant possibility that price could decline to the second area and subsequently reverse from there directly. The sole reason we believe price could drop to the second area is if the US Dollar experiences corrections, which could cause GU to drop to our second area and subsequently rebound.
If you appreciate our analysis, we kindly request that you consider the following actions:
-Liking the Ideas
-Commenting on the Ideas
-Sharing the Ideas
We extend our sincere gratitude for your continuous support. We trust that our insights have provided even a modicum of assistance.
Team Setupsfx_
❤️🚀

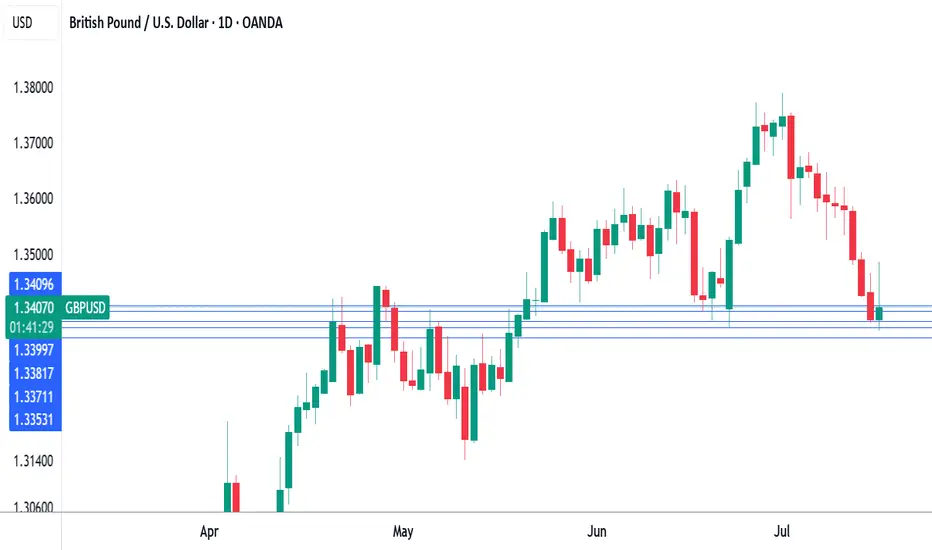
GBPUSD: Price Action at Critical JunctureApproaching a Deciding Level : GBPUSD is currently trading near a critical "Deciding Level" (highlighted in grey) around 1.33927. This zone appears to be a crucial pivot point, where the market will likely determine its next significant move.
Uptrend Line as Dynamic Support : An ascending trendline (light blue) originating from January 2025 has consistently provided dynamic support for the price. The current price action is testing this trendline, making its integrity vital for the continuation of the bullish structure.
Identified First Resistance Level Above : A "1st Resistance Level" (highlighted in red) is clearly marked around 1.36000. This level has proven to be a ceiling for recent upward movements and represents the immediate hurdle for bulls.
Strong First Support Level Below : Below the current price, a "1st Support Level" (highlighted in green) is identified between approximately 1.31000 and 1.32000. This zone previously acted as strong support in late April/early May and could serve as a significant demand area if the price breaks below the "Deciding Level" and the trendline.
Disclaimer:
The information provided in this chart is for educational and informational purposes only and should not be considered as investment advice. Trading and investing involve substantial risk and are not suitable for every investor. You should carefully consider your financial situation and consult with a financial advisor before making any investment decisions. The creator of this chart does not guarantee any specific outcome or profit and is not responsible for any losses incurred as a result of using this information. Past performance is not indicative of future results. Use this information at your own risk. This chart has been created for my own improvement in Trading and Investment Analysis. Please do your own analysis before any investments.

Cable looking for a new high with Ending DiagonalCable found some support in the last 24 hours and it looks like we may still see a retest of the high, so apparently this 5th wave is still in progress but unfolding with an ending diagonal with subwave five on the way up to 1.37–1.38, which could be the key resistance for this reversal pattern. So despite some recovery that is happening right now, we still think that the impulse from January is in late stages, which is also confirmed by divergence on the RSI and overlapping price action that clearly suggests that bulls are losing strength up here.
GH

UK inflation heats up, Pound shrugsThe British pound has stabilized on Wednesday and is trading at 1.3389 in the European session, up 0.07% on the day. This follows a four-day losing streak in which GBP/USD dropped 1.5%. On Tuesday, the pound fell as low as 1.3378, its lowest level since June 23.
Today's UK inflation report brought news that the Bank of England would have preferred not to hear. UK inflation in June jumped to 3.6% y/y, up from 3.4% in May and above the market estimate of 3.4%. This was the highest level since January 2024 and is a stark reminder that inflation is far from being beaten. The main drivers of inflation were higher food and transport prices. Services inflation, which has been persistently high, remained steady at 4.7%. Monthly, CPI ticked up to 0.3% from 0.2%, above the market estimate of 0.2%.
It was a similar story for core CPI, which rose to 3.7% y/y from 3.5% in May, above the market estimate of 3.5%. Monthly, core CPI climbed 0.4%, above 0.2% which was also the market estimate.
The hot inflation report will make it more difficult for the BoE to lower interest rates and the money markets have responded by paring expectations of further rate cuts. Still, expectations are that the BoE will cut rates at the August 7 meeting, with a probability of around 80%, despite today’s higher-than-expected inflation numbers.
The UK releases wage growth on Thursday, which is the final tier-1 event prior to the August meeting. Wage growth has been trending lower in recent months and if that continues in the May reading, that could cement an August rate cut.
Scalp Buy!Hello all. after failed my last position on GBPUSD I think an LBR Move will happen right here and it is time to scalp it. be happy and have a great day(wink)

DeGRAM | GBPUSD broke down the channel📊 Technical Analysis
● Cable’s bounce stalled at the channel base (≈1.3500); price is now carving a bear flag beneath that rail and the prior wedge-break line, signalling failure to regain trend support.
● A 4 h close under 1.3415 confirms channel loss, opening the mid-May pivot 1.3271; flag top at 1.3470 caps risk while lower-high sequence stays intact.
💡 Fundamental Analysis
● Friday’s firm US consumer-sentiment and Fed Gov. Waller’s “no urgency to cut” comments nudged 2-yr yields back toward 4.80 %, reviving dollar demand.
● UK June payrolls contracted for a third month and wage growth cooled, boosting August BoE-cut odds and weighing on sterling.
✨ Summary
Sell 1.3460-1.3490; sustained trade below 1.3415 targets 1.3271. Short view void on a 4 h close above 1.3470.
-------------------
Share your opinion in the comments and support the idea with a like. Thanks for your support!

Will The Prospect of a BoE Rate Cut Continue to Dampen GBPUSD?Macro approach:
- GBPUSD has weakened since last week, pressured by disappointing UK economic data and rising expectations of a BoE rate cut. Meanwhile, the US dollar found support amid cautious risk sentiment and anticipation of key US inflation data.
- UK GDP contracted for a second consecutive month in May, and recent labor market surveys signaled further cooling, reinforcing the case for the BoE's monetary easing. Governor Bailey reiterated that the path for rates is "downward," with markets now pricing in a high probability of a cut at the Aug meeting.
- Meanwhile, the US dollar was buoyed by safe-haven flows and firm inflation expectations ahead of the US CPI release, highlighting policy divergence between the Fed and BoE.
- GBPUSD may remain under pressure as traders await UK inflation and employment data, which could influence the BoE's next move. The pair could see further volatility with US CPI and Fed commentary also on the radar as potential catalysts.
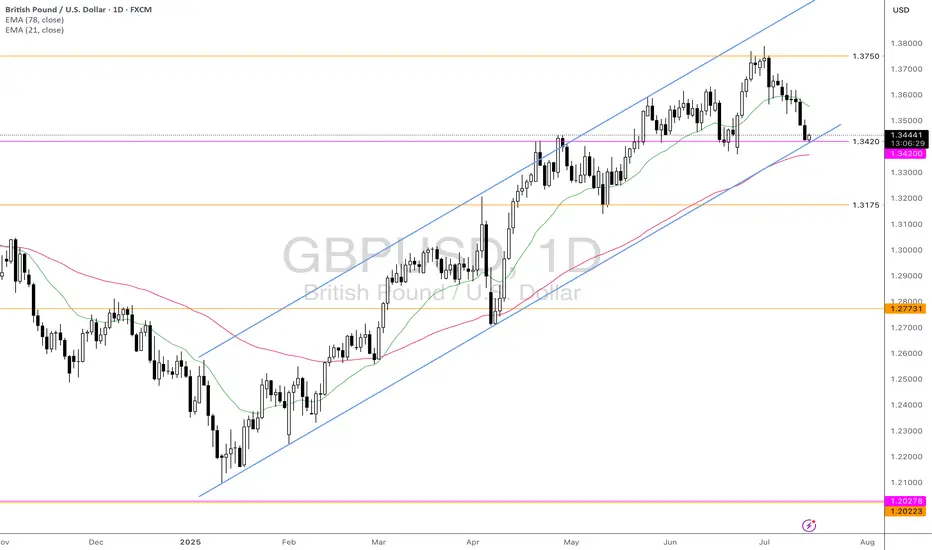
Technical approach:
- GBPUSD is retesting the ascending channel's lower bound, confluence with the key support at 1.3420. The price is between both EMAs, indicating a sideways movement. GBPUSD awaits an apparent breakout to determine the short-term trend.
- If GBPUSD breaches below the support at 1.3420, the price may plunge toward the following support at 1.3175.
- On the contrary, holding above 1.3420 may prompt a short correction to retest EMA21.
Analysis by: Dat Tong, Senior Financial Markets Strategist at Exness
GBPUSD long from last day's lowGBPUSD reached lower than expected. My bias for today is still bullish. I am placing my SL at last day's low. You could target last day's high but I am aiming for a 3R.

GBP/USD – Breakout Confirmation Across TimeframesGBP/USD – Breakout Confirmation Across Timeframes
🔹 Multi-Timeframe Bullish Setup by PULSETRADESFX
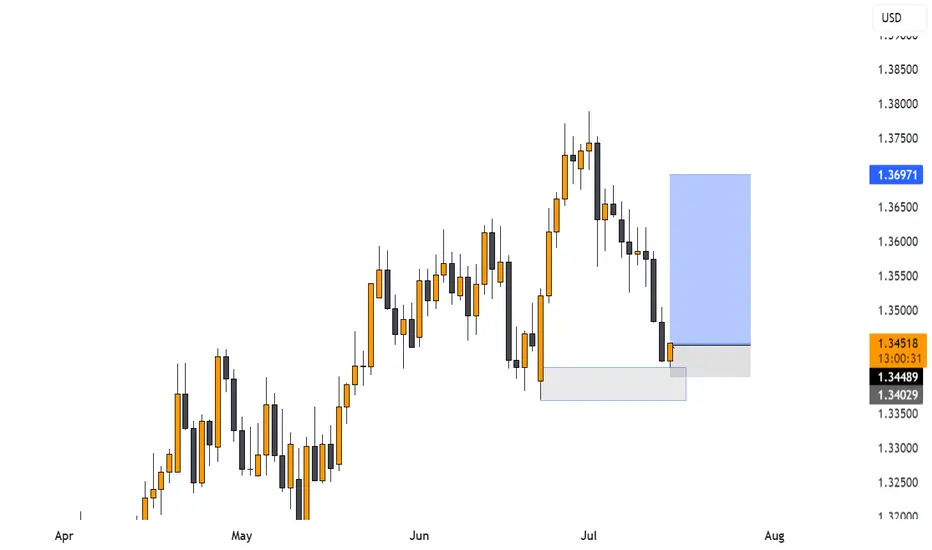
GBP/USD is showing a strong bullish shift after breaking out of a well-defined descending channel. Price reacted perfectly from the 1.33400–1.34060 demand zone and is now pushing above descending trendline resistance across the 2H and 4H charts.
This signals early signs of trend reversal, backed by confluence across intraday and higher timeframes.
📌 Trade Setup Details:
Entry: 1.34530 – 1.34550
SL: 1.34060 (Below demand)
TP: 1.35724 – 1.36000 (Upper supply zone / channel target)
The structure is clean, the R:R is healthy, and momentum favors bulls after multiple rejections at key support.
---
✅ Confluences Supporting the Long:
Descending channel breakout (2H & 4H)
Triple demand zone rejection
Break and close above minor resistance
Clean bullish momentum candle
Economic catalysts ahead (watch USD data releases 📅)
📅 July 18, 2025
📊 FOREX.com | GBP/USD (4H, 2H)
#GBPUSD #Forex #BreakoutTrade #BullishSetup #TechnicalAnalysis #TradingView #PULSETRADESFX

GBPUSDAs I'm looking on GBPUSD we on an uptrend,price broke out a falling wedge structure and created a valid Change Of Character,made a retest and took a buy on London session when the price retraced back to my order block and I took a buy,looking for the price to continue pushing to the upside

GBPUSD H1 I Bullish Bounce Off Based on the H1 chart analysis, we can see that the price is testing our buy entry at 1.3390, which is an overlap support.
Our take profit will be at 1.3439 which is a pullback resistance level.
The stop loss will be placed at 1.3333, which is a multi-swing low support level.
High Risk Investment Warning
Trading Forex/CFDs on margin carries a high level of risk and may not be suitable for all investors. Leverage can work against you.
Stratos Markets Limited (tradu.com ):
CFDs are complex instruments and come with a high risk of losing money rapidly due to leverage. 63% of retail investor accounts lose money when trading CFDs with this provider. You should consider whether you understand how CFDs work and whether you can afford to take the high risk of losing your money.
Stratos Europe Ltd (tradu.com ):
CFDs are complex instruments and come with a high risk of losing money rapidly due to leverage. 63% of retail investor accounts lose money when trading CFDs with this provider. You should consider whether you understand how CFDs work and whether you can afford to take the high risk of losing your money.
Stratos Global LLC (tradu.com ):
Losses can exceed deposits.
Please be advised that the information presented on TradingView is provided to Tradu (‘Company’, ‘we’) by a third-party provider (‘TFA Global Pte Ltd’). Please be reminded that you are solely responsible for the trading decisions on your account. There is a very high degree of risk involved in trading. Any information and/or content is intended entirely for research, educational and informational purposes only and does not constitute investment or consultation advice or investment strategy. The information is not tailored to the investment needs of any specific person and therefore does not involve a consideration of any of the investment objectives, financial situation or needs of any viewer that may receive it. Kindly also note that past performance is not a reliable indicator of future results. Actual results may differ materially from those anticipated in forward-looking or past performance statements. We assume no liability as to the accuracy or completeness of any of the information and/or content provided herein and the Company cannot be held responsible for any omission, mistake nor for any loss or damage including without limitation to any loss of profit which may arise from reliance on any information supplied by TFA Global Pte Ltd.
The speaker(s) is neither an employee, agent nor representative of Tradu and is therefore acting independently. The opinions given are their own, constitute general market commentary, and do not constitute the opinion or advice of Tradu or any form of personal or investment advice. Tradu neither endorses nor guarantees offerings of third-party speakers, nor is Tradu responsible for the content, veracity or opinions of third-party speakers, presenters or participants.

GBP USD longthere is an uncertainty in the market that make it hard to be confident about the situation..
but lets see if it decide to go up it can be a viable setup ...
Please note: This is for educational purposes only and not a trading signal. These ideas are shared purely for back testing and to exchange views. The goal is to inspire ideas and encourage discussion. If you notice anything wrong, feel free to share your thoughts. In the end, to learn is to share !

GBPUSD ANALYSIS From the previous trading day we can see that the pair has been making random up and down movements without a clear direction and even though we rejected a key support area the higher timeframes like daily and weekly still show bearish sentiment right now the best move is to wait

GBP/USD UPTRENDHave price back on support with the overall trend still bullish. On H1 we have a classic QM setup with price coming back to reclaim a block that it once violated. Price has potential to go up if the support level holds

UK employment,wage growth falls, US retail sales shineThe British pound showing limited movement on Thursday. In the North American session, GBP/USD is trading at 1.3406, down 0.09% on the day.
Today's UK employment report pointed to a cooling in the UK labor market. The number of employees on company payrolls dropped by 41 thousand in June after a decline of 25 thousand in May. Still, the May decline was downwardly revised from 109 thousand, easing concerns of a significant deterioration in the labor market.
Wage growth (excluding bonuses) dropped to 5.0% from a revised 5.3%, above the market estimate of 4.9%. The unemployment rate ticked up to 4.7%, up from 4.6% and above the market estimate of 4.6%. This is the highest jobless level since the three months to July 2021.
The latest job data will ease the pressure on the Bank of England to lower rates, as the sharp revision to the May payroll employees means the labor market has not deteriorated as much as had been feared. Still, the employment picture remains weak and the markets are expecting an August rate cut, even though UK inflation was hotter than expected in June.
US retail sales bounced back in June after back-to-back declines. Consumers reacted with a thumbs-down to President Trump's tariffs, which took effect in April and made imported goods more expensive.
The markets had anticipated a marginal gain of just 0.1% m/m in June but retail sales came in at an impressive 0.6%, with most sub-categories recording stronger activity in June. This follows a sharp 0.9% decline in May.
The US tariffs seem to have had a significant impact on retail sales, as consumers continue to time their purchases to minimize the effect of tariffs.
Consumers increased spending before the tariffs took effect and cut back once the tariffs were in place. With a truce in place between the US and China which has slashed tariff rates, consumers have opened their wallets and are spending more on big-ticket items such as motor vehicles, which jumped 1.2% in June.

Long on GBPNear good range of support
Yesterday had good closing near Support
Likely to go long But low volume on Morning star is a concern
Hold - Sitback & Confirm the trendchange
This is just the idea

Raid to the Buyside Liquidity [GBPUSD]Looking at the left side, we see a recent sell-side liquidity sweep . Following, is a strong upward movement, resulting in a market structure shift . Price retraces back to the unmitigated demand zone, to mitigate it for an execution of a Buy position. Target is the buyside liquidity

GBP/USD Daily Outlook: At a Pivotal JunctureLong-Term Trend Dynamics
The Pound-Dollar pair has largely maintained an upward trajectory since April, guided by a robust long-term rising trendline. This enduring bullish structure has consistently provided dynamic support, illustrating a sustained period of higher lows and gradual appreciation over several months.
The Immediate "Deciding Level"
GBP/USD currently finds itself at a critical confluence point, labeled the "Deciding Level." This horizontal zone of significance is being tested precisely where it intersects with the established long-term rising trendline, making the present price action absolutely pivotal for determining the pair's short-term direction.
Potential Downside Acceleration
A decisive break and sustained trading below this "Deciding Level" would signal a significant shift in market sentiment, opening the door for "More immediate Downside." Such a move would likely accelerate the existing bearish momentum (indicated by the steep red downtrend line), with the "1st Support Level" becoming the primary downside target where strong buying interest might re-emerge.
Key Resistance Zones to Watch
Should the "Deciding Level" successfully hold as support, the pair could attempt to reverse its recent decline. Any potential rebound, however, would first encounter resistance from the short-term red downtrend line, followed by the formidable "1st Resistance Level," an overhead supply zone that has historically capped bullish advances.
Disclaimer:
The information provided in this chart is for educational and informational purposes only and should not be considered as investment advice. Trading and investing involve substantial risk and are not suitable for every investor. You should carefully consider your financial situation and consult with a financial advisor before making any investment decisions. The creator of this chart does not guarantee any specific outcome or profit and is not responsible for any losses incurred as a result of using this information. Past performance is not indicative of future results. Use this information at your own risk. This chart has been created for my own improvement in Trading and Investment Analysis. Please do your own analysis before any investments.

GBPUSD(20250717)Today's AnalysisMarket news:
The annual rate of PPI in the United States in June was 2.3%, lower than the expected 2.5%, the lowest since September 2024, and the previous value was revised up from 2.6% to 2.7%. Federal Reserve Beige Book: The economic outlook is neutral to slightly pessimistic. Manufacturing activity declined slightly, and corporate recruitment remained cautious.
Technical analysis:
Today's buying and selling boundaries:
1.3423
Support and resistance levels:
1.3544
1.3499
1.3470
1.3377
1.3348
1.3303
Trading strategy:
If it breaks through 1.3423, consider buying, and the first target price is 1.3470
If it breaks through 1.3377, consider selling, and the first target price is 1.3348

GBPUSD - market structure GBPUSD - market structure , this is a very clean and easy setup, to trade, use risk managment and trade managment for best result
Triangle Formation (Rising wedge STF) I believe we can see some downside here. Price has bounced of the 61.8 fib level and looks to have created a triangle pattern. I’m not currently in any positions, I will wait for a breakout of the rising wedge for a short position.

GBP/USD CONFIRM ANALYSISGBP/USD picks up pace and advances to daily peaks in the 1.3470 zone on the back of the increasing downward pressure on the US Dollar after President Trump asked politicians if he can fire Fed Chief Powell.
