GBPUSD 15M Setup In the 1-hour timeframe, the trend is up and its order block is identified. In the 15-minute timeframe, we wait for the price to reach the desired order block and then the price to rise upwards.
GBPUSD trade ideas

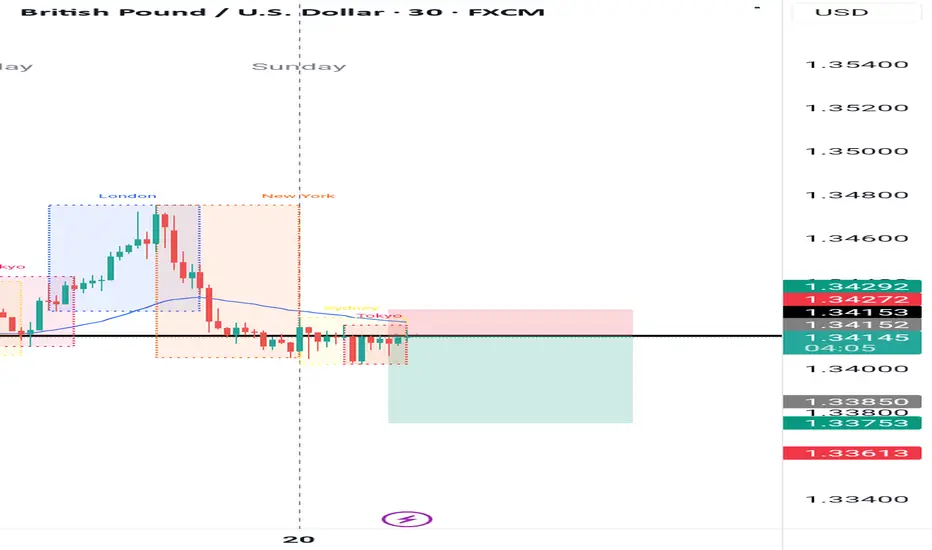
Getting Choppy for the fall ? Or connecting to move UP Again ??Resistance 1 Can touch 1.35900
Resistance 2 Can touch 1.36321
Resistance 3 Can touch 1.37789
Support 1 Can touch 1.34593
Support 2 Can touch 1.34151
Support 3 Can touch 1.33741
Disclaimer:
Trading foreign exchange (Forex) on margin involves a high level of risk and may not be suitable for all investors. The use of leverage can work both for and against you. Before deciding to participate in the Forex market, you should carefully consider your investment objectives, level of experience, and risk tolerance.
There is a possibility that you may incur a loss of some or all of your initial investment, and therefore, you should not invest money that you cannot afford to lose. Be fully aware of all the risks associated with foreign exchange trading, and seek advice from a licensed and independent financial advisor if you have any doubts.
Past performance is not indicative of future results. Always trade responsibly.

GBP/USD PROBABLY !Waiting for confirmation on candles and Real Volume 5min or 15min (power of Real Volume)-without real volume I am like a blind man in a dense forest :)
Tools:
- real volume (proper interpretation)
- Fibonacci expansion ABC (an additional, new goal every day)
- Fibonacci retracement (combined with the real volume, it shows me the real probable movement for the next hours and days)
- volume support and resistance levels (confirmation of the price recovery level)
- oversold/overbought index (focusing on 1H and 4H something is already overvalued or undervalued)
- candlestick patterns (my entry point for 5 minutes or 15 minutes candlestick formations confirmed by particularly increasing volume).

GU 23/07Yesterday our OF changed on the M15 aligning with the H4 trend, I have established H4 as bullish, at the moment in the M15 we have swept a low and broken supply so I want to monitor price as it comes back into my M15 demand in order to look for longs where we start to see LTF OF align with the M15 and H4 trend

GBPUSD H1 I Bearish Reversal Based on the H1 chart analysis, we can see that the price is testing our sell entry at 1.3551, which is an overlap resistance that closes with the 161.8% Fib extension.
Our take profit will be at 1.3499, a pullback support level.
The stop loss will be placed at 1.3584, which is a swing high resistance level.
High Risk Investment Warning
Trading Forex/CFDs on margin carries a high level of risk and may not be suitable for all investors. Leverage can work against you.
Stratos Markets Limited (tradu.com ):
CFDs are complex instruments and come with a high risk of losing money rapidly due to leverage. 66% of retail investor accounts lose money when trading CFDs with this provider. You should consider whether you understand how CFDs work and whether you can afford to take the high risk of losing your money.
Stratos Europe Ltd (tradu.com ):
CFDs are complex instruments and come with a high risk of losing money rapidly due to leverage. 66% of retail investor accounts lose money when trading CFDs with this provider. You should consider whether you understand how CFDs work and whether you can afford to take the high risk of losing your money.
Stratos Global LLC (tradu.com ):
Losses can exceed deposits.
Please be advised that the information presented on TradingView is provided to Tradu (‘Company’, ‘we’) by a third-party provider (‘TFA Global Pte Ltd’). Please be reminded that you are solely responsible for the trading decisions on your account. There is a very high degree of risk involved in trading. Any information and/or content is intended entirely for research, educational and informational purposes only and does not constitute investment or consultation advice or investment strategy. The information is not tailored to the investment needs of any specific person and therefore does not involve a consideration of any of the investment objectives, financial situation or needs of any viewer that may receive it. Kindly also note that past performance is not a reliable indicator of future results. Actual results may differ materially from those anticipated in forward-looking or past performance statements. We assume no liability as to the accuracy or completeness of any of the information and/or content provided herein and the Company cannot be held responsible for any omission, mistake nor for any loss or damage including without limitation to any loss of profit which may arise from reliance on any information supplied by TFA Global Pte Ltd.
The speaker(s) is neither an employee, agent nor representative of Tradu and is therefore acting independently. The opinions given are their own, constitute general market commentary, and do not constitute the opinion or advice of Tradu or any form of personal or investment advice. Tradu neither endorses nor guarantees offerings of third-party speakers, nor is Tradu responsible for the content, veracity or opinions of third-party speakers, presenters or participants.

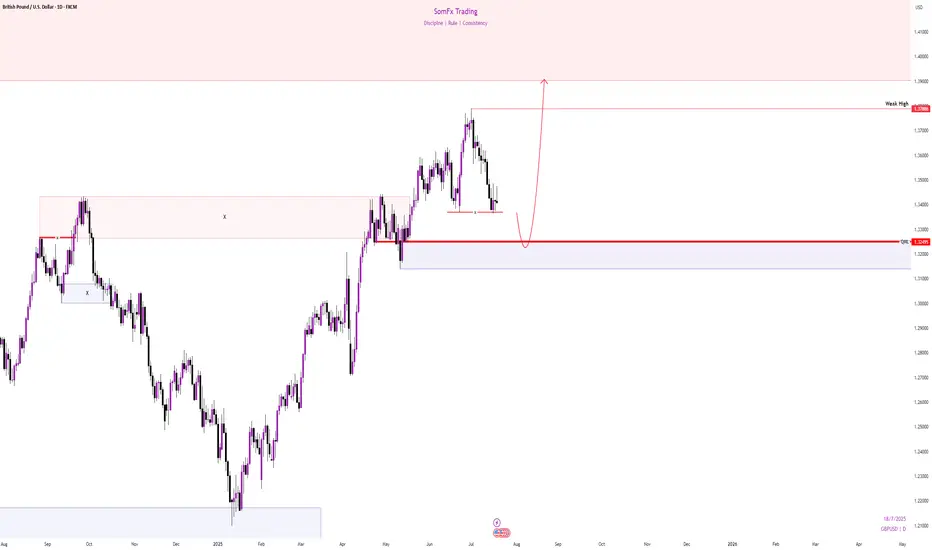
GBPUSD 4H FRAMEWORK.The British pound starts a new trend to the upside after a long fall against the US dollar, but hopes are still short, as this may be a short-lived move for the pound.
Trade Responsibly.

GBPUSDLong opportunity
- broke through 4 hr descending trendline
- you can see CHOCH where the grey dashed box is
- continues bullish now
- order block where blue dashed box is
- bullish candle engulfed the previous bearish candle ( this is where i entered )
- SL below demand zone
- TP at major supply zone

Could the Cable bounce from here?The price is falling towards the pivot, which lines up with the 50% Fibonacci retracement and could bounce to the 1st resistance.
Pivot: 1.3462
1st Support: 1.3402
1st Resistance: 1.3532
Risk Warning:
Trading Forex and CFDs carries a high level of risk to your capital and you should only trade with money you can afford to lose. Trading Forex and CFDs may not be suitable for all investors, so please ensure that you fully understand the risks involved and seek independent advice if necessary.
Disclaimer:
The above opinions given constitute general market commentary, and do not constitute the opinion or advice of IC Markets or any form of personal or investment advice.
Any opinions, news, research, analyses, prices, other information, or links to third-party sites contained on this website are provided on an "as-is" basis, are intended only to be informative, is not an advice nor a recommendation, nor research, or a record of our trading prices, or an offer of, or solicitation for a transaction in any financial instrument and thus should not be treated as such. The information provided does not involve any specific investment objectives, financial situation and needs of any specific person who may receive it. Please be aware, that past performance is not a reliable indicator of future performance and/or results. Past Performance or Forward-looking scenarios based upon the reasonable beliefs of the third-party provider are not a guarantee of future performance. Actual results may differ materially from those anticipated in forward-looking or past performance statements. IC Markets makes no representation or warranty and assumes no liability as to the accuracy or completeness of the information provided, nor any loss arising from any investment based on a recommendation, forecast or any information supplied by any third-party.

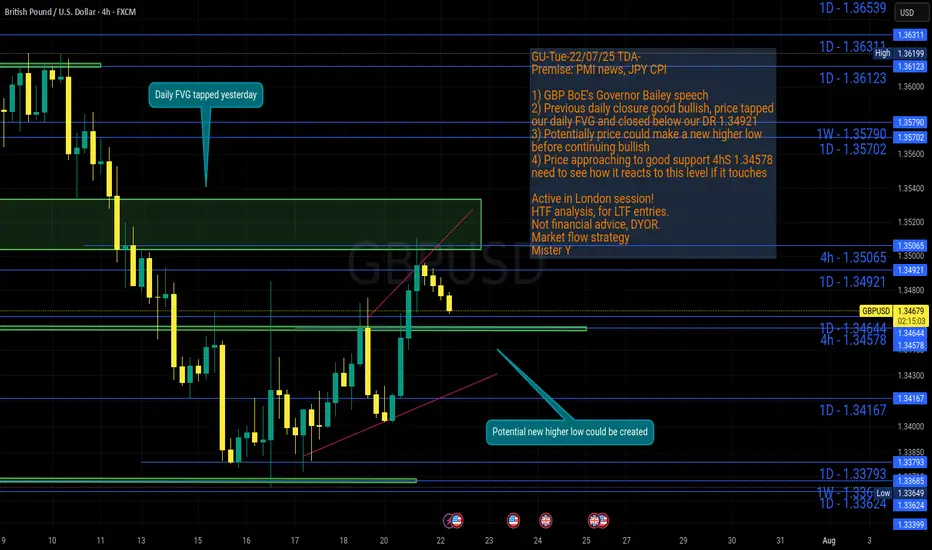
GU-Tue-22/07/25 TDA-Potential new higher low before continue?Analysis done directly on the chart!
Price gave a good bullish closure on daily candle yesterday,
if bullish trend continues, there's a good probability for price
to create a new higher low before continuing up.
Monitor and react to how price move from level to level.
Premise:
A simple idea plan (like Tradingview public posts) won't describe everything.
No one can predict how market will move, it's always good to react to how it moves.
It gives an idea of how price might move, but no one come from FUTURE.
So I always encourage people to openly and actively discuss in real time.
I don't give signals blindly, people should learn
and understand the skill.
Following blindly signals you won't know how to
manage the trade, where precisely put sl and tp,
lot size and replicate the move over time.
That's why you need active real time discussions.
Trading is not get rich quick scheme!
Active in London session!
Not financial advice, DYOR.
Market Flow Strategy
Mister Y
GBP USD longpossible scenario for gbp usd
Please note: This is for educational purposes only and not a trading signal. These ideas are shared purely for back testing and to exchange views. The goal is to inspire ideas and encourage discussion. If you notice anything wrong, feel free to share your thoughts. In the end, to learn is to share !

GBPUSD - Analysis with Order Blocks and Demand ZoneThe GBP/USD market currently shows an upward momentum with prices climbing from a Lower Time Frame (LTF) Demand Zone. Two significant Order Blocks are identified as potential areas for price reaction and entry points. The first Order Block near 1.34564 offers a risk-to-reward ratio of approximately 1.3, while the second, lower Order Block near 1.34350 provides a better risk-to-reward ratio of about 1.5.
Price action indicates a possible retracement to one of these Order Blocks before resuming the upward trend. The ultimate target levels for the bullish movement are marked around 1.35214 and 1.35297, which lie above a recent weak high.
This plan highlights a patient approach, suggesting waiting for price to reach these Order Blocks for optimal entry opportunities with clear risk management levels, aiming to capitalize on the continuation of the bullish trend from the strong LTF Demand Zone.
GBPUSDGBPUSD is in strong bullish trend.
Potentially printing HH and HL.
NO sign of reversal here.
Alligator mouth is full open which shows that rend will continue .
we buy at CMPl.

GBPUSD TRADE IDEA We also analyzed the GBPUSD chart and got a pullback to our Fibonacci level for a continuation trade to the upside....
The market seems to be going in our predicted direction...
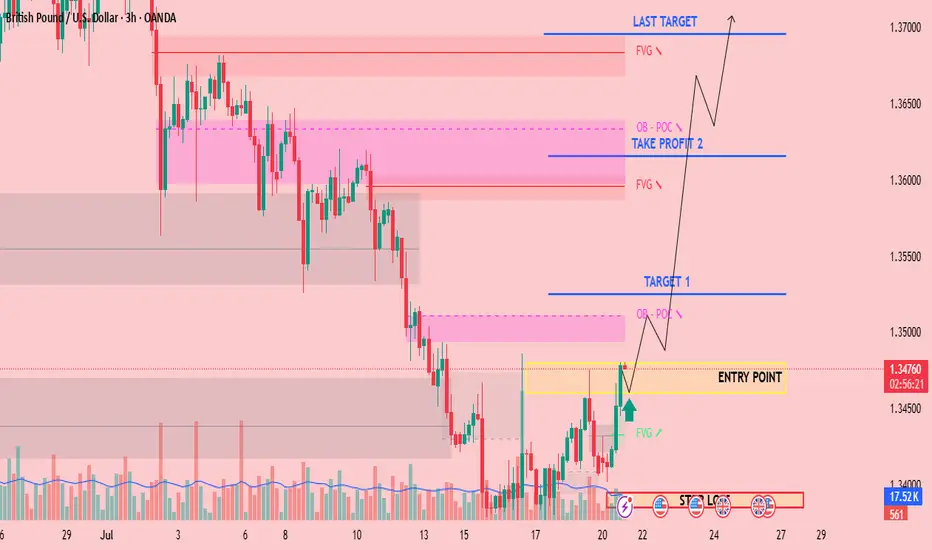
CHECK GBPUSD SIGNAL READ THE CAPTAINEntry Point: Around 1.34800 1.34600
Stop Loss: Around 1.33950
🎯 Target Levels
Take Profit 1:
1.35250
Take Profit 2:
1.36150
last target
1.36950
Pound Pressured by Rising UK Jobless RateGBP/USD started the week steady, trading just above 1.3400 during the Asian session and holding near last week’s two-month low. The US Dollar remains soft below Thursday’s monthly peak, as markets weigh the prospects of a Fed rate cut. Although Fed Governor Waller backed a July cut, most investors expect the Fed to keep rates higher for longer due to Trump’s tariffs impacting consumer prices.
The British Pound is under pressure as markets price in a potential Bank of England rate cut in August. UK labor data showed unemployment rising to 4.7%, a four-year high, and annual pay growth slowing to 5%, the weakest since Q2 2022. This limits GBP/USD upside despite persistent inflation.
For GBP/USD, resistance is seen at 1.3535, with the next levels at 1.3580 and 1.3630. Support stands at 1.3380, followed by 1.3270 and 1.3140.

Sell gbpusd Downtrend trend
Bearish trend
Lower lows
Retracement entry
Start of the week
Use proper risk management
Trump era

GBP/USD Bullish Setup: Targeting 1.35633 and 1.36667This 5-hour chart for GBP/USD shows a bullish trend within an ascending channel. The chart highlights two target zones: the first at 1.35633 and the second at 1.36667. A buy signal is indicated near the 1.34080 support zone, suggesting potential upward movement toward the marked resistance targets.

GBPUSD is in the Selling DirectionHello Traders
In This Chart GBPUSD HOURLY Forex Forecast By FOREX PLANET
today GBPUSD analysis 👆
🟢This Chart includes_ (GBPUSD market update)
🟢What is The Next Opportunity on GBPUSD Market
🟢how to Enter to the Valid Entry With Assurance Profit
This CHART is For Trader's that Want to Improve Their Technical Analysis Skills and Their Trading By Understanding How To Analyze The Market Using Multiple Timeframes and Understanding The Bigger Picture on the Charts

GBPUSD - Bullish Bias with Tactical Short Setup• Pair: GBPUSD (GU)
• Bias: Bullish overall | Tactical short for OB mitigation
• HTF Overview (4H):
• Price broke major highs — clear bullish intent.
• Pullback last week suggests price is targeting 4H SSL for liquidity + OB mitigation before further upside.
• MTF Refinement (30M):
• Price structure currently presents a temporary sell bias.
• BSL has been taken — confirming liquidity sweep.
• Eyeing price to run lower into 4H OB zone.
• LTF Confirmation (5M/1M):
• Waiting on LTF confirmation to ride the move down into the 4H OB.
•Only entering after analysis is complete and CHoCH shows cleanly.
• Entry Zone:
• Tactical short after LTF confirms.
• Final long setup expected from 4H OB after mitigation.
• Targets:
• 30M lows as short-term target.
• 4H OB as the major zone for potential bullish reversal.
• Mindset Note:
• It’s analysis before execution.
• Staying in sync with HTF logic while sniping intraday plays for precision entries.
Bless Trading!

GBPUSD buy current uptrend so ready to take a buy on the current pullback now at dynamic support level and also the 0.618 golden zone fib support level for a double confirmation , I'm looking to buy here , up to next resistance, level of 1.34458 where we could see a take profit area 👍 this is not financial advice only an idea 🤔

GBPUSD Big Bullish Move incoming.GGBPUSD as trending to the upside quite a few months, breaking above 1.3450 leaving behind a Trapped zone for the sellers which is weekly Flip level which happened right before the breaking up and also the market created a liquidity Zone which is intended to further Trap the the seller, and it is acting as a Double Bottom area, i hope sellers will be trapped the next week and righ after that we look for our bullish positions.
GBPUSD BUYGBP/USD rises to near 1.3450 due to improved market sentiment, UoM Consumer Sentiment eyed
GBP/USD gains ground after registering small losses in the previous session, trading around 1.3440 during the Asian hours on Friday. The pair appreciates as the US Dollar edges lower due to dovish remarks from the Federal Reserve officials.
The Relative Strength Index (RSI) indicator on the 4-hour chart stays below 40, reflecting bearish conditions for GBP/USD. The Fibonacci 61.8% retracement level of the latest uptrend seems to have formed a pivot level at 1.3400.
In case GBP/USD fails to stabilize above 1.3400, technical sellers could remain interested. In this scenario, 1.3300 (Fibonacci 78.6% retracement) and 1.3275 (100-day Simple Moving Average) could be seen as next support levels. On the upside, resistance levels could be spotted at 1.3470 (Fibonacci 50% retracement), 1.3500 (static level, round level) and 1.3540 (Fibonacci 38.2% retracement).
TP 1 1.34403
TP 2 1.34859
TP 3 1.35407
RESISTANCE 1.33627
