GBPUSD Long, 07 JulyAsia Fill Setup
This is a pure Asia Fill trade, backed by recent bullish LTF structure and a clean reaction from a 15m decisional OB. Although HTF isn’t perfectly aligned for longs, the momentum and intraday structure make this setup valid.
📍 Entry: 1m BOS from 15m OB, refined entry from 1m OB
📈 Confluence: Trend, structure, and Asia high as a clear target
🔁 Risk: SL doesn’t fully cover the OB, but BOS + clean reaction justifies the entry
🎯 Target: Asia High (1:3 RR), with BE secured quickly if price moves favorably
Not a perfect setup HTF-wise, but strong intraday alignment makes it worth the shot.
GBPUSD trade ideas

The Day Ahead Data Highlights:
China Foreign Reserves (June):
China's FX reserves data will be closely watched for signs of capital outflows or PBoC intervention, especially amid ongoing yuan stability efforts and recent volatility in global markets.
Japan Labor Cash Earnings & Economic Indices (May):
Labor cash earnings are a key wage inflation indicator. Any upside surprise could fuel speculation around BoJ normalization. The leading and coincident indices will offer insight into Japan's near-term growth trajectory, particularly in the context of subdued domestic demand.
Germany Industrial Production (May):
As a bellwether for the Eurozone, this release will help assess the strength of Germany’s industrial rebound. Weakness could reinforce concerns about stagnation in Europe’s largest economy, especially given recent soft factory orders.
Eurozone Retail Sales (May):
Consumer spending remains critical for the ECB’s policy path. This data will provide clues on household demand resilience amid still-high core inflation and restrictive policy settings.
Sweden CPI (June):
A key input for Riksbank policy. Any persistent inflationary pressure may challenge the case for further rate cuts, especially as the central bank navigates a weak krona and external pressures.
Central Bank Speakers:
ECB’s Nagel and Holzmann:
Both are considered hawkish members. Their commentary will be scrutinized for signals on the timing and pace of additional rate cuts following June’s initial move. Markets will be sensitive to any shift in tone on inflation persistence or the economic outlook.
Implications:
The day is rich in second-tier but thematically important data that could shape regional monetary policy expectations.
The euro and European rates markets may see modest volatility depending on German IP and ECB commentary.
Japanese wage data could revive BoJ tightening bets if stronger than expected.
China’s reserve position may reflect broader macro-policy adjustments ahead of key summer policy meetings.
This communication is for informational purposes only and should not be viewed as any form of recommendation as to a particular course of action or as investment advice. It is not intended as an offer or solicitation for the purchase or sale of any financial instrument or as an official confirmation of any transaction. Opinions, estimates and assumptions expressed herein are made as of the date of this communication and are subject to change without notice. This communication has been prepared based upon information, including market prices, data and other information, believed to be reliable; however, Trade Nation does not warrant its completeness or accuracy. All market prices and market data contained in or attached to this communication are indicative and subject to change without notice.
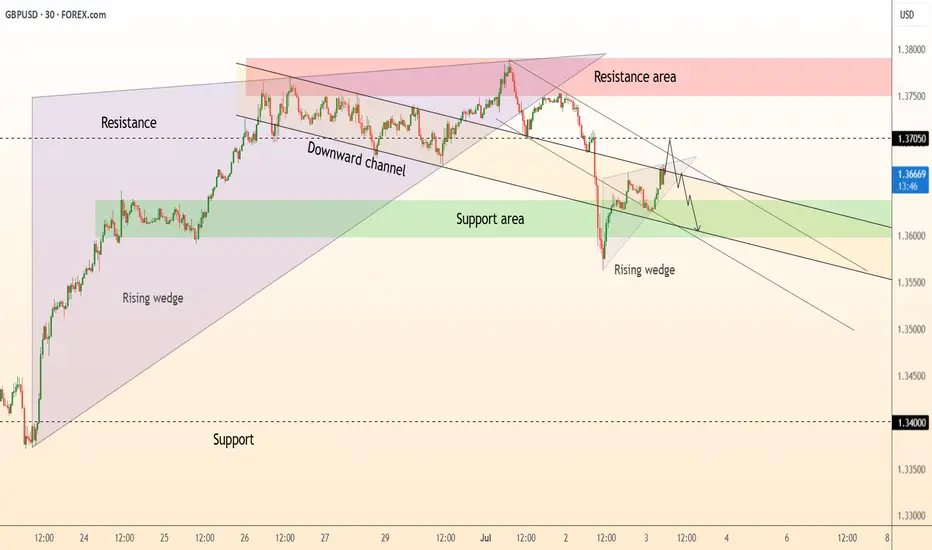
DeGRAM | GBPUSD will continue to correct📊 Technical Analysis
● Price retests the broken wedge-base & channel roof ≈ 1.370 inside a confluence resistance zone (pink). Lower-highs into this cap form a bear flag pointing toward 1.360.
● Intraday rising-wedge has already cracked; projected width and the broader descending channel intersect 1.352-1.355, reinforcing downside targets.
💡 Fundamental Analysis
● Softer UK PMI prices and pre-election caution keep BoE-cut probabilities elevated, while a stronger US JOLTS print plus hawkish FOMC minutes underpin the dollar, favouring renewed GBP/USD pressure.
✨ Summary
Fade rallies 1.368-1.372; slide below 1.360 unlocks 1.355 then 1.343. Bear thesis invalid on a 30 min close above 1.374.
-------------------
Share your opinion in the comments and support the idea with a like. Thanks for your support!
GBPUSDThe market structure on GBPUSD shows a clear liquidity sweep above recent highs, followed by a market structure shift (MSS) to the downside, signaling a potential reversal. After the liquidity grab, price failed to sustain above the swept highs and started to form lower highs.
The RSI indicator also confirms a bearish divergence, strengthening the bearish bias. Currently, price is consolidating below the MSS level, which could act as a supply zone on any retest.
A strong bearish continuation is expected, targeting the SSL (Sell-side Liquidity) level marked below, which aligns with a potential demand zone from late June. The bearish projection suggests a move toward the 1.3350–1.3400 area.
This setup favors short opportunities on lower timeframe pullbacks, maintaining a bearish outlook as long as the price remains below the MSS.

GBP/USD Pair Analysis📈 GBP/USD Pair Analysis – Monday, July 7, 2025
1️⃣ The pair is moving within an ascending price channel, indicating a continued positive trend in the medium term.
2️⃣ Strong demand areas have been identified on the larger time frames, which are expected to support the price in the event of a decline to these areas.
3️⃣ The MACD indicator is oversold, increasing the possibility of a rebound and upward movement from the current or nearby areas.
📌 Summary and Recommendations:
🔹 General Trend: Upward
🔸 The price is currently making a temporary downward correction.
✅ We expect the pair to rise again towards the upper limit of the price channel, provided it holds above the specified demand areas.
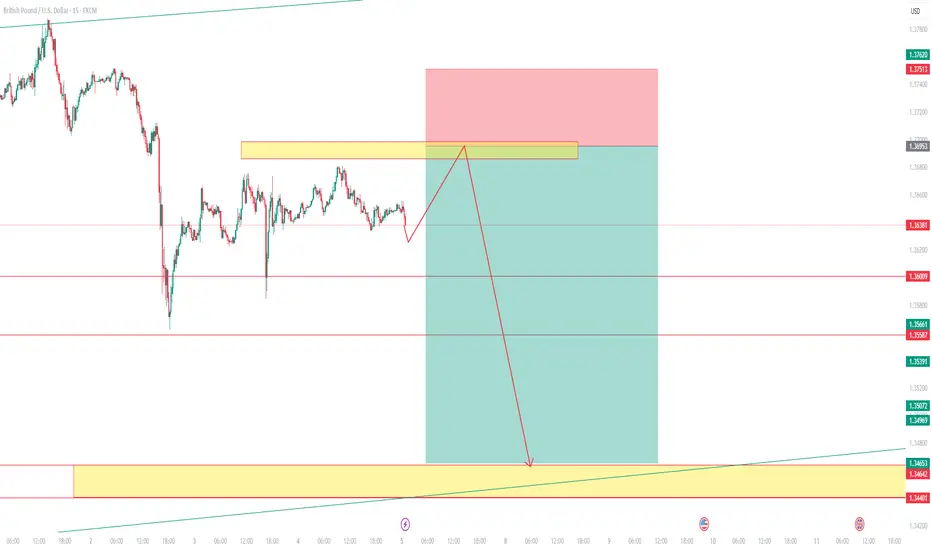
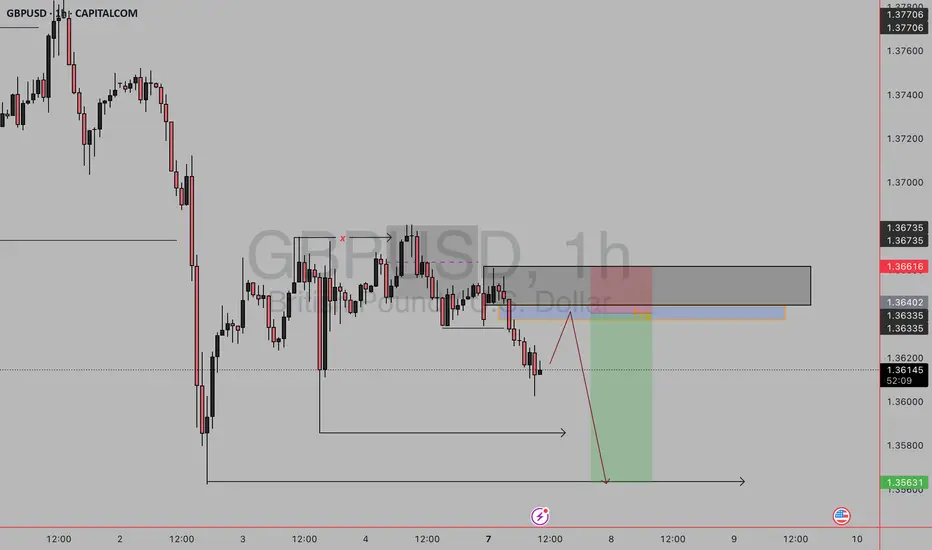
gbpusd sell setup🧠 Setup Summary:
You're anticipating a retracement into a supply zone (marked by the grey box) which contains a Fair Value Gap (FVG) before continuing the bearish move.
🧩 Key Components:
Supply Zone (Grey Box):
A previously mitigated zone where price dropped aggressively.
Likely institutional sell orders remain there.
Fair Value Gap (Orange Zone):
Price moved away fast and left an imbalance.
Your expectation: Price will return here, fill it, and then drop.
Entry Plan:
Sell when price taps into FVG or upper supply zone around 1.36420 – 1.36616.
Confirmation could be a bearish engulfing, liquidity sweep, or BOS on LTF.
Stop Loss: Above the supply zone — around 1.36680.
Take Profit (TP): A major low, likely 1.35631.
Risk-Reward: Strong RR (likely 1:3+), in line with institutional-style trading
GU-Mon-07/07/25 TDA-Good support zone,but possible sell continueAnalysis done directly on the chart
Follow for more, possible live trades update!
I often share my live trades in Tradingview public chat in London session, stay tuned!
A simple idea plan (like Tradingview public posts) won't describe everything.
No one can predict how market will move, it's always good to react to how it moves.
It gives an idea of how price might move, but no one come from FUTURE.
So I always encourage people to openly and actively discuss in real time.
I don't give signals blindly, people should learn
and understand the skill.
Following blindly signals you won't know how to
manage the trade, lot size and replicate the move
over time.
That's why you need active real time discussions.
Trading is not get rich quick scheme!
Active in London session!
Not financial advice, DYOR.
Market Flow Strategy
Mister Y

we wait patiently while eating graduallycheck my previous post to see a comprehensive explanation of why i took this trade in the first place

GBP/USD BEARS ARE STRONG HERE|SHORT
Hello, Friends!
GBP/USD pair is in the uptrend because previous week’s candle is green, while the price is clearly rising on the 3H timeframe. And after the retest of the resistance line above I believe we will see a move down towards the target below at 1.358 because the pair overbought due to its proximity to the upper BB band and a bearish correction is likely.
Disclosure: I am part of Trade Nation's Influencer program and receive a monthly fee for using their TradingView charts in my analysis.
✅LIKE AND COMMENT MY IDEAS✅

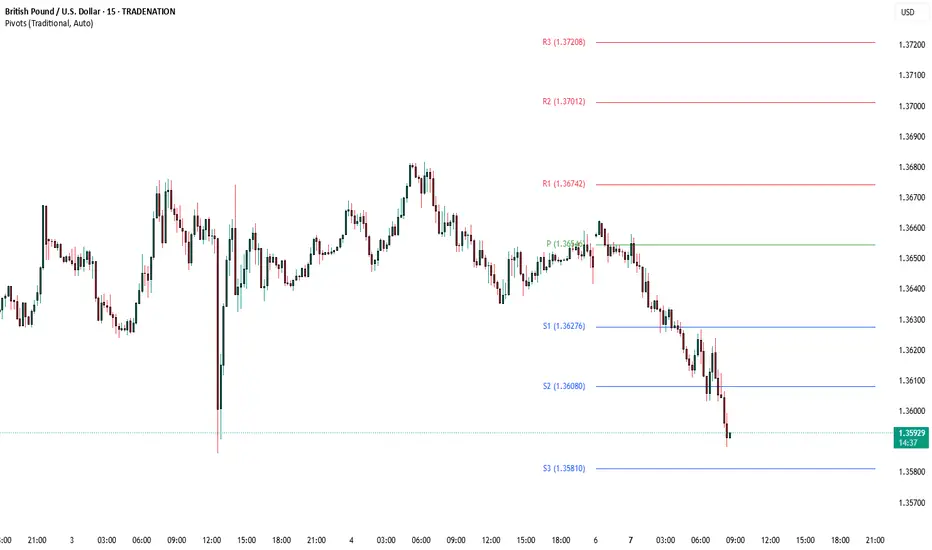
Bullish continuation?The Cable (GBP?USD) is falling towards the pivot and could bounce to the 1st resistance.
Pivot: 1.3426
1st Support: 1.3170
1st Resistance: 1.3758
Risk Warning:
Trading Forex and CFDs carries a high level of risk to your capital and you should only trade with money you can afford to lose. Trading Forex and CFDs may not be suitable for all investors, so please ensure that you fully understand the risks involved and seek independent advice if necessary.
Disclaimer:
The above opinions given constitute general market commentary, and do not constitute the opinion or advice of IC Markets or any form of personal or investment advice.
Any opinions, news, research, analyses, prices, other information, or links to third-party sites contained on this website are provided on an "as-is" basis, are intended only to be informative, is not an advice nor a recommendation, nor research, or a record of our trading prices, or an offer of, or solicitation for a transaction in any financial instrument and thus should not be treated as such. The information provided does not involve any specific investment objectives, financial situation and needs of any specific person who may receive it. Please be aware, that past performance is not a reliable indicator of future performance and/or results. Past Performance or Forward-looking scenarios based upon the reasonable beliefs of the third-party provider are not a guarantee of future performance. Actual results may differ materially from those anticipated in forward-looking or past performance statements. IC Markets makes no representation or warranty and assumes no liability as to the accuracy or completeness of the information provided, nor any loss arising from any investment based on a recommendation, forecast or any information supplied by any third-party.

GBP/USD - Channel BreakoutThe GBP/USD pair on the M30 timeframe presents a Potential Buying Opportunity due to a recent Formation of a Breakout Pattern. This suggests a shift in momentum towards the upside and a higher likelihood of further advances in the coming hours.
Possible Long Trade:
Entry: Consider Entering A Long Position around Trendline Of The Pattern.
Entry: 1.36498
Stop Loss: 1.36245
Take Profit: 1.37596

GBPUSD H4 I Bearish Reversal Off Based on the H4 chart, the price is approaching our sell entry level at 1.3691, a pullback resistance.
Our take profit is set at 1.3532, a pullback support that aligns with the 61.8% Fib retracement.
The stop loss is set at 1.3790, a swing high resistance.
High Risk Investment Warning
Trading Forex/CFDs on margin carries a high level of risk and may not be suitable for all investors. Leverage can work against you.
Stratos Markets Limited (tradu.com ):
CFDs are complex instruments and come with a high risk of losing money rapidly due to leverage. 63% of retail investor accounts lose money when trading CFDs with this provider. You should consider whether you understand how CFDs work and whether you can afford to take the high risk of losing your money.
Stratos Europe Ltd (tradu.com ):
CFDs are complex instruments and come with a high risk of losing money rapidly due to leverage. 63% of retail investor accounts lose money when trading CFDs with this provider. You should consider whether you understand how CFDs work and whether you can afford to take the high risk of losing your money.
Stratos Global LLC (tradu.com ):
Losses can exceed deposits.
Please be advised that the information presented on TradingView is provided to Tradu (‘Company’, ‘we’) by a third-party provider (‘TFA Global Pte Ltd’). Please be reminded that you are solely responsible for the trading decisions on your account. There is a very high degree of risk involved in trading. Any information and/or content is intended entirely for research, educational and informational purposes only and does not constitute investment or consultation advice or investment strategy. The information is not tailored to the investment needs of any specific person and therefore does not involve a consideration of any of the investment objectives, financial situation or needs of any viewer that may receive it. Kindly also note that past performance is not a reliable indicator of future results. Actual results may differ materially from those anticipated in forward-looking or past performance statements. We assume no liability as to the accuracy or completeness of any of the information and/or content provided herein and the Company cannot be held responsible for any omission, mistake nor for any loss or damage including without limitation to any loss of profit which may arise from reliance on any information supplied by TFA Global Pte Ltd.
The speaker(s) is neither an employee, agent nor representative of Tradu and is therefore acting independently. The opinions given are their own, constitute general market commentary, and do not constitute the opinion or advice of Tradu or any form of personal or investment advice. Tradu neither endorses nor guarantees offerings of third-party speakers, nor is Tradu responsible for the content, veracity or opinions of third-party speakers, presenters or participants.

GBPUSD UPDATE (NICE CHART)Hello friends
Given the failure of the pain and the strong growth of the price, you can see that the price is in correction, which is a good opportunity for safe purchases at the indicated support points, of course with capital and risk management...
*Trade safely with us*

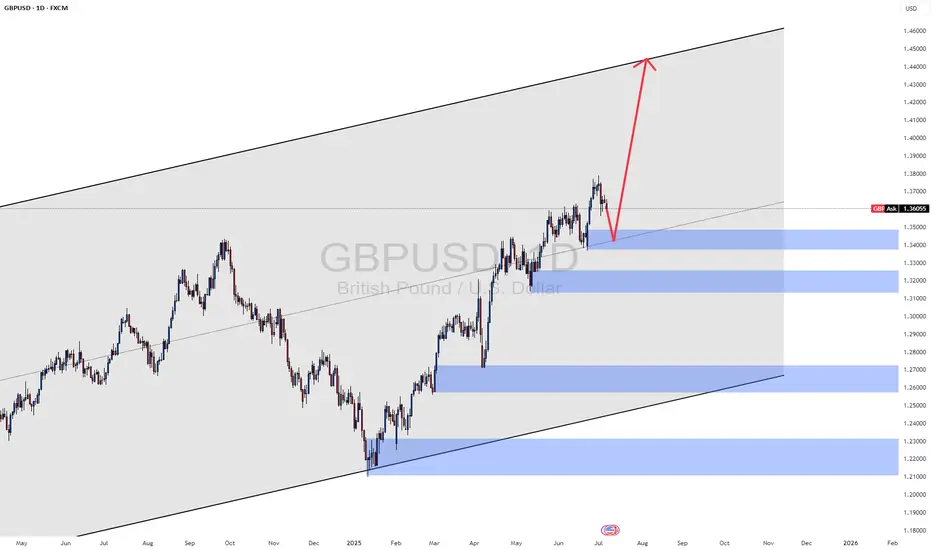
GBP/USD Pulls Back After Rejection – Buyers Eye Lower LevelsHi everyone,
GBP/USD failed to break above the 1.37500 level and saw a rejection from that resistance, dropping further below the 1.36850 support. Since then, price has consolidated and ranged beneath this level.
Looking ahead, if price remains within this range, we anticipate a move lower to find buying interest between the 1.35300 and 1.34600 levels, which could set the stage for another push higher.
As previously noted, a decisive break above 1.37500 would renew our expectation for further upside, with the next key target around 1.38400. We'll be monitoring price action closely to see how it unfolds.
We’ll continue to provide updates on the projected path for GBP/USD as price approaches this target.
The longer-term outlook remains bullish, and we expect the rally to continue extending further from the 1.20991 January low towards 1.40000 and 1.417000.
We’ll be keeping you updated throughout the week with how we’re managing our active ideas. Thanks again for all the likes/boosts, comments and follows — we appreciate the support!
All the best for the week ahead. Trade safe.
BluetonaFX

GBPUSD SetupWould take a sell once price gets to my POI, make sure you make your own Research's before entering.

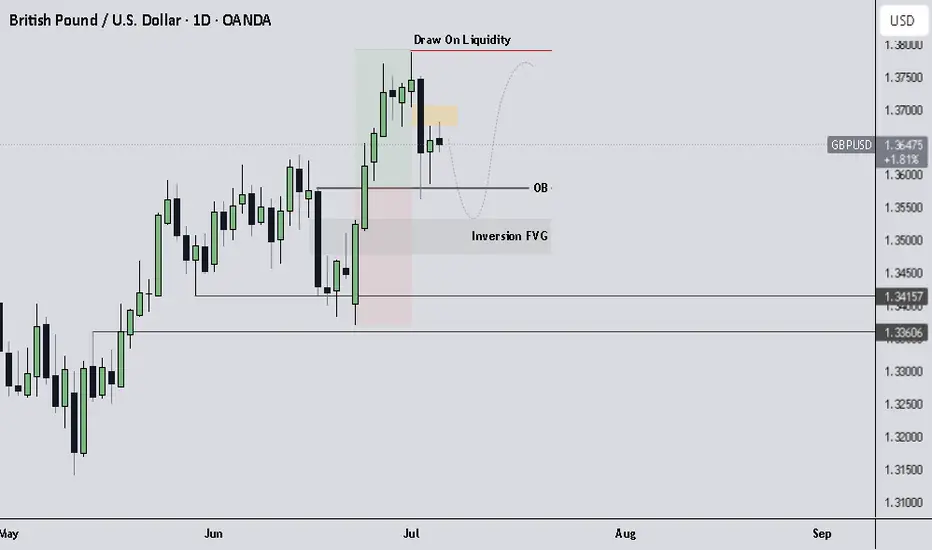
GBPUSD Outlook.Multi-Timeframe Context
Weekly Timeframe
Price is currently sitting on a weekly bullish Order Block (OB).
This higher timeframe demand zone provides the foundation for my bullish bias.
As long as price holds above this OB, I expect continuation to the upside.
🔹 Daily Timeframe
Dropping down to the Daily, we are currently hovering near the 50% level of the Daily dealing range.
Between 01/07/2025 and 03/07/2025, a clear Sell-side Imbalance Buy-side Inefficiency (SIBI) was formed.
This SIBI may act as a short-term bearish pressure, likely to cause a retracement.
📉 Short-Term Expectation
Expecting price to retrace lower, possibly into the midpoint of the Daily bullish OB, which aligns neatly with the Inversion Fair Value Gap (IFVG).
This would create a premium-to-discount transition, ideal for reaccumulation before a continuation move higher.
🔁 Support Array
Weekly OB = long-term bullish demand.
Daily OB midpoint + IFVG confluence = key re-entry or continuation area.
Watching for bullish confirmation once price rebalances through SIBI and taps deeper into discount.
🎯 Target Remains
Draw on Liquidity above 1.37800.
Ultimate target: 1.4000 psychological + structural level.
GBPUSD THIS WEEKGBPUSD this week going in level 61.8-70.2-79 or OTE and going for Sell in OB Daily.
RR 1:4 and Stoploss is above OB
Weekly hat 2 candle bearish and Daily it is Market structur shift for Bearish
Price going for retracment Fib and SELL
ALL this analysis its only my opinion not your to trade
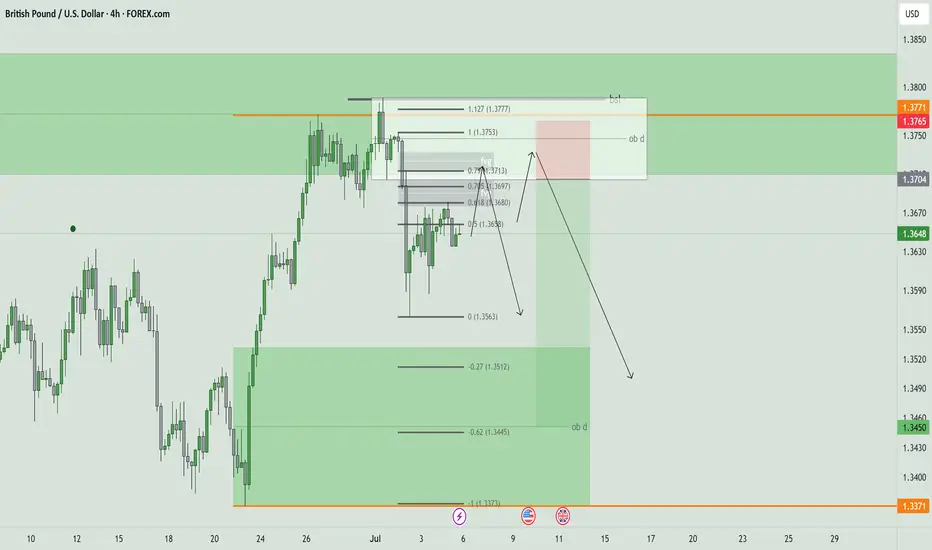
GBPUSD : New-Week Technical Bias (Market Open)
Multi-Timeframe Structural Outlook:
Higher Timeframes (M,W,D): In Ascend Sequence sweeping major liquidity levels
4H Structural & Liquidity Picture:
Trend Signature Shift (TSS):
A clean TSS followed the Sweep Event, shifting internal structure bearish and signaling short-term vulnerability.
Trap Vectors & Liquidity Mechanics:
Price engineered multiple Trap Vectors (TV), both pre- and post-rejection. Further anticipated TV zones exist just above and below current price level at 1.37138 and 1.35630 respectively aligning with Fibonacci retracement confluence.
Key Support Zone:
Price Base between 1.35796 – 1.36200 remains pivotal. Sustained hold here suggests possible short-term recovery; decisive break below exposes deeper liquidity pools toward the lower fib levels and potentially the Range Low (RL) at 1.33704.
Decision Zones:
Upside Consideration:
Recovery above 1.36200 with structural confirmation may reclaim bullish intent, though a retest/ break of the RH at 1.37888 remains the higher timeframe liquidity magnet.
Downside Consideration:
Breakdown below the Price Base accelerates sell-side targets toward the anticipated TV zones and deeper fib levels, with full invalidation exposing the RL.
Summary:
Bearish short-term lean favored following the TSS, but Price Base support remains a critical decision point. Break below confirms deeper sell-side exploration; sustained defense reopens bullish continuation/corrective potential.

GBP/USD H4 AnlysisPrice appears to be correcting the huge bullish impulse move which originated on 23rd June 2025 and ended on 1st July 2025.
We have already seen an impulse from the sellers after price peaked at 1.37887 at the beginning of the month.
Current price action is taking the form of a correction and there is the potential of another move down.
If you agree with this analysis, look for a trade that meets your strategy rules.

GBPUSD Buy Outlook!Soon,the market will be opened,let's see what the GBPUSD will present to us.
Buy View 📊📊

GBPUSD Bearish ContinuationEntering a new week, GBPUSD looks to retest support at 1,35. It looks as though price is printing a bearish flag pattern , let us observe what happens on Monday

GBPUSDGBPUSD also needs one more push up once the correction is completed. Correction needs more time, perhaps this week drop and next week more upside.
Disclosure: We are part of Trade Nation's Influencer program and receive a monthly fee for using their TradingView charts in our analysis.

GBPUSD -SHort TGT 1.3464GBPUSD is expected to hit long. However the pair will retrace to 1.3464 before futher long move.