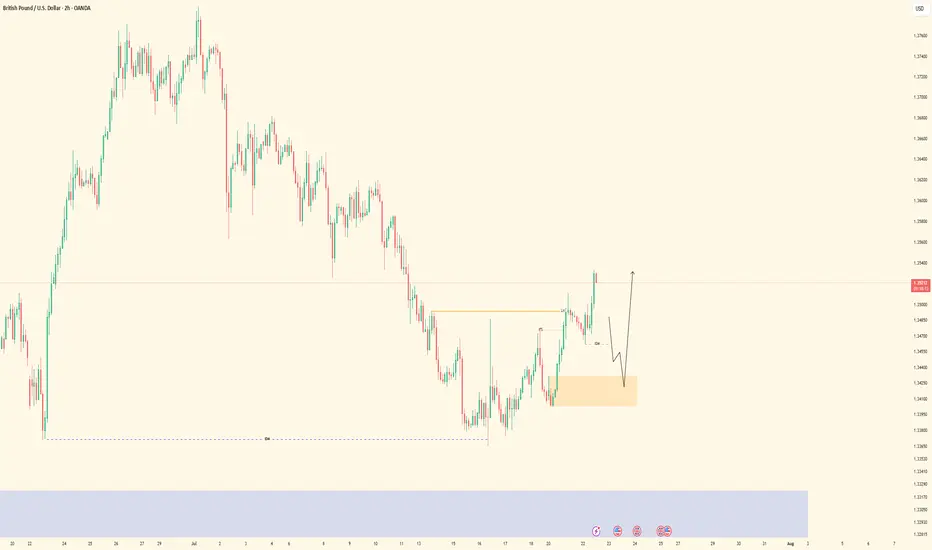
GBPUSD| Bullish Structure Intact - Waiting on BSL SweepPair: GBPUSD
Bias: Bullish
Been following price closely while staying in analysis mode — no rush.
Recent structure remains intact and aligned to the upside. Now waiting for a clean BSL sweep to clear liquidity before looking for LTF confirmations to engage in buys.
Momentum is there, structure is clean — I just need price to do its part.
Staying patient. Still in sync.
#GBPUSD #SMC #bullishstructure #orderflow #inducementking #smartmoneytrader
Bless Trading!
GBPUSD trade ideas
Sterling Rebounds But Faces Heavy Resistance Ahead GBP/USD Outlook – Sterling Rebounds But Faces Heavy Resistance Ahead
🌐 Macro Insight – UK Labour Data Mixed, Trump Headlines Stir Market
The British Pound (GBP) regained some lost ground against the U.S. Dollar after the UK labour market data revealed mixed signals:
Wage growth cooled as expected, suggesting a potential easing in inflationary pressures.
UK ILO Unemployment ticked up to 4.7%, raising concerns about labour market fragility.
Meanwhile, in the U.S., President Trump denied reports about firing Fed Chair Powell, briefly easing tensions and stabilizing USD demand.
With both currencies facing mixed narratives, GBP/USD is set for a pivotal move, and traders should stay alert to key liquidity zones and order blocks.
🔍 Technical Setup – MMF + Smart Money Framework
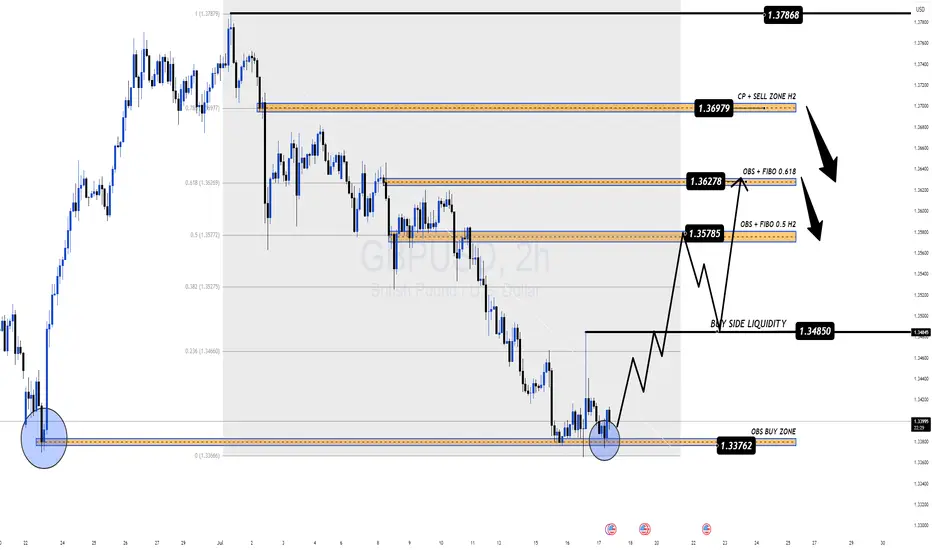
On the H2 chart, GBP/USD has reacted from the OBS BUY ZONE at 1.3376, bouncing with a bullish structure and forming a potential continuation pattern. Price is now expected to target key zones above, where significant order blocks and Fibonacci confluence reside.
⚙️ Key Resistance Zones:
1.3578 – 0.5 Fibonacci Retracement + OBS
1.3627 – 0.618 Fibonacci + Supply Zone
1.3697 – CP Continuation Pattern + H2 Order Block
These areas represent institutional interest for potential sell setups.
✅ Trade Plan for GBP/USD
🟢 BUY ZONE: 1.3376 – 1.3398
SL: 1.3360
TP: 1.3450 → 1.3485 → 1.3530 → 1.3578 → 1.3627
Look for bullish structure confirmation before entering. Target the next liquidity highs and imbalance zones.
🔴 SELL ZONE: 1.3627 – 1.3697
SL: 1.3735
TP: 1.3580 → 1.3530 → 1.3480
Watch for rejection and bearish divergence at supply areas to time potential swing shorts.
🧠 Strategy Notes
This setup combines MMF zones with institutional volume and price action concepts. The pair is currently reacting to a deep discount zone and may climb toward premium levels where selling pressure awaits. Be cautious during New York session volatility, especially with potential U.S. policy headlines and upcoming global inflation data.
🗨 What’s Next?
Are bulls ready to reclaim control or will resistance zones cap this recovery? Drop your ideas below and don’t forget to follow for more institutional-grade insights powered by MMF methodology.
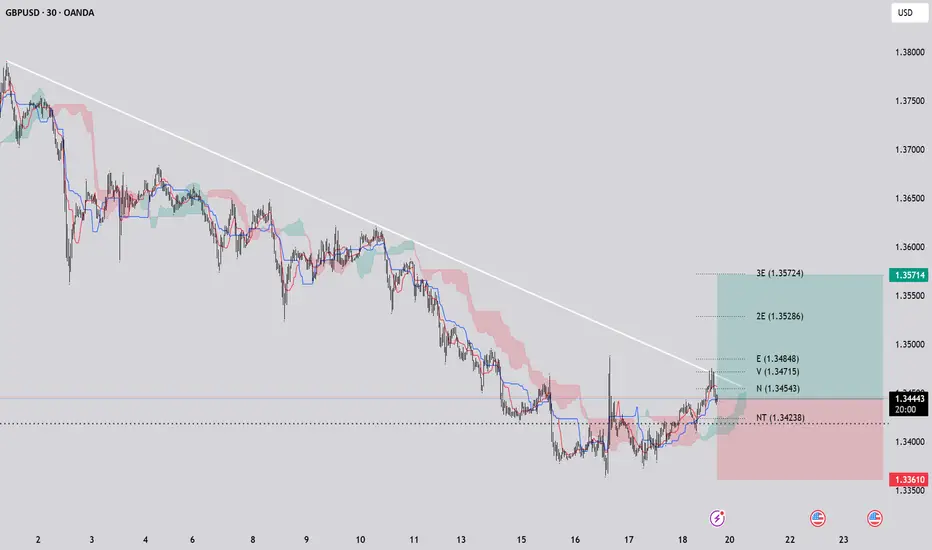
GBPUSD-M30-LONGIf the price breaks above the trendline, it could signal a reversal or a strong bullish momentum. In this scenario, the price may aim to test the nearest identified targets, which are marked as horizontal levels on the chart. These targets include zones around the upper boundaries of the shaded areas, potentially reaching the levels indicated by the upper trendline touchpoints or the previous highs within the observed range. The break's strength and accompanying volume would be key factors in determining whether these targets are realistically achievable.
If you like, please hint.
GBPUSD BUYGBP/USD trims some gains, back to the sub-1.3500 area
On Monday, GBP/USD recovered some of its recent losses and rose to multi-day highs over the 1.3500 yardstick, just to deflate a tad afterwards. The improving market sentiment makes it harder for the Greenback to find demand at the start of the week, allowing Cable to regain some lost balance.
GBP/USD pulled away from the 20-period Simple Moving Average (SMA) on the 4-hour chart after fluctuating at around that level earlier in the day and the Relative Strength Index (RSI) indicator rose above 50, highlighting a loss of bearish momentum.
Looking north, the first resistance level could be spotted 1.3470 (Fibonacci 50% retracement, 50-period SMA) ahead of 1.3500 (static level, round level) and 1.3540 (Fibonacci 38.2% retracement). On the downside, support levels could be seen at 1.3400-1.3390 (round level, Fibonacci 61.8% retracement) and 1.3300 (Fibonacci 78.6% retracement).
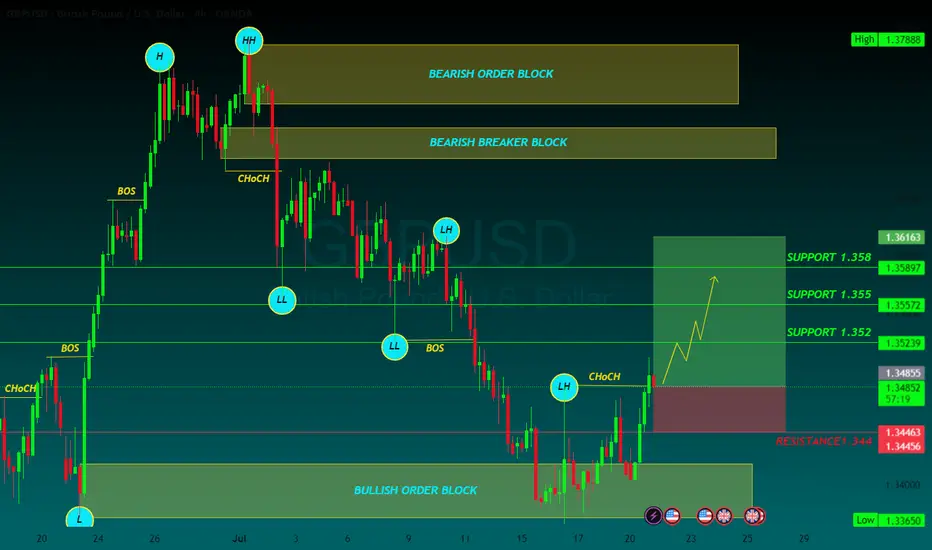
SUPPORT 1.352
SUPPORT 1.355
SUPPORT 1.358
RESISTANCE 1.344
GBPUSD H4 Bullish Reversal Based on the H4 chart analysis, the price is approaching our buy entry level at 1.3404, a pullback support that aligns with the 50% Fib retracement.
Our take profit is set at 1.3555, a pullback resistance.
The stop loss is placed at 1.3404, a swing low support.
High Risk Investment Warning
Trading Forex/CFDs on margin carries a high level of risk and may not be suitable for all investors. Leverage can work against you.
Stratos Markets Limited (tradu.com ):
CFDs are complex instruments and come with a high risk of losing money rapidly due to leverage. 63% of retail investor accounts lose money when trading CFDs with this provider. You should consider whether you understand how CFDs work and whether you can afford to take the high risk of losing your money.
Stratos Europe Ltd (tradu.com ):
CFDs are complex instruments and come with a high risk of losing money rapidly due to leverage. 63% of retail investor accounts lose money when trading CFDs with this provider. You should consider whether you understand how CFDs work and whether you can afford to take the high risk of losing your money.
Stratos Global LLC (tradu.com ):
Losses can exceed deposits.
Please be advised that the information presented on TradingView is provided to Tradu (‘Company’, ‘we’) by a third-party provider (‘TFA Global Pte Ltd’). Please be reminded that you are solely responsible for the trading decisions on your account. There is a very high degree of risk involved in trading. Any information and/or content is intended entirely for research, educational and informational purposes only and does not constitute investment or consultation advice or investment strategy. The information is not tailored to the investment needs of any specific person and therefore does not involve a consideration of any of the investment objectives, financial situation or needs of any viewer that may receive it. Kindly also note that past performance is not a reliable indicator of future results. Actual results may differ materially from those anticipated in forward-looking or past performance statements. We assume no liability as to the accuracy or completeness of any of the information and/or content provided herein and the Company cannot be held responsible for any omission, mistake nor for any loss or damage including without limitation to any loss of profit which may arise from reliance on any information supplied by TFA Global Pte Ltd.
The speaker(s) is neither an employee, agent nor representative of Tradu and is therefore acting independently. The opinions given are their own, constitute general market commentary, and do not constitute the opinion or advice of Tradu or any form of personal or investment advice. Tradu neither endorses nor guarantees offerings of third-party speakers, nor is Tradu responsible for the content, veracity or opinions of third-party speakers, presenters or participants.

GBPUSDBias,to the upside on the CABLE, after,we broke to the upside clearing the Previous Monthly candle Open, price is expected to continue to the upside

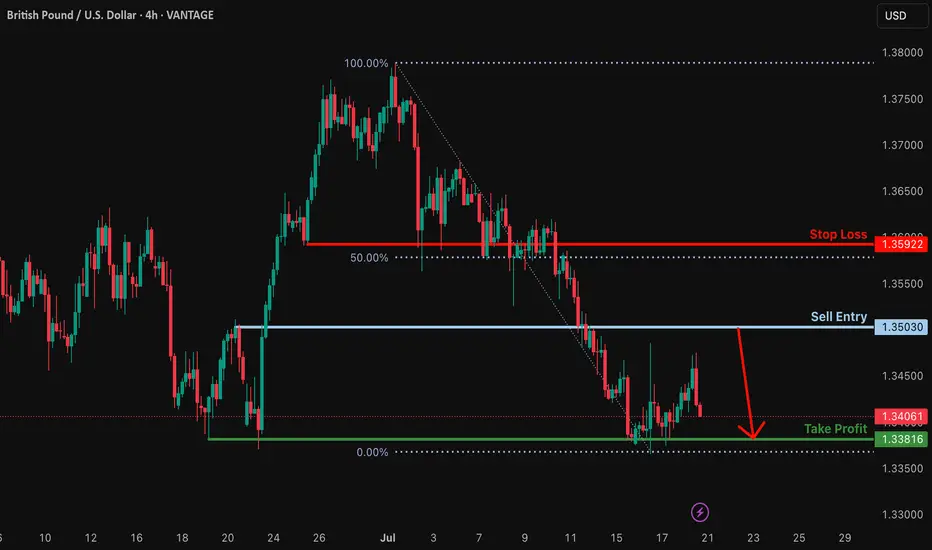
Bearish reversal off pullback resistance?GBP/USD is rising towards the resistance which is a pullback resistance and could drop from this level to our take profit.
Entry: 1.3603
Why we like it:
There is a pullback resistance level.
Stop loss: 1.3592
Why we like it:
There is a pullback resistance that is slightly above the 50% Fibonacci retracement.
Take profit: 1.3361
Why we like it:
There is a pullback support.
Enjoying your TradingView experience? Review us!
Please be advised that the information presented on TradingView is provided to Vantage (‘Vantage Global Limited’, ‘we’) by a third-party provider (‘Everest Fortune Group’). Please be reminded that you are solely responsible for the trading decisions on your account. There is a very high degree of risk involved in trading. Any information and/or content is intended entirely for research, educational and informational purposes only and does not constitute investment or consultation advice or investment strategy. The information is not tailored to the investment needs of any specific person and therefore does not involve a consideration of any of the investment objectives, financial situation or needs of any viewer that may receive it. Kindly also note that past performance is not a reliable indicator of future results. Actual results may differ materially from those anticipated in forward-looking or past performance statements. We assume no liability as to the accuracy or completeness of any of the information and/or content provided herein and the Company cannot be held responsible for any omission, mistake nor for any loss or damage including without limitation to any loss of profit which may arise from reliance on any information supplied by Everest Fortune Group.
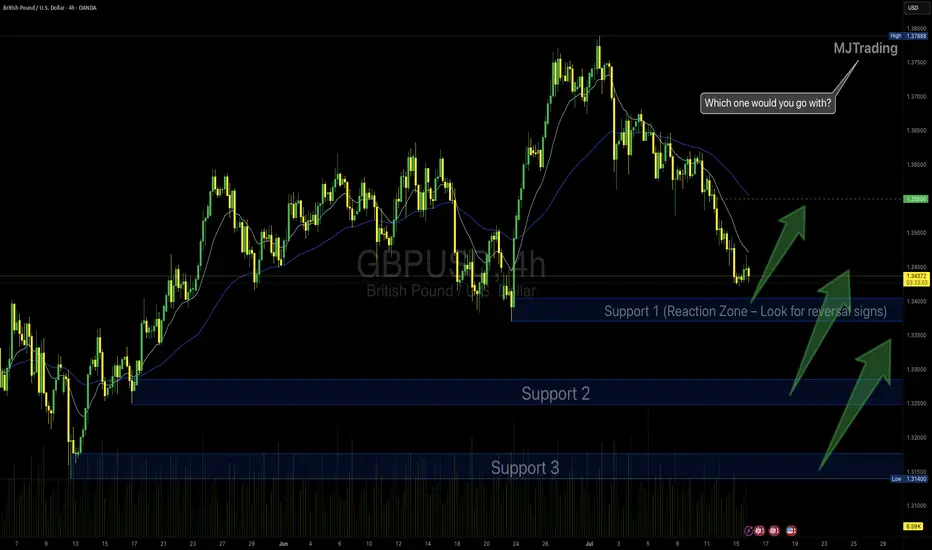
GBPUSD Idea – Demand Zones & Potential Reversal Play🧠 MJTrading:
After a steady downtrend, GBPUSD is now approaching a strong 4H demand zone (Support 1), where we previously saw explosive bullish reactions.
Price is also extended from both EMAs, showing potential for a technical pullback or full reversal.
💡Scenarios to consider:
🔹 If Support 1 holds → we may see a bounce toward 1.3500+
🔹 If broken → Support 2 & 3 offer deeper liquidity and high-probability demand zones
👀 Watch for:
Bullish reversal candles (engulfing / hammer)
Bullish divergence on lower timeframes
Volume spikes on reaction
⚠️ Invalidation:
If Support 3 breaks with strong momentum, we might enter a bearish continuation phase.
#GBPUSD #Forex #ChartDesigner #SmartMoney #PriceAction #MJTrading #ForexSetup #TrendReversal #SupportZones
EUROUSD NEW OUTLOOKEurousd market is running on both sides
now market looking in bulish trande wait for good opportunity market will touch support zone then ypu can buy from support zone its best for you
TRADE AT YOUR OWN RISK
REGARD ALBERT

CHECK GBPUSD SIGNAL READ THE CAPTAINEntry Point: Around 1.35400 1.35300
Stop Loss: Around 1.34950
🎯 Target Levels
Take Profit 1:
1.35650
Take Profit 2:
1.36050
last target
1.36500

GBPUSDOn the 1hr time frame price took sell side liquidity and ran into an FVG, I expect a little push up after the break of internal structure to the area of 1.35060

Ready to go short?!Hello all. I was thinking on GBPUSD. then I found that a Node is left behind. is it possible to left sth. behind at market? I will tell you no. then it is a good Opp to start going short. huge R/R is important here. be happy and have a wealthy life (wink).
and let me tell you sth. """"BE PATIENT""". Today I lose 1.4% of my account just for having no patience.

big energy the buy from demand was just too beautifuli told ya see how smoothly she sails the GBPUSD
i did a detailed explanation in my post earlier about this trade check it out and let me know what you think
GBP/USD Pair Technical Overview!The GBP/USD pair is trading in a general upward trend after seeing some pullbacks due to the renewed strength of the US dollar. However, it failed to close below the 1.33649 level on both the 4-hour and daily timeframes, thus maintaining a positive outlook.
The next target for this pair is at the 1.3690 level. The bullish scenario will remain valid unless the price breaks below the 1.33649 level and creates a daily candle close beneath it.

GBPUSD LongWe are in a key Fibonacci Level, Where it falls in line with a fair value gap. We are Looking to Go long to the yesterdays high of 1.35880. Lets see how it goes

GBP USD shortpossible after bullish rally today is a busy day we may see a correction in the trend
Please note: This is for educational purposes only and not a trading signal. These ideas are shared purely for back testing and to exchange views. The goal is to inspire ideas and encourage discussion. If you notice anything wrong, feel free to share your thoughts. In the end, to learn is to share !

GBP/USD is expecting bearish The GBP/USD chart is currently exhibiting a potential Head and Shoulders reversal pattern, which has formed near a significant daily resistance level. Price action shows a rejection from the right shoulder area, aligning with historical supply.
Additionally, there is a clear break of the RSI trendline on the daily timeframe, followed by a retest and continuation to the downside — a bearish signal indicating a potential shift in momentum. This divergence between price and RSI strengthens the bearish bias and suggests that the prevailing bullish trend may be losing strength.
The key confirmation for the pattern would be a break and retest of the neckline. A valid entry can be considered upon that confirmation. However, aggressive traders may choose to enter around current levels, bearing in mind strict risk management protocols, as there remains a possibility that the pattern could fail and bullish momentum could resume.
Should the pattern complete successfully, downside targets align with the Fibonacci retracement levels and the unmitigated Daily Fair Value Gap (FVG), particularly around the 62%–78% zone (approx. 1.2980–1.2867), which may act as a strong demand zone for potential reversal.

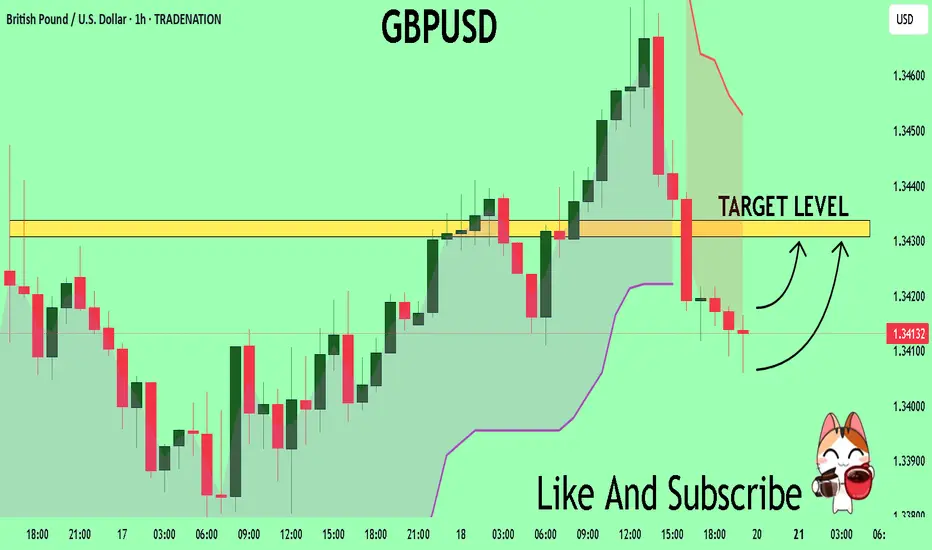
GBPUSD Expected Growth! BUY!
My dear followers,
I analysed this chart on GBPUSD and concluded the following:
The market is trading on 1.3413 pivot level.
Bias - Bullish
Technical Indicators: Both Super Trend & Pivot HL indicate a highly probable Bullish continuation.
Target - 1.3430
About Used Indicators:
A super-trend indicator is plotted on either above or below the closing price to signal a buy or sell. The indicator changes color, based on whether or not you should be buying. If the super-trend indicator moves below the closing price, the indicator turns green, and it signals an entry point or points to buy.
Disclosure: I am part of Trade Nation's Influencer program and receive a monthly fee for using their TradingView charts in my analysis.
———————————
WISH YOU ALL LUCK
GBP_USD LONG FROM SUPPORT|
✅GBP_USD has been falling recently
And the pair seems locally oversold
So as the pair is approaching
A horizontal support of 1.3399
Price growth is to be expected
LONG🚀
✅Like and subscribe to never miss a new idea!✅
Disclosure: I am part of Trade Nation's Influencer program and receive a monthly fee for using their TradingView charts in my analysis.

After Breaking Downward Trend, GBPUSD Ready for Upward Rally!GBPUSD
N.B!
- GBPUSD price might not follow the drawn lines . Actual price movements may likely differ from the forecast.
- Let emotions and sentiments work for you
- ALWAYS Use Proper Risk Management In Your Trades
#audusd

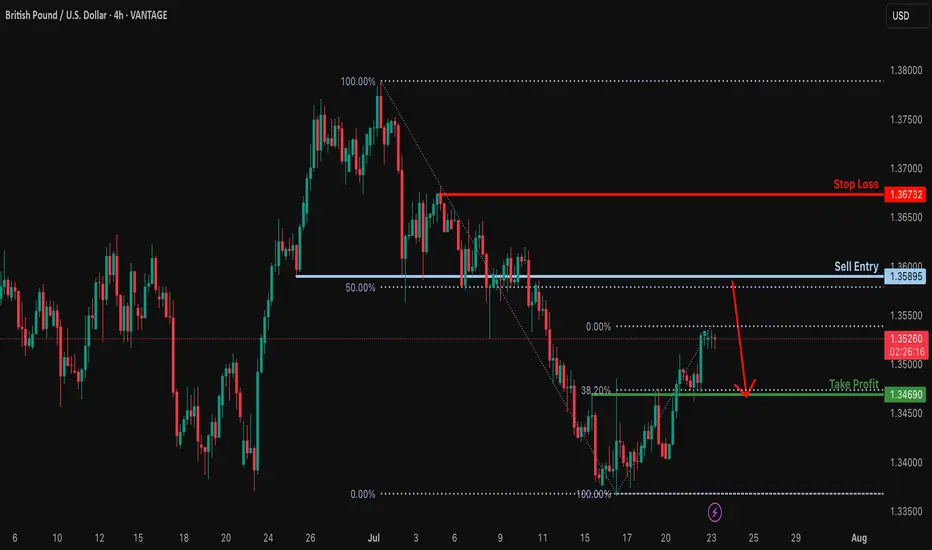
Bearish reversal off 50% Fibonacci resistance?GBP/USD is rising towards the resistance level which his a pullback resistance that lines up with the 50% Fibonacci retracement and could reverse from this level to our take profit.
Entry: 1.3589
Why we like it:
There is a pullback resistance that lines up with the 50% Fibonacci retracement.
Stop loss: 1.3673
Why we like it:
There is a pullback resstance.
Take profit: 1.3469
Why we like it:
There is an overlap support that aligns with the 38.2% Fibonacci retracement.
Enjoying your TradingView experience? Review us!
Please be advised that the information presented on TradingView is provided to Vantage (‘Vantage Global Limited’, ‘we’) by a third-party provider (‘Everest Fortune Group’). Please be reminded that you are solely responsible for the trading decisions on your account. There is a very high degree of risk involved in trading. Any information and/or content is intended entirely for research, educational and informational purposes only and does not constitute investment or consultation advice or investment strategy. The information is not tailored to the investment needs of any specific person and therefore does not involve a consideration of any of the investment objectives, financial situation or needs of any viewer that may receive it. Kindly also note that past performance is not a reliable indicator of future results. Actual results may differ materially from those anticipated in forward-looking or past performance statements. We assume no liability as to the accuracy or completeness of any of the information and/or content provided herein and the Company cannot be held responsible for any omission, mistake nor for any loss or damage including without limitation to any loss of profit which may arise from reliance on any information supplied by Everest Fortune Group.
GBPUSD | I expect the currency to enter a strong downtrend on thI expect the currency to enter a strong downtrend on the daily frame.
After breaking the ascending channel, we are now in a retest phase and the price will return to decline. OANDA:GBPUSD

GBP-USD Support Ahead! Buy!
Hello,Traders!
GBP-USD went down but
The pair will soon hit a
Horizontal support level
Of 1.3400 from where we
Will be expecting a local
Rebound and a move up
Buy!
Comment and subscribe to help us grow!
Check out other forecasts below too!
Disclosure: I am part of Trade Nation's Influencer program and receive a monthly fee for using their TradingView charts in my analysis.
