GBPUSD BULLISH MOMENTUM"GBPUSD shows strong bullish momentum with no immediate signs of slowing down, especially following a period of consolidation. The pair appears to be targeting the next key resistance zone to the upside. The question now is whether the dollar has enough strength to shift sentiment or are we set to see continued upside? For now, we watch and wait for any signs of reversal or exhaustion.
GBPUSD trade ideas

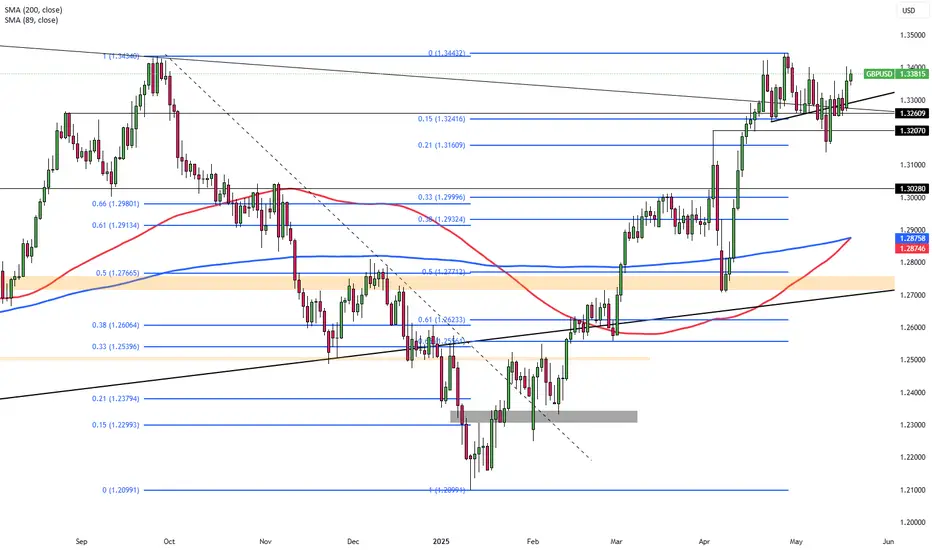
Pound Climbs Above $1.336 on Strong UK DataThe British pound rallied past $1.336, reaching a one-week high and inching closer to its April peak of $1.34. The move was fueled by renewed optimism after the UK and EU reached a comprehensive post-Brexit agreement covering energy cooperation, defense partnerships, and fisheries rights through 2038.
Supporting the pound further, recent UK data exceeded expectations. GDP rose 0.7% in Q1 and 1.3% annually, easing pressure on the Bank of England to cut interest rates aggressively. Although rate reductions remain on the table, the strength of the economic rebound gives policymakers more flexibility.
Despite some concerns about rising unemployment and slowing wage growth, the upbeat GDP print has helped offset fears of an impending recession. Meanwhile, the US dollar continued to weaken following Moody’s credit downgrade, providing additional support to the pound.
GBP/USD now faces resistance at 1.3450, with higher targets at 1.3550 and 1.3700. Support is located at 1.3160, followed by 1.3000 and 1.2960.
SELL SETUP FOR GBP & CROSSES!!!!Structure looks to have completed and all gbp crosses are shaping up for a big drop, look to sell when the structure meets your entry rules.
posting more on the gbp crosses soon

Trend analysis on #GBPUSD, #USDJPY and #DXYI am watching the correlation of #DXY with GBPUSD and USDJPY to help me determine the next price moves. At the moment, both charts are at resistance zones. If DXY breaks to the downside, then USDJPY will continue selling, while GBPUSD will continue buying. If it fails, then the reverse is true.

GBPUSD and GBPJPY Analysis todayHello traders, this is a complete multiple timeframe analysis of this pair. We see could find significant trading opportunities as per analysis upon price action confirmation we may take this trade. Smash the like button if you find value in this analysis and drop a comment if you have any questions or let me know which pair to cover in my next analysis.

GBPUSD BULLISH OR BEARISH DETAILED ANALYSISGBPUSD is currently forming a clean bullish pennant pattern on the daily chart after a strong impulsive rally, indicating that the pair is consolidating before its next leg higher. Price is hovering around the 1.3360–1.3380 zone, coiling tightly within the pennant structure, and showing signs of breakout pressure building. This is a classic continuation setup in a trending market, and with volume compression and decreasing volatility, the stage is set for a bullish breakout toward the 1.4070–1.4100 region.
On the fundamental side, the British pound remains relatively supported due to recent hawkish rhetoric from the Bank of England, which is still closely monitoring wage inflation and strong labor market figures. Meanwhile, the US dollar is facing headwinds after softer CPI and PPI readings this month, fueling expectations of Fed rate cuts in the second half of 2025. These macro dynamics are increasingly tilting in favor of sterling strength, as investors begin pricing in yield divergence between the Fed and the BoE.
Technically, the bullish structure is intact and the pennant formation is forming right after a sharp move higher, which adds confluence to this pattern. The breakout zone to watch is 1.3380–1.3400, and if bulls can clear this area with momentum, we are likely to see a swift extension toward the 1.4070 level. The risk is well-contained below 1.3340, offering an excellent reward-to-risk ratio for breakout traders and trend followers.
This setup is not only technically sound but also backed by current macro shifts, making GBPUSD one of the most promising long opportunities right now. The market has been consolidating for weeks, building up energy, and with fundamentals aligning, this breakout could drive a strong move into Q3. I'm eyeing the 1.4070–1.4100 target in the coming weeks, and I'll continue to monitor for confirmation and execution signals.

GNPUSD above 1.32000 price level A break of May 15th has been broken and prive hovering aboe price level 1.32000, opening a bullish run to 1.33640
how ever if the pair fake the price and move below 1.32000 the rice will be looking to test 1.32000 amd 1.31000 price level then move up to 1.33640 and above to 1.38000

GBPUSD - USD getting strongBuy after successfully breakout this resistant line with a short -term target of at least 10%+ from here.

GBP USD LONG Price just mixed the entry of our long setup yesterday after the immediate breakout and successful retest of the Ascending wedge pattern formed.
Better Setup next time 😉

GBPUSDBuy. Market Execution. trade 1:2. riesgo 0.50%
I went into buy because the market is respecting the buyers' zone.

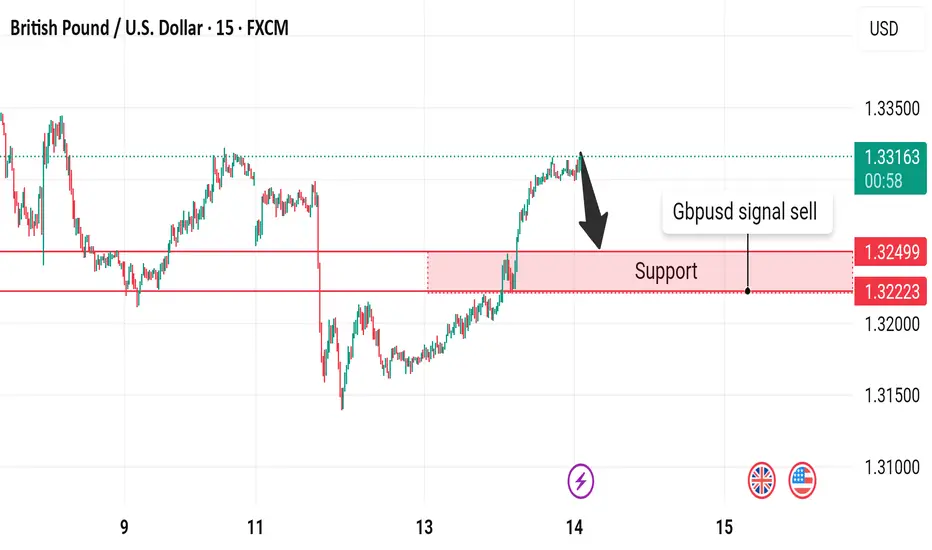
Gbpusd signal sell GBP/USD caught a bid on Tuesday, rebounding above the 1.3300 handle and reversing early week losses as global markets tilt and twist around general Greenback flows based on broad-market sentiment. UK labor figures barely moved the needle, and market reaction to US Consumer Price Index inflation was likewise muted.
GBPUSD SHORT Head And shoulders Move Entered this trade, let's see how it goes. My mentor Adviced this trade, seems to have a lot of potential

Support and Resistance LevelsSupport and Resistance Levels: These are key price levels where the price has historically tended to find support (bounce up) or resistance (struggle to break above). Identifying these levels is crucial for potential entry and exit points

GBPUSD Daily CLS Nested in Weekly CLS, Model 2 at 61.8Hey, Market Warriors, here is another outlook on this instrument
If you’ve been following me, you already know every setup you see is built around a CLS range, a Key Level, Liquidity and a specific execution model.
If you haven't followed me yet, start now.
My trading system is completely mechanical — designed to remove emotions, opinions, and impulsive decisions. No messy diagonal lines. No random drawings. Just clarity, structure, and execution.
🧩 What is CLS?
CLS is real smart money — the combined power of major investment banks and central banks moving over 6.5 trillion dollars a day. Understanding their operations is key to markets.
✅ Understanding the behaviour of CLS allows you to position yourself with the giants during the market manipulations — leading to buying lows and selling highs - cleaner entries, clearer exits, and consistent profits.
🛡️ Models 1 and 2:
From my posts, you can learn two core execution models.
They are the backbone of how I trade and how my students are trained.
📍 Model 1
is right after the manipulation of the CLS candle when CIOD occurs, and we are targeting 50% of the CLS range. H4 CLS ranges supported by HTF go straight to the opposing range.
📍 Model 2
occurs in the specific market sequence when CLS smart money needs to re-accumulate more positions, and we are looking to find a key level around 61.8 fib retracement and target the opposing side of the range.
👍 Hit like if you find this analysis helpful, and don't hesitate to comment with your opinions, charts or any questions.
⚔️ Listen Carefully:
Analysis is not trading. Right now, this platform is full of gurus" trying to sell you dreams based on analysis with arrows while they don't even have the skill to trade themselves.
If you’re ever thinking about buying a Trading Course or Signals from anyone. Always demand a verified track record. It takes less than five minutes to connect 3rd third-party verification tool and link to the widget to his signature.
"Adapt what is useful, reject what is useless, and add what is specifically your own."
— David Perk aka Dave FX Hunter ⚔️

GBPUSD INVERSE CUP AND HANDLE PATTERNTechnical Overview
Resistance Level: 1.34400
Support Level: 1.27500
Bearish Targets: 1.30200 and 1.28800
The resistance at 1.34400 represents the peak before the formation of the inverted cup, serving as a critical level where selling pressure may intensify. The support at 1.27500 aligns with the neckline of the pattern; a decisive break below this level would confirm the bearish breakout, potentially leading to the projected targets.
📉 Trading Strategy
Consider entering a short position upon a confirmed break below the 1.27500 support level, accompanied by increased trading volume to validate the breakout.
Place a stop-loss order above the handle's peak, near 1.34400, to protect against false breakouts and limit potential losses.

GBP_USD STRONG BREAKOUT|SHORT|
✅GBP_USD was holding above
The key horizontal level around 1.3240
For quite some time but now we are
Seeing a strong bearish breakout
Which is confirmed and as the pair
Is making a pullback to retest
The new resistance we will be
Expecting a further bearish
Continuation after the retest
SHORT🔥
✅Like and subscribe to never miss a new idea!✅
Disclosure: I am part of Trade Nation's Influencer program and receive a monthly fee for using their TradingView charts in my analysis.

GBPUSD 30M CHART PATTERNThis chart shows a trading setup for GBP/USD on a 30-minute timeframe. There are three marked trade entries with clearly defined Stop Loss and Take Profit levels:
1. First Trade (Long Position)
Entry: Around 1.32200
Stop Loss: Below 1.32000
Take Profit: Just below 1.33300
Result: Successful hit of take profit.
2. Second Trade (Short Position)
Entry: Near the top after the prior rise (~1.33000)
Stop Loss: Slightly above entry (~1.33100)
Take Profit: Reached well below the entry
Result: Successful hit of take profit.
3. Third Trade (Long Position, Current)
Entry: Around 1.31700–1.31800
Stop Loss: Below 1.31600
Take Profit: Above 1.33100
Status: Trade is still active; price is hovering near entry.
If you want a breakdown of the risk-reward ratios or entry logic (e.g., support/resistance, candlestick patterns), let me know!

GBPUSD 4H CHAT PATTERNHere’s a clear breakdown of your **GBP/USD** short (sell) trade idea:
---
### **Trade Setup: GBP/USD (Sell)**
* **Entry:** 1.3180
* **Target:** 1.3070
* **Stop Loss:** 1.3210
---
### **Risk-Reward Analysis:**
* **Stop Loss Range:** 1.3210 - 1.3180 = **30 pips**
* **Potential Profit:** 1.3180 - 1.3070 = **110 pips**
* **Risk/Reward Ratio:** **110 / 30 ≈ 3.67**
---
### **Comment:**
This is a high risk/reward setup—attractive from a trading perspective, assuming proper confirmation. Make sure market conditions support the bearish bias (e.g. resistance levels, bearish candlesticks, fundamental sentiment).

Trade Recap cw19Quick recap of my two positions from last week with the additional test entry on GBP/USD

GBP/USD Trading Idea: Sell Below 1.32056 Targeting 1.27133The GBP/USD pair is currently trading within an Undefined Price Action/Consolidation Zone, suggesting indecision and reduced momentum. Price has been moving sideways for several days with no clear trend direction. This area typically signals accumulation or distribution before a breakout.
Key Levels Identified
Support 1 (Breakout Level): 1.32056
Support 2 (Target Level): 1.27133 – 1.27173 (zone)
Resistance (Invalidation Zone): Around 1.33034
Trade Setup (Bearish Bias Upon Breakout)
Trade Idea
Price is currently ranging but has tested the Support 1 zone multiple times. The more a support level is tested, the weaker it becomes. A clean break below Support 1 (1.32056) would likely signal the end of the consolidation phase and could trigger a strong bearish move. If this breakdown occurs, a short position becomes valid.
Entry
Sell Stop Order below 1.32056 (e.g., at 1.31950) to catch the breakout momentum.
Take Profit (TP)
Primary Target: Support 2 zone between 1.27133 and 1.27173, representing a major historical support level. This provides a potential reward of approximately 480 pips from entry.
Stop Loss (SL)
Placed above recent swing high and resistance of the range: around 1.33034.
Risk is about 90 pips, providing a Risk-Reward Ratio (RRR) of ~1:5 – favorable for short sellers.
Additional Notes
Volume Analysis: Volume appears to have dropped inside the consolidation zone, often indicating a buildup phase. A breakout with rising volume would confirm the trade signal.
Event Risk: UK-related macroeconomic events are marked on May 13 and 15. Monitor for volatility which could trigger the breakout.
Bias: Currently unbiased but leaning bearish due to:
Flat momentum within the zone
Multiple failures to sustain above mid-range
Potential for breakdown continuation aligned with the higher time frame trend

GBPUSD 30M CHART PATTERNThis chart shows the GBP/USD currency pair on the 30-minute timeframe. Key elements include:
A downward trendline that has just been broken.
A potential long (buy) trade setup with:
Stop Loss just below the recent low.
Take Profit significantly higher, indicating a favorable risk-reward ratio.
The price action suggests a possible reversal from a downtrend to an uptrend.
This appears to be a trend reversal strategy aiming to capitalize on a breakout above the descending resistance line.
Would you like help analyzing the potential success probability of this trade setup or suggestions for improving the strategy?

Bullish breakout?The Cable (GBP/USD) has broken out of the resistance level, which was a pullback resistance. A potential pullback to the pivot and a bounce could lead the price to rise toward the 1st resistance level.
Pivot: 1,3259
1st Support: 1.3223
1st Resistance: 1.3319
Risk Warning:
Trading Forex and CFDs carries a high level of risk to your capital and you should only trade with money you can afford to lose. Trading Forex and CFDs may not be suitable for all investors, so please ensure that you fully understand the risks involved and seek independent advice if necessary.
Disclaimer:
The above opinions given constitute general market commentary, and do not constitute the opinion or advice of IC Markets or any form of personal or investment advice.
Any opinions, news, research, analyses, prices, other information, or links to third-party sites contained on this website are provided on an "as-is" basis, are intended only to be informative, is not an advice nor a recommendation, nor research, or a record of our trading prices, or an offer of, or solicitation for a transaction in any financial instrument and thus should not be treated as such. The information provided does not involve any specific investment objectives, financial situation and needs of any specific person who may receive it. Please be aware, that past performance is not a reliable indicator of future performance and/or results. Past Performance or Forward-looking scenarios based upon the reasonable beliefs of the third-party provider are not a guarantee of future performance. Actual results may differ materially from those anticipated in forward-looking or past performance statements. IC Markets makes no representation or warranty and assumes no liability as to the accuracy or completeness of the information provided, nor any loss arising from any investment based on a recommendation, forecast or any information supplied by any third-party.

GBPUSD Technical Analysis! SELL!
My dear followers,
This is my opinion on the GBPUSD next move:
The asset is approaching an important pivot point 1.3290
Bias - Bearish
Technical Indicators: Supper Trend generates a clear short signal while Pivot Point HL is currently determining the overall Bearish trend of the market.
Goal - 1.3252
About Used Indicators:
For more efficient signals, super-trend is used in combination with other indicators like Pivot Points.
Disclosure: I am part of Trade Nation's Influencer program and receive a monthly fee for using their TradingView charts in my analysis.
———————————
WISH YOU ALL LUCK
