TLRY Spike StudyJust studying some and figured to put some thoughts to writing, solely for my own friction of thought.
$TLRY's sudden price jump occurred during the formation of a minuette 5 wave, which extended. The steep sell off right after, was pretty scary, but expected at the same time. I am trying to decide if we witnessed an anomaly, or if this insane price action marks the beginning of a reversal. The fact that it was a wave 5 certainly justifies the sell off, but there are several waves of higher degree, that haven't been completed yet.
There are many catalysts for the industry ahead, this year.
There are many catalysts ahead for TLRY, once the merger completes
The spike was caused by a short squeeze, meaning investors were correct to be bag holders, and shorts had to cover their positions
The sell off brought the price back to pre-squeeze levels, and found demand, confirming the above.
So now what?
There are examples of assets that spiked, then traded sideways for a time, before continuing higher. $GRWG is a good example, when it spiked from $2 to $20. If you study that spike, you see a retrace of 50%(ish), 2 months sideways chop and then started on a textbook impulse wave to the current level of $55, with both spike, correction and impulse wave following Elliot Wave Theory to a tee.
Frost and Prechter, page 66, describes behaviour following fifth wave extensions:
"The most important empirically derived rule that can be distilled from our observations of market behaviour is that when the fifth wave of an advance is an extension, the ensuing correction will be sharp and find support at the level of wave 2 of the extension.
As marked on the chart here, you see the extension take off from iii, then plunge back into the ii range that I marked with green. The book continues:
"Sometimes the correction ends there, and sometimes only wave A ends there. Although a limited number of real life examples exist, the precision with which A waves have reversed at this level, is remarkable."
and finally:
"This guideline need not apply when the market is ending a fifth wave at more than one degree, yet the action suggests that we should still view this level as at least potential or temporary support."
For $TLRY, I am quite confident that we ended minuette 5 of minute 3. Even if I got a degree wrong here, we are still looking at minor 3 inside intermediate 3. So, in theory, we still have a series of 4-5's to complete before this primary wave is complete. At the same time, the top of minute 1 is at $9.66, so this asset has lots of room to move.
Trade with caution.
Market insights

short term +500% (also look at ganja penny stocks +1,000%)Tilray, Inc. engages in the research, cultivation, production, marketing, and distribution of medical cannabis products.

Divergence on critical supportClear divergence after bouncing off critical support level. Low risk entry with SL & TP levels marked. As always, safe trading. Let me know your thoughts down below!

TLRY is going down. 30% profit opportunityNASDAQ:TLRY just broke under a massive support level. Most signs are showing that it will go down to the take profit area shown on the chart.
⚠️ Let me know your feedback and comments below!
⚠️ Follow me if you would like to see more analysis like this

Tilray $TLRY Set Up For Breakout The chart here really speaks for itself. $TLRY is coming to the end of the Falling Wedge it has been trading in since February and is very likely going to break out to the upside.
We are also seeing higher highs on the RSI while the price is dropping. This is bullish divergence, paired right at support, making this a very clean setup.
A very modest target will be $17 after successful breakout and in my opinion, has room to go higher.

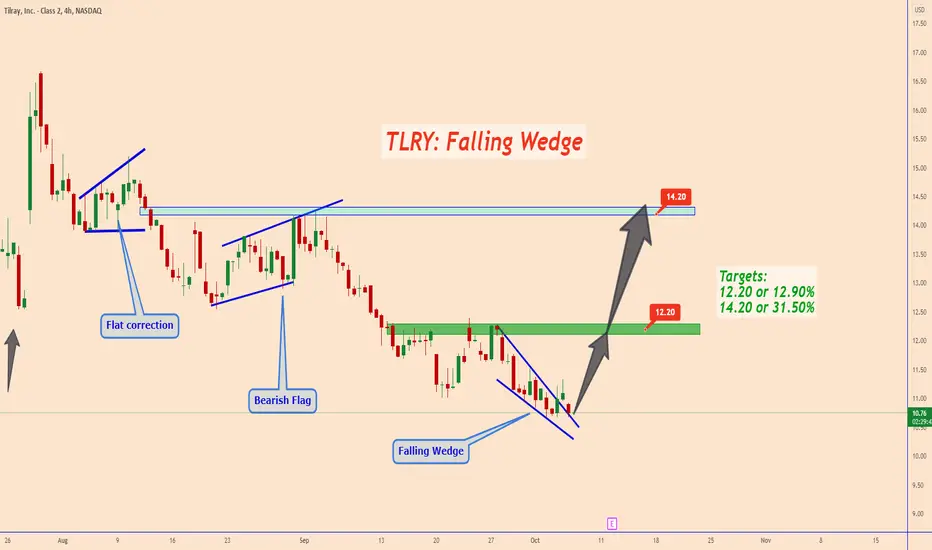
TLRY: Falling WedgeTLRY company completed a falling wedge pattern.
For this company this price it's a bit low and it will increase again.
As are looking the last months the stock market it's suffering in almost all the sectors.
So the move down it's not related to specific stocks.
Targets:
12.20 or 12.90%
14.20 or 31.50%
Thank you and Good Luck!
TLRY - Massive falling wedge brewing Expecting 2 more months of punishment in the MJ sector. Still looking for $10 gap to be filled.. Either way, $36 EOY TP.. GLTALs


TLRY Inverse Head and Shoulders PatternNASDAQ:TLRY is attempting to break out of an inverse head and shoulders pattern. The pattern calls for a measured move target around $13.


Tilray (TLRY) - Sideways to down I suspect we will see another sideways to down week. I suspect more negative news out of China will hinder the SPY. This will lead to more broad sell off. I dont see Tilray moving much upward unless there are positive news on banking and legalization. Any up moves will quickly sell off short term. I may add to my position for cost average down by selling puts, but the premium is vey low.
Holding 20,000 shares at 15.50 cost basis
Cover calls sold over time my cost basis is actually 13.11 at the time of this post

Bull Divs FormingBull Divs have formed on both the RSI and MACD on TLRY. Price is falling into an area where there is strong support. Seems like a massive double bottom pattern is shaping up. This I think is a great longer term hold with a macro trend reversal on the horizon.

Divergences at supportTilray is showing divergences at a zone of confluence. I analyzed the price/volume relation in every timeframe for a long time and I'm impressed again and again. One of my all time favourite long term trades. Let me know your long term price goal if you have one! The last weekly candle is forming a potential hammer which shows rejection from the support zone.

TLRY looking real favorable hereTLRY might have bottomed here. breaking out of its ichimoko cloud and forming a "some what convincing" C&H. Only one way to confirm this. the first 30 mins of the market are my confirmation. If it holds above its bearish ichimoku cloud I will be going out when it breaks out of its consolidation area which is the handle of this pattern. TLRY takes a while to move so leaps are a smarter choice but when this stock moves get ready for a wild move. stop loss would be 11.30. first PT I have for this move is 15 and lastly 18. might hit 25 but not any time soon. might take a few months.

Tilray (TLRY) - Sideways to down Tilray volume is slowing. I suspect we have lower prices ahead. I think it’s reasonable to say we could see 10.


TLRY: Time to get high?Just bought Tilray🌿 stocks @ 12.22, currently at trendlines & previous significant high confluence. Price needs to break up the red falling wedge. Target 122 which means 10x.
The blue uptrendline on log scale (imo false break down) and also higher volume this year shown below:
Please like👍, comment🗣️, follow me✒️, enjoy📺!
Disclaimer: I'm not financial advisor. This is not a financial advice. Do your own due dilingence.
NASDAQ:TLRY
TSX:TLRY
CAPITALCOM:TLRY
FTX:TLRYUSD
SIX:2HQ
NEO:TLRY
SWB:2HQ
XETR:2HQ
FWB:2HQ
MUN:2HQ
HAM:2HQ
HAN:2HQ
BER:2HQ
FTX:TLRY0924
NASDAQ:NDAQ
OANDA:NAS100USD
CURRENCYCOM:US100

Buy $TLRY - NRPicks 16 JulTilray Inc. engages in the research, cultivation, production, and distribution of medical cannabis and cannabinoids. The company offers cannabis-lifestyle and consumer packaged goods, offers medical cannabis in extracts and dried flower forms; and cannabis extracts, including purified oil drops and capsules.
Revenue TTM 480M
EBITDA TTM 36M
Gross Margin 35%
EBITDA margin 9.2%
RSI Oversold

TLRY Daily TimeframeSNIPER STRATEGY
This magical strategy works like a clock on almost any charts
Although I have to say it can’t predict pullbacks, so I do not suggest this strategy for leverage trading.
It will not give you the whole wave like any other strategy out there but it will give you huge part of the wave.
The best timeframe for this strategy is Daily, Weekly and Monthly however it can work any timeframe above three minutes.
Start believing in this strategy because it will reward believers with huge profit.
There is a lot more about this strategy.
It can predict and also it can give you almost exact buy or sell time on the spot.
I am developing it even more so stay tuned and start to follow me for more signals and forecasts.

Can we hold support?Can we hold the support ?
Or can we make a higher high to break the downtrend? Lets wait for a breakout!

TLRY: A Solid CandidateGood morning everyone! Every Thursday morning we highlight our favorite trade setup of the week. This week, we will be taking a look at a flush setup in $TLRY.
Sorry for the lack of posts here and on SeekingAlpha recently, a few of us are out of the office in Okemo, VT taking some vacation. We will be back to regular posting next Monday.
This setup is simply too good to miss, though.
Tilray is well known in the trading community as a small scale non-U.S. based cannabis grower, but the company has been rapidly changing over the last year. It has been securing contracts with multiple countries, including the EU and others, and has recently entered the U.S. market (the one that matters) through an investment in MedMen, that gives it the majority holding via convertible notes and warrants. It also recently closed a merger with APHA, which solidifies it as one of the most important weed stocks around.
In other words, the company is making the right moves, and is set up to outperform long term in the event of positive legal weed outcomes in the U.S. and internationally.
However, the stock has been weak recently, down 81% from it's short squeeze high this January, dripping almost every day. It has recently found support around 12.50, which is an important support for the share price, but remains weak overall.
We are expecting a flush below 12.50, which should produce an attractive entry point into this stock for the longer term. The valuation isn't even that stretched anymore either, trading at 6.6x TTM sales (less than AAPL), and with a huge potential growth opportunity.
Because the stock is so volatile, it's a great candidate for a put selling opportunity. If it ends up happening, we expect that the stock will flush to around ~$10, where we would like to sell puts at $9 or $8. This would give us an extremely attractive entry point to this growing company and market, at a lower price than you're getting for the megacaps which operate in TAM constricted, peak growth environments. Plus, the yield earned we estimate would be around 80% annualized, which seems highly attractive. Nothing like a combination of Margin of safety and high volatility to make for the perfect setup!
Cheers

TLRY Looking For A Drop To $9.36 For A LT Position TLRY looking for a drop to 9.36 and a long term hold on this top tier weed name - Do your own DD Not advice

Long TLRYNASDAQ:TLRY
Long on Tilray, federal legalization is looming and the arguably largest canadian player has a foot in the US door. Coupled with the fact that were in an absolutely tremendous long term support zone, nearing the end of a beautiful wedge. Lookout below $12.35. I'm long Leaps but this is not financial advice, please trade at your own risk.
