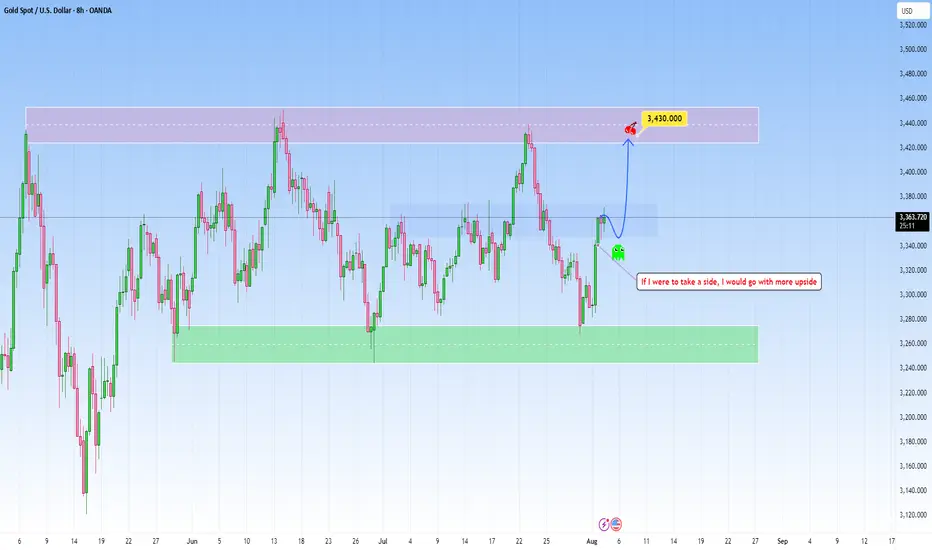
GOLD undecided: Looking for a positive outlookThe current market context on GOLD seems undecided and heavily influenced by news release and macroeconomic catalysts. The recent reversal from the support was pretty decisive, catching short-sellers off guard and forcing them to cover positions.
However, the structure has yet to produce a clean breakout beyond the mid-range, suggesting a lack of strong conviction from either side.
The probability of a pause or reversal here under this circumstances may increase substantially as well. But if I were to take a side I would definitely choose more upside , before any correction begins.
This is a high-risk zone for positioning without confirmation. The market is potentially preparing for a breakout or a fakeout, and patience is key. Wait for clear signs of intent before committing.
GOLD trade ideas
XAUUSDHello Traders! 👋
What are your thoughts on GOLD?
Gold saw a strong rally on Friday following the U.S. Non-Farm Payrolls (NFP) report and is now trading near a key resistance zone.
At this resistance, a short-term pullback is likely as traders lock in profits.
We expect the correction to be contained within key support levels, and if price holds in that zone, the uptrend is likely to resume, targeting new highs.
Will gold resume its rally after the correction? Share your view below! 👇
Don’t forget to like and share your thoughts in the comments! ❤️

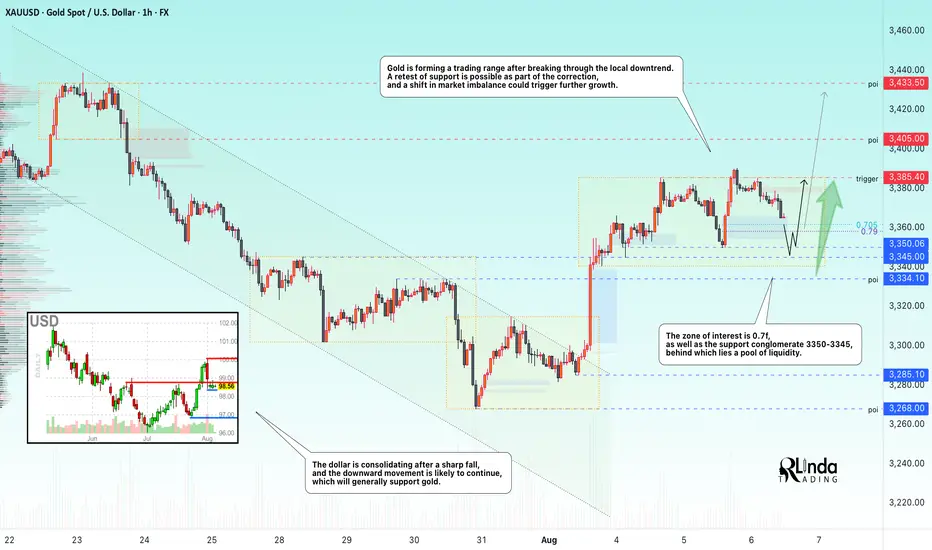
GOLD → Long squeeze of support ahead of possible growthFX:XAUUSD is entering a consolidation phase after a rally. The market is forming a trading range, and a retest of support could end in growth...
Gold pulled back from an 8-day high ($3391) on profit-taking ahead of Trump's Fed appointments. Weak ISM services data (50.1) and a pause in the dollar's weakening added pressure, although expectations of Fed policy easing in September remain supportive.
The market focus is on key events: Fed appointments (including a possible replacement for Powell) and Trump's trade statements. These factors could provide new momentum after the current correction, as long as the fundamental drivers for growth remain in place.
Resistance levels: 3385.4
Support levels: 3358, 3350, 3345
Technically, the price has confirmed resistance after a false breakout, and the market needs to build up potential for a possible continuation of growth. At the moment, the most likely scenario is a long squeeze (false breakdown) before growth continues. Focus on the key support zone.
Best regards, R. Linda!
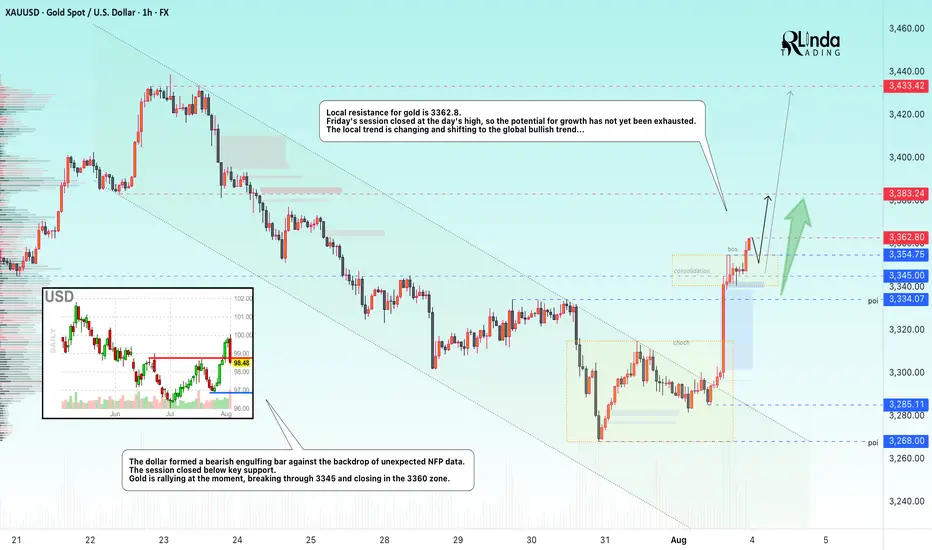
GOLD → The rally following weak NFP data may continueFX:XAUUSD is moving into distribution (rally) on the back of unexpected NFP data released on Friday. The dollar is plummeting...
Fundamentally, the gold market is getting support from an influx of funds after the unexpectedly weak NFP report. Against this backdrop, Trump said that the employment data had been “rigged” to make him look bad...
I believe that the situation is somewhat different: the president's administration failed to control this moment, hoping to see positive dynamics. Powell now has a small trump card to control his actions. The reduction in interest rates will most likely be postponed until the fall.
Technically, on D1, gold is rebounding from the support of the global trading range, forming a local bullish trend that coincides with the global one.
Resistance levels: 3362.8, 3383, 3433
Support levels: 3345, 3334
Gold is exiting the local downward channel, breaking through resistance at 3334 and 3345. Consolidation is forming, and by the end of the session, the price will break through resistance at 3354.75. The market is quite strong. Focus on two levels: 3362.8 and 3354.7. At the opening of the session, the price may attempt to break through the resistance level of 3362.8. If gold consolidates above this level, growth may continue. If not, then before further growth, the market may test the support level...
Best regards, R. Linda!
XAUUSDHello Traders! 👋
What are your thoughts on GOLD?
Gold remains trapped below the key $3,390–$3,400 resistance zone, which has rejected price multiple times in recent sessions.
A short-term pullback toward the marked support level is likely.
From that zone, we expect buyers to step in, leading to another bullish push toward the resistance, and this time, a potential breakout above the $3,400 level.
As long as the price stays above support, the bullish outlook remains intact.
A confirmed break above $3,400 could open the path toward new highs.
Don’t forget to like and share your thoughts in the comments! ❤️

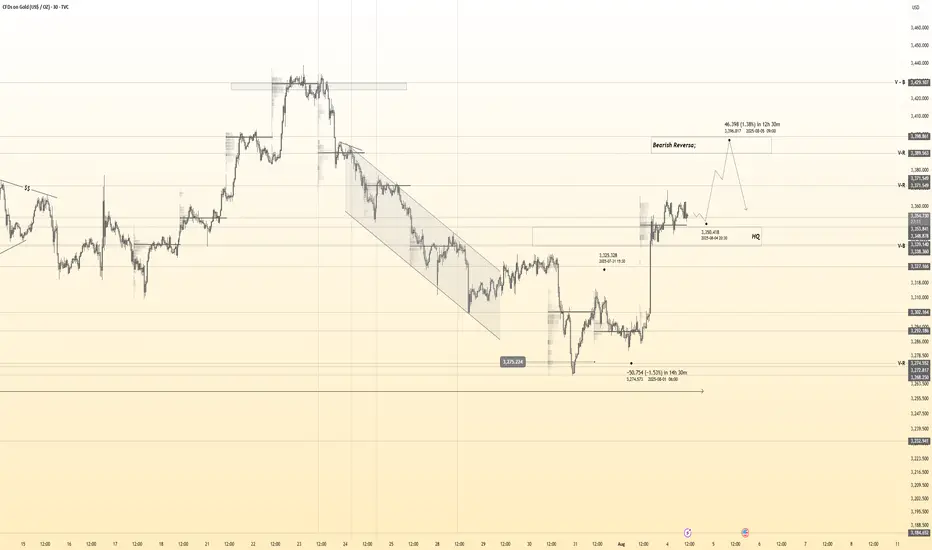
Gold 30Min Engaged ( Bearish & Bullish Entry Detected )Time Frame: 30-Minute Warfare
Entry Protocol: Only after volume-verified breakout
🩸Bearish Reversal From - 3397
🩸Bullish Reversal : 3341
➗ Hanzo Protocol: Volume-Tiered Entry Authority
➕ Zone Activated: Dynamic market pressure detected.
The level isn’t just price — it’s a memory of where they moved size.
Volume is rising beneath the surface — not noise, but preparation.
🔥 Tactical Note:
We wait for the energy signature — when volume betrays intention.
The trap gets set. The weak follow. We execute.
Lingrid | GOLD Weekly Market Analysis: Strong Bullish ReboundOANDA:XAUUSD market has demonstrated resilience with a strong bullish rebound following the NFP, suggesting that institutional buyers are stepping in at critical support levels. The precious metal is now testing key resistance zones that will determine whether the recovery can gain sustainable momentum.
The chart reveals a compelling technical setup with gold bouncing strongly just above the June low support zone around $3,265. This rebound has pushed price back above the $3,330 level and is now approaching the critical $3,400 resistance area. The strong bullish rebound after the NFP release indicates that the selling pressure faded, with buyers emerging at attractive levels near the June lows.
The previous pullback phase has been contained within the broader ascending channel structure, maintaining the overall bullish framework. The triangle pattern breakout to the downside appears to have been a false move, with the current rebound suggesting that the correction may be complete. The ability to hold above the previous week low has preserved the medium-term uptrend structure.
Key levels to monitor include the immediate resistance at $3,400 and the previous support-turned-resistance at $3,330. A decisive break above $3,400 would likely trigger renewed bullish momentum toward the $3,440-$3,465 zone, while failure to sustain above $3,330 could see another test of the June low support. The strong rebound from critical support levels suggests that the broader bullish bias remains intact, with this correction potentially setting up for the next leg higher.
If this idea resonates with you or you have your own opinion, traders, hit the comments. I’m excited to read your thoughts!

Lingrid | GOLD Potential Bullish Extension Following Pullback OANDA:XAUUSD is rebounding strongly from the support zone after a deep correction from the previous top near 3,437. The price has broken back above the range and formed a new impulse leg, now hovering just above the upward trendline. As long as the structure holds above 3,330, further continuation toward the 3,410–3,437 resistance zone remains likely. The projected wave path shows a bullish scenario targeting a retest of the top trendline.
📉 Key Levels
Buy trigger: Above 3,360
Buy zone: 3,330–3,340
Target: 3,410
Invalidation: Below 3,320
💡 Risks
Rejection from 3,360 trendline may lead to retracement
Failure to hold above 3,330 support could shift bias bearish
Upcoming macroeconomic data might increase volatility
If this idea resonates with you or you have your own opinion, traders, hit the comments. I’m excited to read your thoughts!

Gold 30Min Engaged ( Bullish & Bearish Entry Detected )Time Frame: 30-Minute Warfare
Entry Protocol: Only after volume-verified breakout
🩸Bullish From now Price - 3354
🩸Bearish Reversal : 3400
➗ Hanzo Protocol: Volume-Tiered Entry Authority
➕ Zone Activated: Dynamic market pressure detected.
The level isn’t just price — it’s a memory of where they moved size.
Volume is rising beneath the surface — not noise, but preparation.
🔥 Tactical Note:
We wait for the energy signature — when volume betrays intention.
The trap gets set. The weak follow. We execute.
XAU/USD (Gold) Triangle Breakout (07.08.2025)The XAU/USD pair on the M30 timeframe presents a Potential Buying Opportunity due to a recent Formation of a Triangle Breakout Pattern. This suggests a shift in momentum towards the upside and a higher likelihood of further advances in the coming hours.
Possible Long Trade:
Entry: Consider Entering A Long Position around Trendline Of The Pattern.
Target Levels:
1st Resistance – 3407
2nd Resistance – 3420
🎁 Please hit the like button and
🎁 Leave a comment to support for My Post !
Your likes and comments are incredibly motivating and will encourage me to share more analysis with you.
Best Regards, KABHI_TA_TRADING
Thank you.
Disclosure: I am part of Trade Nation's Influencer program and receive a monthly fee for using their TradingView charts in my analysis.

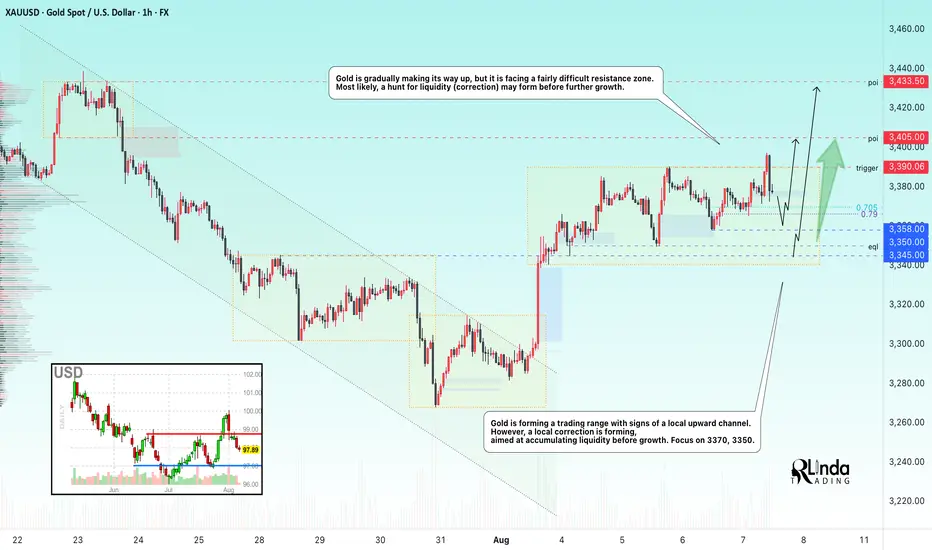
GOLD → Correction before a breakout and rallyFX:XAUUSD is gradually making its way upward, but it faces a fairly difficult resistance zone. Most likely, a long squeeze may form before further growth.
Gold is rising amid uncertainty: Expectations of key US labor market data (unemployment claims, labor costs), the possibility of a Fed rate cut in September after weak employment and services data, new trade threats (possible 15% tariffs on Japanese imports and restrictions on Russian oil supplies to China)
Key risks:
Trump's decision on Fed appointments (replacement of Kugler and Powell) and further escalation of trade conflicts could increase volatility. For now, dovish expectations and demand for safe-haven assets are supporting gold.
Technically, the focus is on the local range of 3390-3335 (3350). A false break of support could trigger growth...
Resistance levels: 3390, 3405, 3433
Support levels: 3365, 3358, 3350
The fall of the dollar is supporting the already bullish gold... However, before continuing its growth, the price is forming a correction, and a false breakout of support and liquidity capture could have a positive effect on the market for further upward movement...
Best regards, R. Linda!
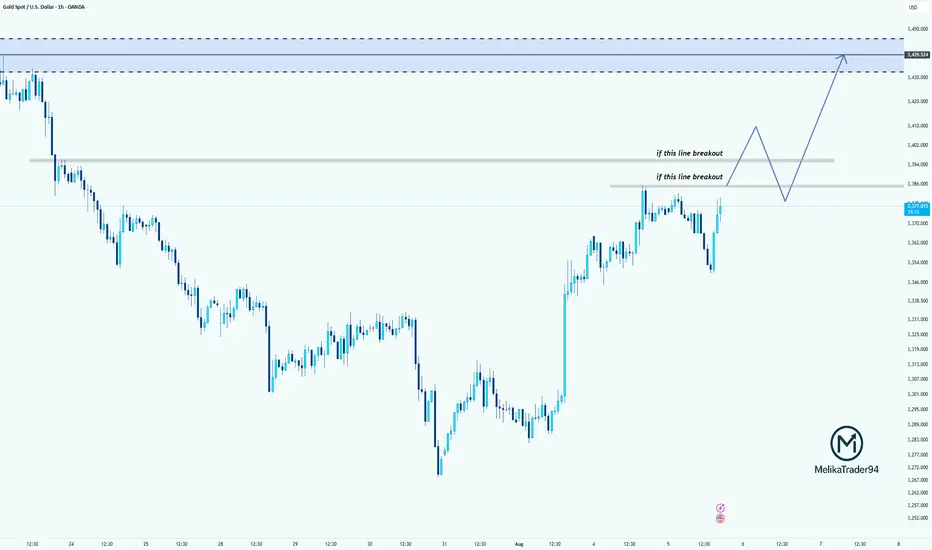
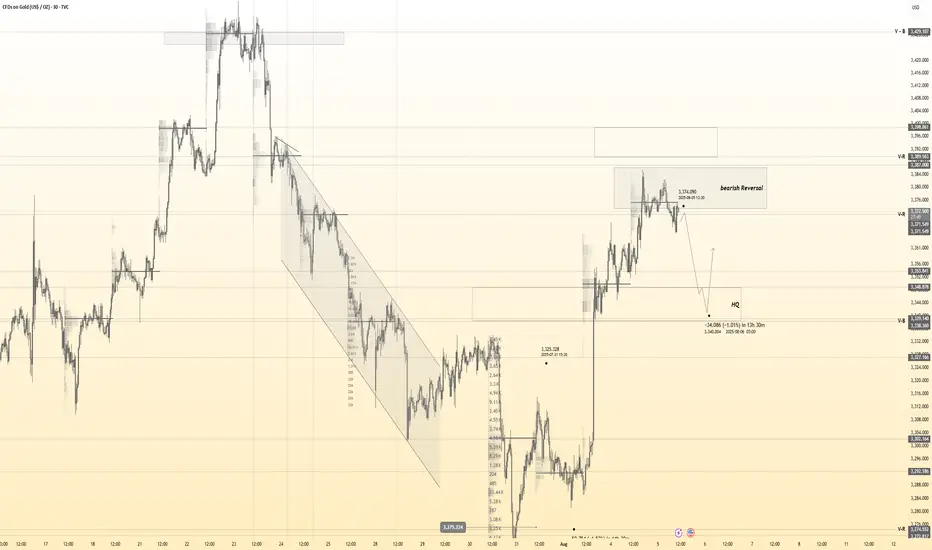
Breakout Levels in Focus for XAUUSDWhy did I say to cancel the last position? because gold is in the critical area!
Price is testing a key resistance area around 3374.
If it breaks above the first resistance level, we may see a bullish continuation toward the second breakout line.
If both levels are broken and retested successfully, the path toward the supply zone at 3430–3440 opens up.
Patience and confirmation are key here!
GOLD → A stalemate situation - a bullish wedgeFX:XAUUSD is unable to break through the resistance level of 3400. However, an ambiguous “bullish wedge” pattern is forming on the chart...
The price of gold retreated from a two-week high on profit-taking. The correction intensified after the US imposed tariffs on imports of gold bars (1 kg), which could disrupt supplies from Switzerland and London.
Key supporting factors: Escalation of trade conflicts, concerns about the US economy and pressure on the Fed, questions about the Fed's independence after Trump's appointments
Risks: Short-term volatility ahead of US CPI data next week. However, fundamental drivers remain bullish.
Support levels: 3390, 3350
Resistance levels: 3405, 3435
The problem with the bullish wedge pattern is that it forms an ambiguous figure. We have an upward movement, but the pattern could easily reverse the local upward trend due to the fairly difficult resistance zone of 3390-3410.
If gold manages to consolidate above 3405, this will increase the chances of growth to 3435-3500.
BUT! There is a fairly high chance that the 3390 support level could be broken. In this case, the market could fall to 3350 before rising...
Best regards, R. Linda!

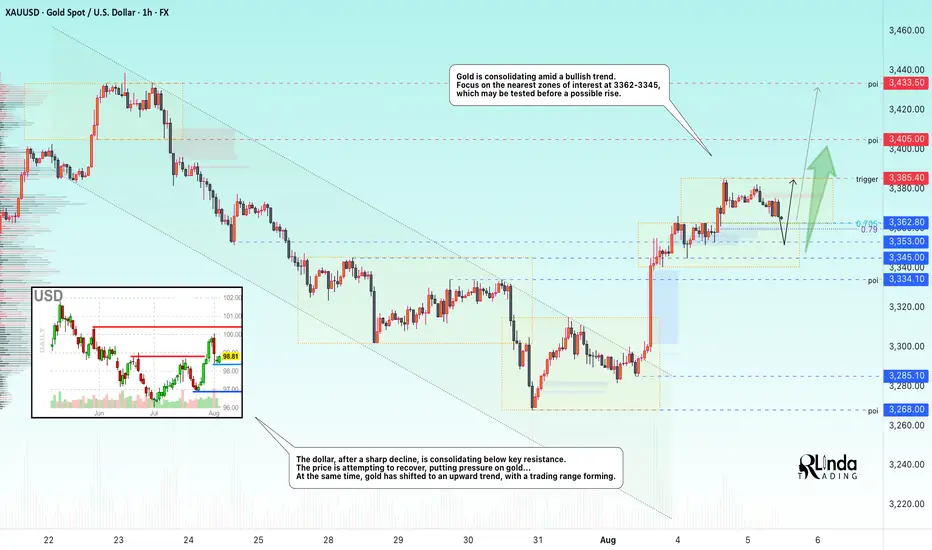
GOLD → Consolidation and correction before growthFX:XAUUSD continues to consolidate after a strong rally. The market is returning to a bullish trend, but a correction is possible before growth continues...
Gold is rising amid expectations of Fed policy easing. The market is finding support amid:
a 90.5% probability of a Fed rate cut in September, weak US employment data, and dovish comments from Fed officials.
The market is waiting for news that could determine further movement. ISM Services PMI data: strong figures could temporarily support the dollar, while weak figures could increase pressure on the USD. Questions about the Fed's independence after Trump fired the head of the BLS. Gold is maintaining its upward momentum, but its dynamics will depend on macro statistics and the Fed's response.
Technically, the focus is on the local trading range of 3385 - 3363 - 3353.
Resistance levels: 3385.4, 3433
Support levels: 3362, 3353, 3345
A retest of support and holding the price above key support could trigger a continuation of the uptrend, but it is important to pay attention to the fundamental background.
Best regards, R. Linda!
Lingrid | GOLD Short-Term Correction From Psychological LevelOANDA:XAUUSD is currently retesting the broken triangle structure from below, having rebounded from the ascending support zone. The price is approaching a confluence near 3,400–3410, where prior breakdown and resistance meet. If this level holds as resistance, the setup favors a bearish continuation toward 3,340 and possibly deeper. The broader structure shows lower highs and increasing rejection pressure below the resistance zone.
📉 Key Levels
Sell trigger: 3,400 rejection
Sell zone: 3,398.660–3,410
Target: 3,340
Invalidation: Break and hold above 3,410
💡 Risks
Momentum from recent rebound could challenge resistance
A higher low formation could tilt sentiment bullish
External factors (Fed, inflation data) may inject volatility beyond the range
If this idea resonates with you or you have your own opinion, traders, hit the comments. I’m excited to read your thoughts!

XAU/USD | Gold at a Turning Point – Breakout or Breakdown Ahead?By analyzing the gold chart on the 4-hour timeframe, we can see that after our last analysis, gold continued its correction and dropped to $3358. It’s currently trading around $3367, and for the bullish scenario to remain valid, we need to see price hold above $3358 and soon close above $3370. If this happens, another bullish move could follow.
Otherwise, if gold breaks and stabilizes below $3358, this scenario will be invalidated, and the alternative outlook suggests further downside toward $3349 and $3339. This analysis will be updated — and don’t forget to show your support, friends!
Please support me with your likes and comments to motivate me to share more analysis with you and share your opinion about the possible trend of this chart with me !
Best Regards , Arman Shaban

GOLD 1H CHART ROUTE MAP UPDATE & TRADING PLAN FOR THE WEEKHey Everyone,
Please see our updated 1h chart levels and targets for the coming week.
We are seeing price play between two weighted levels with a gap above at 3370 and a gap below at 3348. We will need to see ema5 cross and lock on either weighted level to determine the next range.
We will see levels tested side by side until one of the weighted levels break and lock to confirm direction for the next range.
We will keep the above in mind when taking buys from dips. Our updated levels and weighted levels will allow us to track the movement down and then catch bounces up.
We will continue to buy dips using our support levels taking 20 to 40 pips. As stated before each of our level structures give 20 to 40 pip bounces, which is enough for a nice entry and exit. If you back test the levels we shared every week for the past 24 months, you can see how effectively they were used to trade with or against short/mid term swings and trends.
The swing range give bigger bounces then our weighted levels that's the difference between weighted levels and swing ranges.
BULLISH TARGET
3370
EMA5 CROSS AND LOCK ABOVE 3370 WILL OPEN THE FOLLOWING BULLISH TARGETS
3392
EMA5 CROSS AND LOCK ABOVE 3392 WILL OPEN THE FOLLOWING BULLISH TARGET
3416
EMA5 CROSS AND LOCK ABOVE 3416 WILL OPEN THE FOLLOWING BULLISH TARGET
3429
EMA5 CROSS AND LOCK ABOVE 3429 WILL OPEN THE FOLLOWING BULLISH TARGET
3439
BEARISH TARGETS
3348
EMA5 CROSS AND LOCK BELOW 3348 WILL OPEN THE FOLLOWING BEARISH TARGET
3328
EMA5 CROSS AND LOCK BELOW 3328 WILL OPEN THE FOLLOWING BEARISH TARGET
3313
EMA5 CROSS AND LOCK BELOW 3313 WILL OPEN THE SWING RANGE
3296
3281
As always, we will keep you all updated with regular updates throughout the week and how we manage the active ideas and setups. Thank you all for your likes, comments and follows, we really appreciate it!
Mr Gold
GoldViewFX

XAU/USD | Bounce in Play – Watching $3350 Support for Next Move!By analyzing the gold chart on the 4-hour timeframe, we can see that after hitting the first target at $3361, gold continued its rally and reached our second supply level at $3385. Upon reaching this key level, the price faced strong selling pressure, dropping over 350 pips down to $3349. Gold is now trading around $3363, and if it can hold above the $3350 support level, we could expect another bullish push. The next upside targets are $3367, $3375, and $3385. This analysis will be updated in the coming hours with your continued support!
Please support me with your likes and comments to motivate me to share more analysis with you and share your opinion about the possible trend of this chart with me !
Best Regards , Arman Shaban

Gold 30Min Engaged ( Bearish & Bullish Entry Detected )Time Frame: 30-Minute Warfare
Entry Protocol: Only after volume-verified breakout
🩸Bearish From now Price - 3373
🩸Bullish Reversal : 3341
➗ Hanzo Protocol: Volume-Tiered Entry Authority
➕ Zone Activated: Dynamic market pressure detected.
The level isn’t just price — it’s a memory of where they moved size.
Volume is rising beneath the surface — not noise, but preparation.
🔥 Tactical Note:
We wait for the energy signature — when volume betrays intention.
The trap gets set. The weak follow. We execute.
Gold Bounces from PRZ — Is a Short-Term Rally Underway?Gold ( OANDA:XAUUSD ) started to rise from the Support zone($3,307-$3,275) as I expected in the previous idea .
Gold is currently moving near the Support zone($3,350-$3,326) , Potential Reversal Zone(PRZ) , and $3,334 (Important price) .
From the Elliott wave theory , it seems that Gold has completed its 5 impulsive waves and now we should wait for corrective waves . Corrective waves can complete at the Potential Reversal Zone(PRZ) .
I expect Gold to rise to $3,383(at least) in the coming hours .
Second Target: $3,396
Note: Stop Loss (SL) = $3,321
Gold Analyze (XAUUSD), 1-hour time frame.
Be sure to follow the updated ideas.
Do not forget to put a Stop loss for your positions (For every position you want to open).
Please follow your strategy; this is just my idea, and I will gladly see your ideas in this post.
Please do not forget the ✅ ' like ' ✅ button 🙏😊 & Share it with your friends; thanks, and Trade safe.

XAU/USD Bullish Setup Building MomentumGold has reclaimed bullish momentum after a strong bounce from the recent demand zone around 3319–3322. The chart shows a clear Change of Character (CHOCH) and subsequent Break of Structure (BOS), suggesting buyers are regaining control. Price is now trading above the Ichimoku cloud, further confirming bullish pressure. The upward arrow highlights the potential path toward the next key resistance area near 3380–3400. As long as price sustains above the previous structural break and the cloud base, continuation toward the upside remains likely. Market structure favours buying opportunities on dips, with bulls targeting a higher move in the short term.
Entry Buy: 3334
Target Point: 3404
If you found this analysis helpful, don’t forget to drop a like and comment . Your support keeps quality ideas flowing—let’s grow and win together! 💪

XAUUSD – Bears Gave It a Shot, But Bulls Still in Control1. Quick recap of yesterday
In yesterday’s analysis, I highlighted the possibility of a short-term correction on Gold and noted that, although risky, a short trade could be justified. Acting on that conviction, I took a short with a sniper entry, capturing over 250 pips in floating profit. However, Gold found strong support around 3350 and reversed aggressively. I closed the trade with a more modest +140 pips gain.
2. Key development: NY session reversal
Despite early signs of weakness, the New York session flipped the script, sending Gold back toward the top of the daily range. The daily close near highs tells us one thing:
➡️ The bulls aren’t done just yet.
3. Technical outlook
• Resistance remains firm at 3375–3380+ zone
• A clear breakout above this zone opens the door for 3400+, with a likely magnet at 3430
• As long as the market holds above this week’s low, dips are buyable opportunities
4. Trading plan
For now, the bias shifts back to the long side. I’m watching for intraday dips to build longs, with invalidation below this week’s low. The structure favors continuation — but only if 3380 gives way we have confirmation.
5. Final thoughts
Gold may have teased the bears, but the real power still lies with the bulls. If momentum kicks in above 3380, we could be on our way to test 3430 soon. 🏹
Disclosure: I am part of TradeNation's Influencer program and receive a monthly fee for using their TradingView charts in my analyses and educational articles.

How to Read COT Data: Understanding Big Players’ Order FlowHey whats up traders, today Im going to reveal my COT approach. If you’re serious about finding higher timeframe bias based on what the big players are doing, then COT data is a tool you need to know. It offers unique insights into the positioning of institutional traders—and if read correctly, it can help you align with real market momentum rather than noise.
Before we break it down step-by- step. I want to mention that this is my personal approach. Larry Williams is doing it differently and I have seen some other approaches. This is what works for me, might you find it also usefull.
What Is COT Data?
The Commitment of Traders (COT) report is published every Friday by the CFTC (U.S. Commodity Futures Trading Commission). It shows the open positions of various market participants in the futures markets as of the previous Tuesday.
This data is based on the requirement that large traders must report their positions once they pass a certain threshold. In short, we’re peeking into the order flow of institutions—excluding high-frequency trading and market making noise.
Hope you already recognized small disadvantage to us as retail traders.
Big players report data on Tuesday and it's published on Friday. So we basically have it late and we dont know what has happen in last 3 days. But no worry I will show you my trick how to read between the lines.
COT helps us:
• Understand HTF (Higher Timeframe) bias
• Spot shifts in institutional positioning
• Identify trend continuations or potential reversals
• Avoid getting trapped in retail sentiment traps
It’s not a standalone entry tool, but rather a macro confirmation layer for swing or position trades. Huge advantage by following large players is that they are trading on fundamentals and you dont need to worry about that - you just follow them. But you must follow the right participants, because there is few.
Who Are the Market Participants?
The COT report breaks down traders into several categories. Each one has a different motive and behavior in the market:
1. Commercials
• Think of them as hedgers.
• These are producers, manufacturers, and institutions trying to lock in prices for raw materials or currencies.
• They are usually contrarian at extremes.
When they reach record net long or net short positions, reversals often follow.
2. Non-Commercials (Speculators)
• These are institutional funds, hedge funds, and large speculators.
• Their goal? Profit.
• Often, they follow trends and their positioning reflects the broader market sentiment of the big money.
3. Dealers
• Mostly big banks and institutions facilitating trades.
• They manage risk rather than speculate heavily, so they typically take the opposite side of speculative flows.
4. Leveraged Money
• Hedge funds using high leverage.
• Their positions often reflect short-term speculative behavior.
• Watching their net positioning and changes week-to-week can give clues on momentum exhaustion.
Now you might think which one to follow and Yes you can build your strategy on following any of them fore example
Larry Williams - been trading base on Commercials
Anton Kreil - suggest following Leveraged money
I tried both but for me works best - Non commercials ( Speculators)
Again here you cant say definitely which one is right or wrong. What works for you is right. Thats it.
There are multiple versions of the report, but here are the most commonly used, Im using - ✅ Traders in Financial Futures (TFF)
• Focused on financial markets like forex, bonds, and indexes.
Where to find COT data?
It's free and you can find it on the SEC website there is simple week to week format. As you can see below. Many traders are watching this.
I dont say this is wrong but you dont have complete data - missing big picture.
As you can see here these data below are clearly giving you a picture about an order flow and positioning changedsvn the positions which can confirm trend or help you spot potential reversal you need to watch bigger data sample. Institutions doesnt reverse market in a week, they need to of load positions and I it takes them some time. Which will explain later.
Im collecting the data to the collums. I want see longs, shorts of commercials and from that I calculate. Following
Longs % exposure
Shorts % exposure
Net positions
13 weeks average
Historical Highest positions
Historical Lowest Positions
Relationship between these numbers helps me justify whats going behind the price action, but also spot strong levels. I will show you how to put it together with the context of the charts and then I will show you few order flow patterns examples, it's not difficult but it requires a bit of practice.
Bullish Pattern - Longs growing / Shorts being closed
This is the strongest COT patter and clean sign of buying
This is classing pattern what we have just seen on the EURUSD
Notice how longs has been growing constantly and net positions confirms that.
In may been able to see rapid shorts closing, which and confirmed bullish trend and we can look just for the bullish setups.
Now lets look to the USDJPY chart it will be tricky because it's all red and looks tricky but focus to the numbers and price action, how longs are growing while shorts being closed. Very weak JPY.
Bearish consolidation Shorts being build
Massive shorts being added int he consolidation phase longs doenst move at all. Further big drop coming. This is now happening on the AUDUSD. Look at this tight price consolidation and let's read what is happening. just look at the COT its clean longs around 23K constantly while they are building massive shorts. Whats gonna happens next is clear.
Profit taking move
This ofter occurs when we can see sharp move above the highs but without real longs being added, rather they being closed. As on our example below on the gold. We can see massive profit taking on longs while price was moving up. But they were not been adding shorts. What doest it tell us. They do not want to trade full reversal - not building short position, but market is overheated and they taking profits to buy later for lower or price can go to the consolidation where they will be building short, but definitely its late for us to go long.
Here is another example on USDCHF
Notice longs positions in the moment where there was 46K long and then next week change -12K net. It's a huge change which has started Sell off. But look in to Shorts , there is no heavy shorting, price simply go down based on huge longs profit taking. This is why its important to look in to bigger picture because if you look only in to week to week data. You will still see bigger longs than shorts and it will give you bullish opinion. Hope it's clear. And by the way now we can see 2 weeks with more then +3.4K longs. Its getting bullish IMO.
Now lets look to the another example on the USDCAD
Now we will use one of my past analysis where based on the data I predicted further move. And here I want to mention one thing. Even though we can see COT being bearish. It doesnt mean that price cant go up in short term (can be be 2- 3 weeks) There for you still need to use price action and dont just blindly short, but short run above the highs, because this is where big players add shorts. Not on the lows.
P rice moving up shorts being added - Reversal coming
This is showing positions building for the sell. In this case you can see both growing longs and shorts remember. Big players are hedgers, they are taking longs to move price up so they build shorts. Once they got their positions they close longs and sell of starts.
Lets look to my TV analysis where I have seen shorts grown recently while GBP was moving up close the Monthly Order block , but notice the shorts colum how the shorts were growing recently and also longs dropped from 110K to 100K.
Clena signs of the reversal but again I waited for a pullback above the weekly highs. Click to open a chart bellow
This was a prediction from few week ago. Now let's look how the data looks right now. On the GBPUSD chart below we can see reveal in the data. Long significantly dropped by 50% and shorts increased by 50%. This is a clean reversal pattern in the COT. Look at net positions it clearly flipped to the bearish and big drop is coming.
Few more tips
Remember they know we are watching this data and what we see is what they want us to see, so they are often trying to hide their positions as long as possible. Thats why intra-week reversal are happening on Wednesday after they report their positions.
They cannot hide the data forever, follow the data week by week to keep in track whats happening. It will increase your winning ratio.
Every 3 months there is a new futures contract. The must close the positions and reopen them in to the new contract, They are using it for reversals.
Also some if there is some US holidays on the day when report should be released to the public its delayed to the next week. And thats when they do biggest positions changes secretly.
COT data isn’t a magic crystal ball—but it’s a powerful tool if you know how to combine it with technical analysis. You need to use your mechanical system. It perfectly fits with my CLS strategy and It's suitable for swing traders.
Think outside the box. Even when you see bearish COT - dont be stupid to sell low. It's not NOD order flow for intraday scalping, you have time. But if you something is clearly bearish every run above weekly and daily highs is high probability Sell in the smart money trend.
Dont hesitate to ask any questions and follow. I share COT weekly updates.
“Adapt what is useful. Reject whats useless and add whats is specifically yours.”
David Perk aka Dave FX Hunter
