Gold long: Completion of Cycle degree Wave 4Hello, in this video, I go through Gold Elliott Wave structure on a cycle level (again) before zooming in on the latest 5-waves structure that is Cycle level wave 4. I talk about using existing broken trendlines and how that allows me to determine the strength of a move when there are false breakouts, whether to the upside or the downside.
Lastly, I discuss on how to trade this on the short-term using lower timeframe and price action. Most importantly, where to set the stop and the rationale for it.
Good luck!
GOLD trade ideas

Gold non-farm payrolls are bullish, long and short positions ana
Rather than envying the fish by the river, it's better to retreat and weave your net. We often envy the wealth others can earn by investing in the gold market. We often watch them enthusiastically investing, but we ourselves are afraid to enter the market. The two major factors that drive the market, technology and news, are a topic of constant debate among investors. To navigate the market, one must master the art of attack and defense to remain rock-solid while remaining at the forefront. As the saying goes, trust me, and I will reward you with profits!
Gold Data is Bullish!
The positive non-farm payroll data sent gold soaring, with gains completely erasing all of the week's losses. Currently, gold's trend has reversed the stagnant bullish and bearish trend. After breaking through the 3300 mark and rising all the way to 3348, it shows no signs of stopping. A further test of the 3370 level is not out of the question!
Due to the strong bullish data, if you don't immediately chase longs or place a breakout long order during the first wave, you'll likely have little chance of a pullback. Therefore, you should remain aggressive in your trading strategies. We recommend a pullback to the 3332-30 level to continue the bullish trend. Upward pressure is expected at 3372-75! The market fluctuates violently, and more real-time entry and exit points are mainly based on Yulia's real-time guidance!

Gold price analysis week 32The recently released Nonfarm data has become an important catalyst, officially breaking the previous bearish wave structure and shaping a completely new uptrend for gold prices. Breaking above the wave 1 peak at the 3315 area is a clear confirmation signal that the downtrend has ended.
In that context, the trading strategy for next week should prioritize buying orders. This rally has the potential to push gold prices to historical peaks if the bullish momentum is maintained with stable trading volume.
Specific trading strategy:
Important support zone: 3333 – 3315
Short-term resistance zone: 3373 – 3416

GOLD - Cut n Reverse Area? Holds or not??#GOLD... market perfect moved as per our analysis and now m
It's just reached at his current ultimate area that is 3404
Keep close with and holding of that area means drop...
NOTE: we will cut n reverse above althat area on confirmation.
Good luck
Trade wisely
GOLD - been waiting for 2 weeksTeam, I have been waiting GOLD for two week to short at 3404-3410
i just woke up and missed the short
Price current at 3401 - I am shorting NOW
Target 1 at 3386 - take 70% volume and BRING STOP LOSS TO BE
Target 2 at 3365
LETS GO

GOLD AGAINGold hit our BE, and still believe for sell to buy...We re-entered shorts. We trust still setup

XAUUSDlook TF M5
Entry Setup and Risk Management:
Active Buy Limit at 3,368.00 (Volume: 10 million USD)
Entry is pending at the lower Order Block (OB) zone and the imbalance area.
SL (Stop Loss): Around 3,365.00
TP (Take Profit): 3,381.00 – 3,381.70
Manual Buy at 3,370.41 and 3,370.49 (Volume: 5 million USD each)
Both positions are currently open, targeting the same TP area — the Daily OB zone.
Price Confirmation:
The current price is around 3,371.73, showing bullish potential (upward reversal).
There is a bullish reac

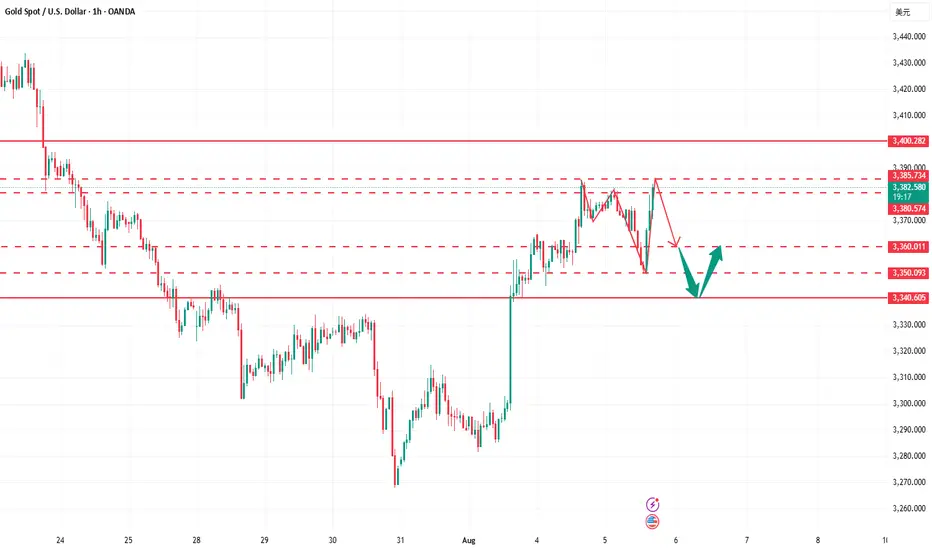
Today's bulls sprint to 3400
Based on the 4-hour chart, short-term support is currently at 3370, with 3350 being the dividing line between bullish and bearish strength. If the daily chart stabilizes above this level, the bullish trend remains unchanged. However, caution should be exercised when entering short positions against the trend until the daily chart breaks below 3350. I will update you on the specific trading strategy during the trading session.
Gold Trading Strategy:
Go long on gold dips to 3370-73, and add to your long position on dips to 3350-55. Set a stop-loss at 3343, and target 3390-3395. Hold if it breaks above this level.
Gold Market Insight – Daily FlowGold market mitigated daily supply at 3389, triggering a price plunge aimed at clearing imbalance through the 3332 zone. This move reflects the bearish reaction to overhead supply and the market’s intent to correct inefficiencies before any potential reversal.
🟡 Key Zones:
Supply Mitigated: 3389
Imbalance Targeted: 3332
Watch for: Buyer reaction near 3332 for signs of bullish defense or continuation toward lower demand zones. follow for more insights , comment and boost idea

Gold - Breakout and retest of a bullish FlagBullish flag break out and price is in a demand zone. As long as the demand holds, pressure will be to the upside.

Analysis of gold market operation strategies and ideas next week
Gold rallied unilaterally on Friday following positive non-farm payroll data, reaching a new high for the week. This week's candlestick formed a hammer pattern, suggesting further upside potential next week. Bulls continued their push late Friday, closing at 3363. Next week, we will continue to monitor short-term resistance around 3370-3375. We will continue to buy on pullbacks. If your current trading is not satisfactory, I hope I can help you avoid investment setbacks. Welcome to discuss your options!
Based on a 4-hour analysis, short-term resistance will be seen around 3370-3375 next week, with a key resistance around 3395-3400. We will continue to buy on pullbacks. In the intermediate range, we recommend maintaining a cautious wait-and-see approach. I will provide detailed trading strategies during the trading session, so please stay tuned.
Gold Trading Strategy:
Go long on gold pullbacks to 3330-335, with a stop-loss at 3318 and a target at 3370-3375. Hold on if it breaks above this level.

August 4, 2025 - XAUUSD GOLD Analysis and Potential OpportunitySummary:
Gold is currently in a sideways-to-bullish structure. Strong resistance remains around 3440–3450; if this level fails to break, it offers a high-probability shorting opportunity. Near-term focus is on the 3350 support level — if it breaks, bearish momentum may pick up and selling the pullback becomes ideal. If 3350 holds, consider buying the dip and targeting a test of 3375. Stay flexible and responsive to price action at key levels. Manage risk accordingly.
📍 Key Levels to Watch:
• 3400 – Resistance
• 3384 – Resistance
• 3375 – Key resistance
• 3365 – Resistance
• 3350 – Psychological level
• 3345 – Support
• 3334 – Key support
• 3323 – Support
• 3310 – Support
📈 Intraday Strategy
SELL if price breaks below 3350 → target 3340, then 3334, 3323, 3315
BUY if price holds above 3365 → target 3370, then 3375, 3384, 3394
👉 If you find this helpful or traded using this plan, a like would mean a lot and keep me motivated. Thanks for the support!
Disclaimer: This is my personal view, not financial advice. Always use proper risk control.

Analysis For The Next WeekHello Traders,
I hope you had joyful weekend, the market is going to open tonight so we are back with new idea for next week.
As you know gold was dropping for last two weeks and suddenly pumped almost 650 pips after the impact of NFP News. We saw the high pressure in the market on Friday due to news impact.
Gold has broken the buy trend line D1,H4. According to D1,H4 gold still wants to drop till 3251.
If price respects area 3372-3393, then gold will drop. If price breaks the area 3400 then it will pump and it can make another All Time High. As you know 3501 is the All Time High (ATH). Price can break if there will be a breakout for bullish moment.
Keep in touch and drop positive comments here, Thanks.

Gold Trend Reversal: MSS Completed Eyes on OB and Breaker Block!The gold market has executed a Market Structure Shift (MSS) in the New York session, indicating a trend reversal. Initially, the market made a Break of Structure (BoS) to the upside, but later dropped sharply and closed below the MSS level, confirming a bearish shift. Currently, the market is likely entering a retracement phase and may look to fill its Pending Demand (PD) arrays.
There are two critical levels from which the market could potentially drop again:
1. The first is an Order Block (OB).
2. The second is a Breaker Block (BB).
Keep a close watch on these two levels. If the market returns to either and presents bearish confirmation signals, it could resume the downward move towards swing lows.
Do Your Own Research (DYOR).

Ready to BUY Gold to target 3445✏️ OANDA:XAUUSD confirms a continued uptrend as it breaks out of the triangle. The price is heading towards 3430 today and even higher at 3445. Today is Friday, the weekly candle close, and according to the range of the candle, it is possible to reach those highs. The BUY strategy can be activated at the moment and hold the position until the US session with the continuous US session buying pressure in recent days.
📉 Key Levels
Support: 3385-3365-3333
Resistance: 3419-3431-3445
Buy trigger: Confirmation of the h4 candle buying pressure above 3385
Buy trigger: Rejection of the support zone at 3365
Target 3445
Leave your comments on the idea. I am happy to read your views.

Strike with precision and win in the gold trading market!Gold continues to fluctuate in an upward structure, with lows gradually rising, showing that the bulls are still in a dominant position. The current key support has moved up to the 3360 line. Before this position is effectively broken, the overall idea is to maintain a low-long strategy. It should be noted that the current market has been consolidating at a high level for three consecutive days, and has the basis for further strengthening. It is not advisable to wait for a sharp pullback at this time, but to pay attention to the continuity opportunities of direct pull-ups. It is recommended to seize the strong continuation opportunities in the current period in terms of operations, and strategically postpone it to the European and American trading sessions for simultaneous execution. Specifically pay attention to the long order layout opportunities in the support area of 3375-3360, and the upper resistance is around 3390-3405. Overall, we should flexibly participate in the high-altitude and low-long rhythm in this range. It is recommended to wait and see in the middle position, chase orders cautiously, and wait patiently for key points to enter the market.

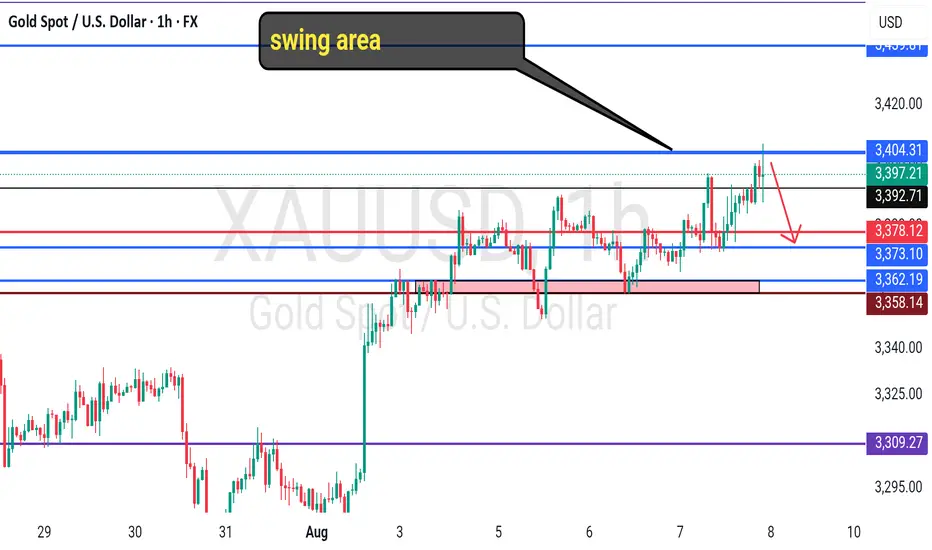
XAUUSD - Short XAUUSD Short Trade Idea – 4H Chart
Price has made a strong move up, but it's now entering an area where sellers were in control before.
Why I'm looking to short:
Price is retesting a supply zone where the last big drop started
It’s also near a resistance level and rejected from there
The downtrend is still valid with lower highs
There's a good chance price could drop to grab liquidity below
*** Target areas:
First target: around 3288
Final target: around 3250, where we have a demand zone
*** Invalidation:
If price breaks and closes above 3385, this short idea is no longer valid.

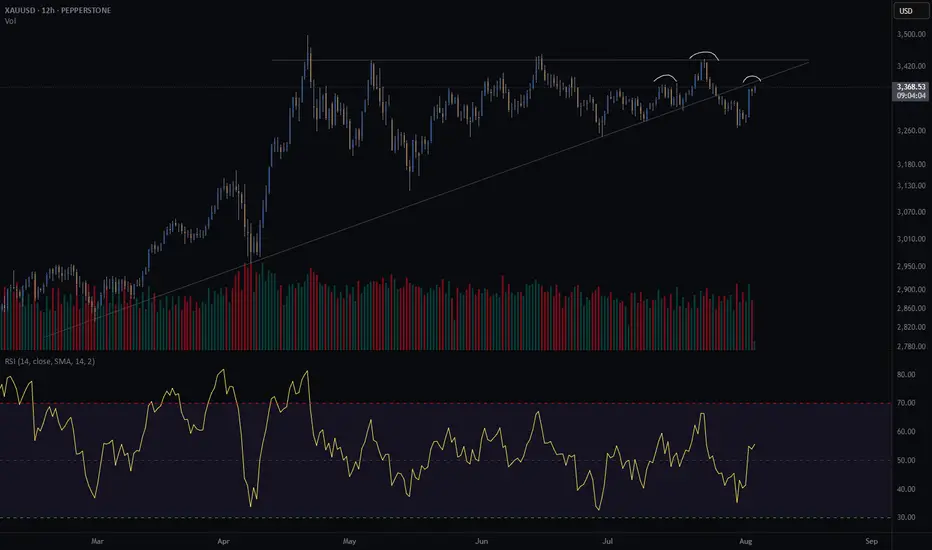
Gold crash (SHORT) - head and shouldersGold is at an interesting crossroad.
It broke through its diagonal support on Friday the 25th of July.
Price is retesting previous support. Does it turn into resistance?
Further confluence is a head and shoulders of the H8 and H12, with the right shoulder coinciding with the retest of the diagonal.
Since I am long gold with my investments, I am hesitant to short gold through my trading business. However, if my pattern is available, I take the trade. This will be a very short term trade - a few days at most if the trade goes in my favour.
Risk/reward = 12.6
Entry price = 3382.5
Stop loss price = 3396.2
Take profit level 1 (50%) = 3230
Take profit level 2 (50%) = 3181
The risk reward is exceptionally high. However, I have taken a more conservative approach with my entry because of my apprehension to short gold. For this trade I will enter at the extreme end of the range in which I will look for entries. This is the reason for such a high RR. It might result in me missing an entry.
XAUUSD 8/4/25 followupPrice closed strongly above Sunday's open so I am just looking for retracements to the upside from here.

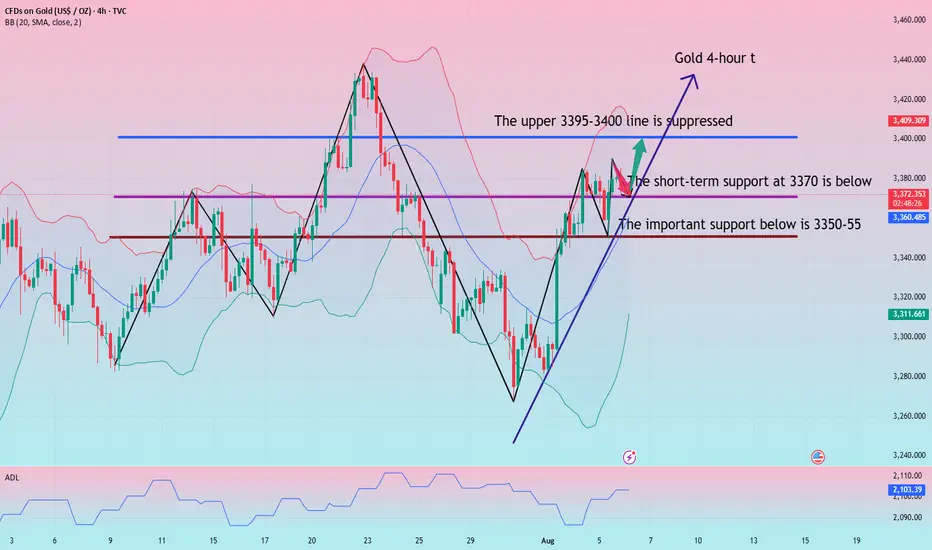
The best ambush point for short positions below gold 3400.The daily structure of gold still maintains a bullish dominant pattern. The upper target is the upper Bollinger band of 3400. If it breaks through this position, the upside space will be further opened up. The 4-hour Bollinger band is gradually closing, and the price is fluctuating in the range of 3400-3360. In the short term, it is still treated with range thinking. Before an effective breakthrough, the operation can adopt a high-altitude and low-long strategy. Gold is currently at a critical node of change. If it rises and falls in the evening, it may release a temporary peak signal. The area below 3400 is expected to become an opportunity for the layout of medium-term short positions. The overall recommendation is to remain cautious, respond flexibly to changes in rhythm, and strictly control risks.
Gold operation suggestion: You can continue to try short selling in the 3390-3400 range, with the target at 3380-3370.

How to accurately capture golden trading opportunities?Bullish trend is still the main trend of gold at present. After rising to 3368 at the opening today, it fell under pressure and fluctuated. Technically, it has tested the pressure level and needs to be adjusted. The overall high-level carrying capacity has also declined, so it is not advisable to chase the rise too much. In terms of operation, it is recommended to wait for the price to stabilize before buying more. Judging from the current gold trend, the upper short-term resistance is in the 3380-3385 area, and the key pressure is at the 3395-3400 line; the lower short-term support is in the 3365-3355 area, and the key support is in the 3350-3345 range. The overall suggestion is to arrange long orders on dips around the support area, and try to maintain a stable wait-and-see attitude in the middle position. I will prompt the specific operation strategy at the bottom, please pay attention in time.
Gold Trading Strategy: Buy in batches as gold retreats to the 3365-3350 area, targeting the 3380-3385 area. If this resistance zone is broken, hold and look for upward movement.
GOLD CONTINUATION PATTERNHello folks, here we go again, This idea stuck in my head only today and its friday. rather shared it or none, but see the charts for stops and target. this might be your lucky day on my page.
Here is my idea, take it if you love to swing or watch it fade. Congrats were on 800 community or I got more followers because of this. and Previous idea we made a lot thats 1200 pips good for a month trade. lets see this August. my target is labeled this chart first at 3500 zone. next target will be posted on my notes or updated the idea. no charts until it breaks that labeled on chart. until it goes higher again.
You will never see this kind of idea for a month again. So follow on my page, I have some for you if you have small accounts.d m here
My goal is to target the highest TP will be above this new highs.

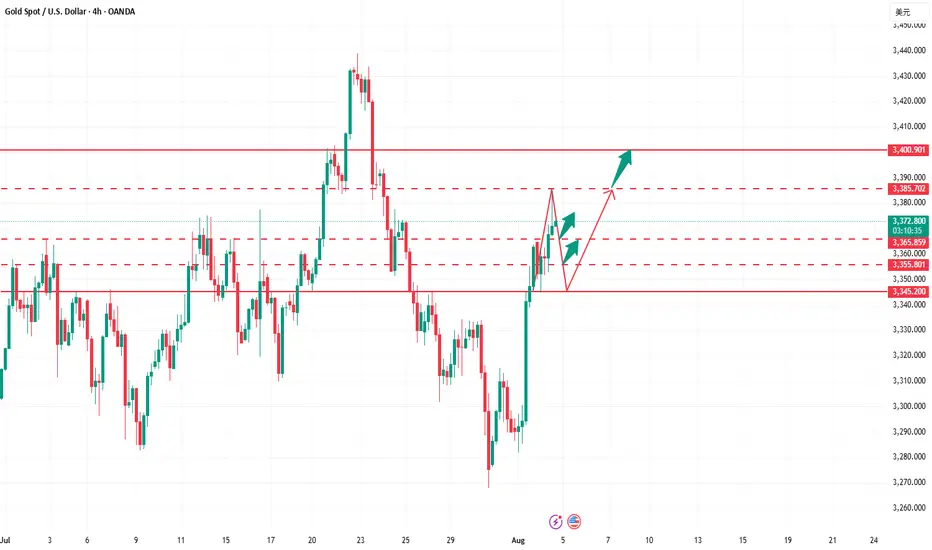
What does it matter if every step is just right?Today's gold fluctuation rhythm is basically consistent with our prediction. The rhythm from entry to profit-taking is clear, and the strategy is executed decisively. First, we decisively arranged long orders at the 3365-3370 line, and successfully took profit at the target line 3375, earning 150pips of profit. Then we decisively reversed and arranged short orders at 3375. The market fell back to around 3360 as expected, and realized 150pips of profit again. In the third round of operations, long orders were entered again near 3352, and the price rose smoothly to 3370 to take profit again. The overall rhythm was tight and profits were steadily pocketed. At present, gold has rebounded to around 3380-3385. We have deployed a new round of short orders in advance and will wait for the price to drop before arranging long orders. Overall, gold is in a volatile rhythm. Even if there is still room for upward movement in the future, it is likely to undergo a round of technical retracement adjustments first.