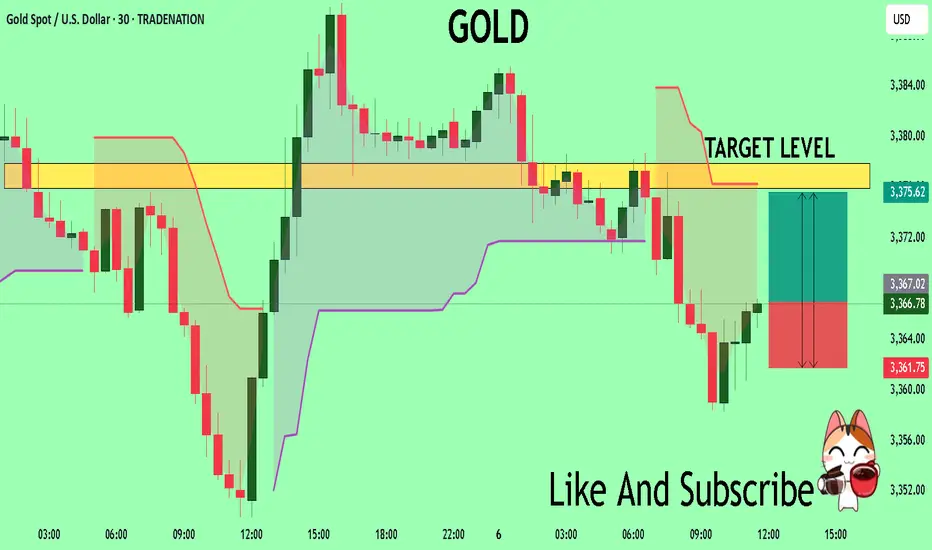
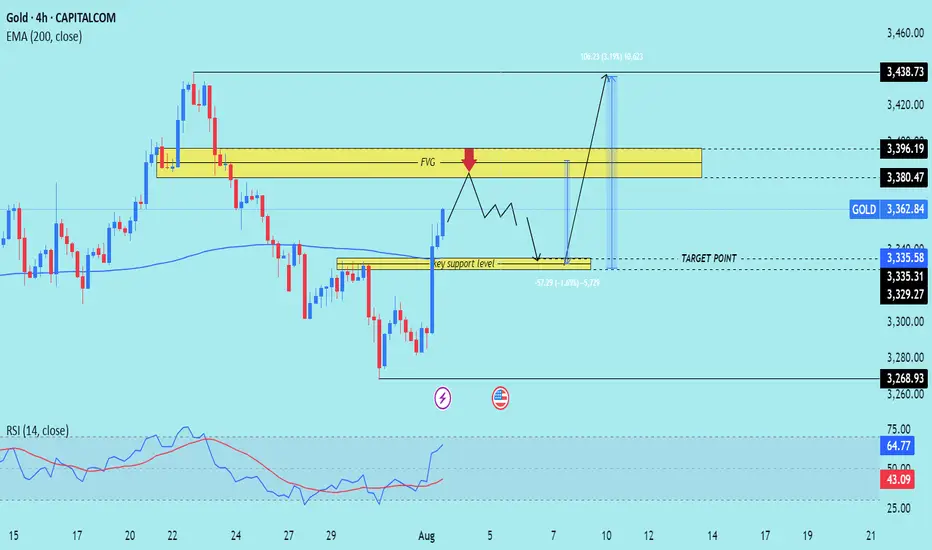
XAU/USD) Bearish Trend Read The captionSMC Trading point update
Technical analysis of (XAU/USD) on the 4-hour timeframe, showing both a potential retracement and a bullish continuation.
---
Technical Breakdown:
1. Current Market Structure:
Price recently made a strong bullish push from the key support level (~3,329–3,335), breaking structure to the upside.
It is now approaching a Fair Value Gap (FVG) and resistance zone between 3,380.47 and 3,396.19.
2. Key Zones Identified:
FVG / Resistance Zone: 3,380.47–3,396.19 — where price might initially reject (red arrow) due to unfilled imbalance and previous supply.
Key Support Zone: 3,329.27–3,335.31 — potential area of re-entry or demand if price pulls back.
EMA 200 (Blue): Currently at 3,335.58, aligning with key support.
3. Price Path Scenarios:
Primary Expectation: Price may tap into the FVG, face rejection, then pull back into the key support level for a higher low.
From there, it is projected to bounce back strongly toward the ultimate target at 3,438.73, marking a 3.19% upside move.
4. RSI (14):
RSI at 64.77, indicating strong bullish momentum but not yet in overbought territory. Favorable for continuation, but a short-term correction is possible.
Mr SMC Trading point
---
Trade Idea Summary:
Bias: Bullish (after a short-term rejection)
Entry Zones:
Watch for rejection at 3,380–3,396
Look to enter on a retest of 3,335–3,329 support
Target Zone: 3,438.73
Invalidation: Sustained breakdown below 3,329 or bearish engulfing with high volume
EMA & RSI Support: EMA 200 backs bullish bias; RSI confirms momentum
Please support boost 🚀 this analysis)
GOLD trade ideas
XAUUSD Long - DiscretionaryElite Analysis - Discretionary Trade
Not Rules Based Execution
Executed in a lower OB in lower time frame
Targeting upper liquidity pools
I believe we are bullish on gold until structured liquidity, than we will see an violent drop.

GOLD 1Hello to all traders. 😎😎
I hope all your deals will hit their targets. 🎉🎉
In my opinion, gold is currently moving within an ending pattern with a slight upward slope. This type of pattern is typically a reversal formation, and I believe it could lead to a drop in gold prices.
At the moment, I think gold might revisit the $3390–$3400 zone, and from there, we could see a deeper decline—first toward the bottom of the ending pattern at $3370, and if the pattern breaks, possibly down to $3340 or even lower.
However, if gold breaks above the $3400 level with strength, this analysis would be invalidated, and we could then expect a move toward the $3440 area.
⚠️⚠️⚠️⚠️Don’t forget to apply proper risk management!
What Do You Think?
Which scenario do you think is happen? **Share your thoughts!** ⬇️
Don't forget that this is just an analysis to give you an idea and trade with your own strategy. And don't forget the stop loss🛑🛑🛑
❤️❤️❤️The only friend you have in financial markets is your stop loss❤️❤️❤️
Please support me with your ✅' like'✅ and comments to motivate me to share more analysis with you and share your opinion about the possible trend of this chart with me 🙏😊
Be Happy , Ali Jamali

XAUUSD Gold Trading Strategy August 7, 2025XAUUSD Gold Trading Strategy August 7, 2025:
Gold prices are steady as US President Donald Trump has imposed an additional 25% tariff on Indian goods due to India's continued purchases of Russian energy. This new measure raises the current 25% tariff on Indian goods to 50%.
Fundamental news: The current market pulse is still mainly revolving around the tariff story initiated by Trump, in which spot gold is trading in a fairly narrow range. Gold is still waiting for further impact from the Fed's interest rate cut process, a weaker dollar will create support for non-yielding gold.
Technical analysis: The trading range of gold prices is currently narrowing, RSI on H1 and H4 frames is approaching the overbought zone. Gold prices have recovered, but resistance zones such as 3400 - 3405 and 3420 - 3425 can be short-term profit-taking areas for investors. Liquidity zones and Fibonacci frames show that the upward force of gold prices is showing signs of slowing down.
Important price zones today: 3373 - 3378, 3400 - 3405 and 3420 - 3425.
Trading trend today: SELL.
Recommended orders:
Plan 1: SELL XAUUSD zone 3402 - 3404
SL 3407
TP 3399 - 3390 - 3380 - 3360 - OPEN.
Plan 2: SELL XAUUSD zone 3423 - 3425
SL 3428
TP 3420 - 3410 - 3390 - 3370 - OPEN.
Plan 3: BUY XAUUSD zone 3373 - 3375
SL 3370
TP 3378 - 3388 - 3400 (small volume).
Wishing you a safe, successful and profitable trading day.💗💗💗💗💗

XAUUSD → Correction before a Breakout and RallyGold (XAUUSD) is expected to pull back slightly before making a bigger move up. Right now, it’s facing some resistance, so a small drop is likely. But the long-term trend remains bullish due to factors like possible Fed rate cuts and global uncertainty. After this correction, gold could break higher. Traders should watch for buying opportunities near support levels. The strategy is to "buy the dip" for a potential rally later.
Read the chart for entry and exit points
Do your own research before making any decision of Buying or selling trade in gold as market is more volatile...
This is not a financial advise to trade and this is just an educational purposes

XAUUSD LongElite Analysis (Published this after execution)
Price took previous session low
Went to lower time frame to look for confirmations to upper liquidity pools
Confirmed 10m BOS
Found a 1m OB
Checked all confirmations and executed
Targeting upper liquidity pools
XAUUSD / GOLDPOTENTIAL sell setup during newyork session .
sell zone: 3365-3368 //3368-3372
potential target: friday opening price or friday daily low
not financial advice. follow at own risk.. Don't all in.

Will Gold Break Out on Tariff and Fed Uncertainty?Gold’s price action is currently fluctuating above the trendline connecting higher lows from May 2025, potentially aiming for the trendline from December 2024, which aligns with the 2025 peak at 3,500.
A firm hold above the 3,400 and 3,450 levels could accelerate a move back toward the 3,500-record, with potential for further gains toward new highs at 3,780 and 4,000, respectively.
On the downside, a close below 3,340 may lead to a pullback to 3,280 for a possible rebound, or even a deeper retracement toward 3,230 and 3,130.
- Razan Hilal, CMT
GOLD Will Go Up! Buy!
Take a look at our analysis for GOLD.
Time Frame: 2h
Current Trend: Bullish
Sentiment: Oversold (based on 7-period RSI)
Forecast: Bullish
The market is approaching a key horizontal level 3,372.49.
Considering the today's price action, probabilities will be high to see a movement to 3,395.61.
P.S
Please, note that an oversold/overbought condition can last for a long time, and therefore being oversold/overbought doesn't mean a price rally will come soon, or at all.
Disclosure: I am part of Trade Nation's Influencer program and receive a monthly fee for using their TradingView charts in my analysis.
Like and subscribe and comment my ideas if you enjoy them!

GOLD M15 OUTLOOKAccording to M15 analysis gold market going in buy from today now market running in side wave from last few Hours now wait for good opportunity market will be touch SUPPORT ZONE you can buy from there dont be greedy use money management
TRADE AT YOUR OWN RISK
REGARD ALBERT

Gold is rising slowly, so can we adjust our direction?
When we first entered the market, we saw slogans everywhere, such as "Investing is risky, enter with caution." However, few people actually put this into practice. In the gold market, risk control comes first, followed by investment mentality, and finally, trading methods and strategies. Only by protecting your principal can you achieve profitability; otherwise, everything is just empty talk.
A logical explanation for gold's medium-term upward trend!
Gold rebounded sharply last Friday due to the weaker-than-expected US non-farm payroll report, and the market quickly adjusted its expectations for the Federal Reserve's policy direction, shifting to a more dovish stance. Although the market reaction seemed to indicate very weak data, the overall situation was not as bad as expected. The problem is that the market had previously bet on strong data, and pricing in a more hawkish outlook following the Fed's interest rate meeting has led to even weaker data, so even slightly weaker data could trigger a rapid repricing.
Next, the market's focus will turn to key economic data and speeches by Federal Reserve officials, particularly in the run-up to the September FOMC meeting. As long as incoming data remains benign, Fed Chairman Powell is expected to open the door to a September rate cut at the Jackson Hole annual meeting. From a broader perspective, gold is expected to maintain its upward trend as real interest rates are expected to continue declining. However, a short-term correction is still possible if interest rate expectations become hawkish.
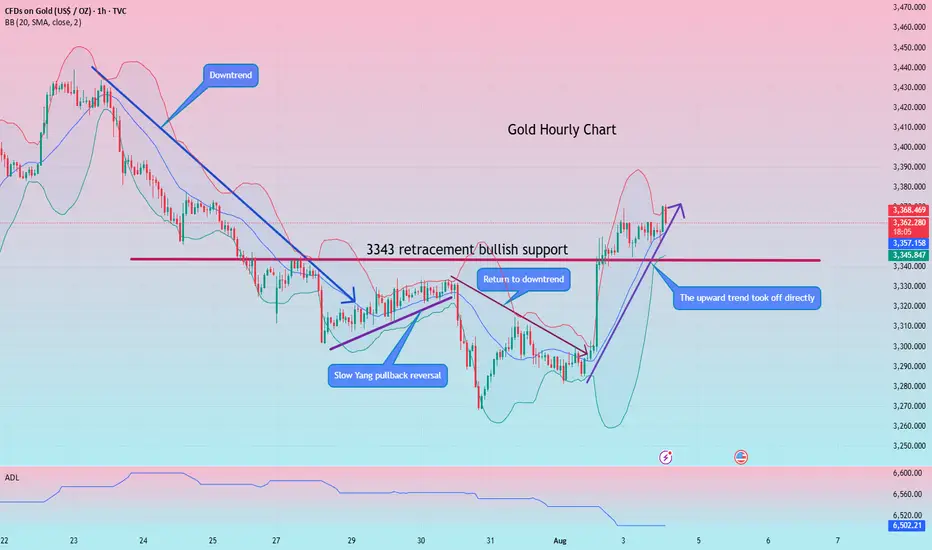
A Gold Trend Perspective!
Unfortunately, gold prices only reached a low of 3350 today before rising again. With no signs of a pullback near the US market close, our bullish dip buying opportunity at 3343 is somewhat difficult to enter. It appears that the upward trend will continue to test the key resistance level of 3380. If there are no dip buying opportunities, consider shorting!
The current hourly chart has broken through the support level, leading to a choppy morning session. The upward trend is likely to test the resistance level of 3380, while the support level of 3350 is key today. For the time being, we will use this range for range trading in the evening session. If there are any further market fluctuations, we will provide a new strategy in real time!
Gold: Short around 3380-82, defend at 3390, target at 3352-55! If it retreats back to around 3350 but does not break through, you can enter a long position!
Gold Trading Opportunity
---
### ⚡️ **– Harmonic Setup You Don’t Want to Miss**
🚨 **"We’re standing at the edge of a golden reversal!"**
The *Gartley* and *Deep Crab* harmonic patterns have formed with stunning precision, signaling a powerful potential drop*. This level is not just a number—it’s a pressure point where a reversal pattern converges with a high-volume **supply zone**, amplified by a strong **RSI overbought signal**.
💼 With disciplined **risk management** and clearly defined **stop-loss and multi-tier targets**, we’re positioning ourselves for a calculated and confident short move.
This is not guesswork—it’s a textbook setup backed by structure, momentum, and sentiment.
🔥 Don’t chase the market. Let it come to you. This setup rewards patience and precision.
---

XAUUSDXAU/USD represents the exchange rate between one troy ounce of gold (XAU) and the US dollar (USD). It shows how much in US dollars is required to purchase one ounce of gold. This pair is widely traded across forex and commodities markets and is considered a key indicator of global economic stability and investor sentiment.
Historically, gold was pegged to the US dollar under the Bretton Woods Agreement from 1944 to 1971. During this period, one ounce of gold was fixed at $35, and the US government guaranteed the convertibility of dollars into gold. In 1971, President Richard Nixon ended the gold standard, allowing gold to trade freely on global markets. This led to significant volatility in the price of gold, which began to reflect real-time market forces such as supply, demand, inflation, and geopolitical events.
In the decades that followed, gold experienced several major price movements. In 1980, gold surged to around $850 per ounce due to high inflation and geopolitical instability. It then declined and remained relatively low through the 1990s, reaching a low near $270 in 2000. Starting in the mid-2000s, gold began a strong upward trend driven by concerns about inflation, financial crises, and central bank policies, culminating in a peak near $1,920 in 2011 during the Eurozone crisis and Federal Reserve monetary easing.
In 2020, gold hit a new all-time high around $2,070 during the global uncertainty of the COVID-19 pandemic. Since then, it has continued to be influenced by economic data, interest rate decisions, inflation trends, and geopolitical developments. In 2024 and 2025, gold has remained strong, supported by central bank buying and expectations of future rate cuts. As of August 2025, the current price of gold has reached $3,363 per ounce, reflecting heightened demand and ongoing macroeconomic uncertainty.
XAU/USD is influenced by many factors, including the strength of the US dollar, inflation expectations, geopolitical risks, and investor demand for safe haven assets. When the dollar weakens or global uncertainty increases, gold typically gains value. Traders and investors often use gold to hedge against economic instability, inflation, or currency devaluation.
Today, gold remains one of the most important assets in global markets, and XAU/USD continues to be a major pair for both short-term traders and long-term investors.

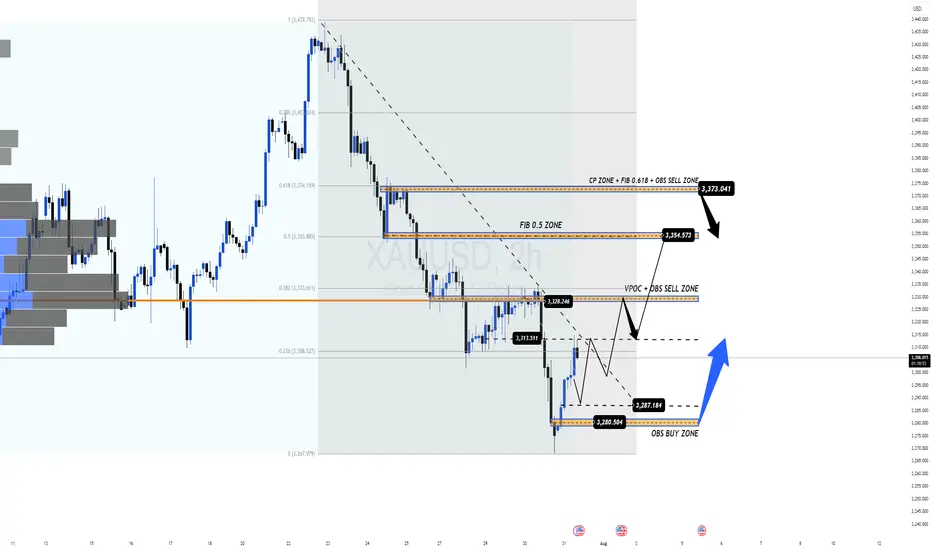
Bounce From Final Liquidity or Start of a Bullish Move? Bounce From Final Liquidity or Start of a Bullish Move?
After the FOMC event, gold completed a sweep of the final liquidity zone at 3269–3271 and rebounded strongly, in line with the broader bullish trend. The price has now recovered sharply and is gradually returning to the liquidity zones left behind after yesterday’s sharp drop.
📍 At the moment, gold is reacting around 3295, which aligns with a CP (Compression Point) Zone on the M30 chart. We're seeing a slight pullback here, and another retracement could occur before a strong upward continuation — potentially breaking out of the descending trendline that’s formed over recent days.
📊 Trading Plan & Key Levels
✅ BUY ZONE – Trend Continuation Setup
Entry: 3286–3284
Stop Loss: 3278
Take Profits:
3290 → 3294 → 3298 → 3304 → 3308 → 3312 → 3316 → 3320 → 3330 → …
💡 This is a prime area to look for re-entries into the dominant bullish move. Price action left a clean liquidity zone below after the aggressive upside reaction — ideal for riding the next wave.
❌ SELL ZONE – Only Valid Below VPOC
Entry: 3328–3330 (Volume Point of Control)
Stop Loss: 3335
Take Profits:
3324 → 3320 → 3315 → 3310 → 3305 → 3300
🔻 This is a high-probability short only if price stays below 3330. If gold closes above this VPOC region, the structure shifts to bullish and we should look for sells higher up — around 335x–337x zones.
📅 Monthly Candle Close – Watch for Indecision
As it’s the last trading day of the month, note that the past two monthly candles have printed doji-like wicks, signalling indecision and liquidity grabs. The market is still waiting for a clearer signal from the Fed on the first potential rate cut of the year.
🚫 Avoid emotional trading. This is a highly reactive environment, so careful risk management is key.
🧭 Final Thoughts
Gold continues to respect market structure and liquidity theory. The first major test lies at the 3313 resistance level — if broken, it opens the door to stronger bullish momentum toward the broader VPOC zone.
⏳ Be patient and only act when price confirms your bias.
XAUUSD
XAUUSD Updated in 5M :
The gold signal is marked on the chart based on the latest price changes and the supply and demand in the market. These points include the entry point, stop loss, and take profit

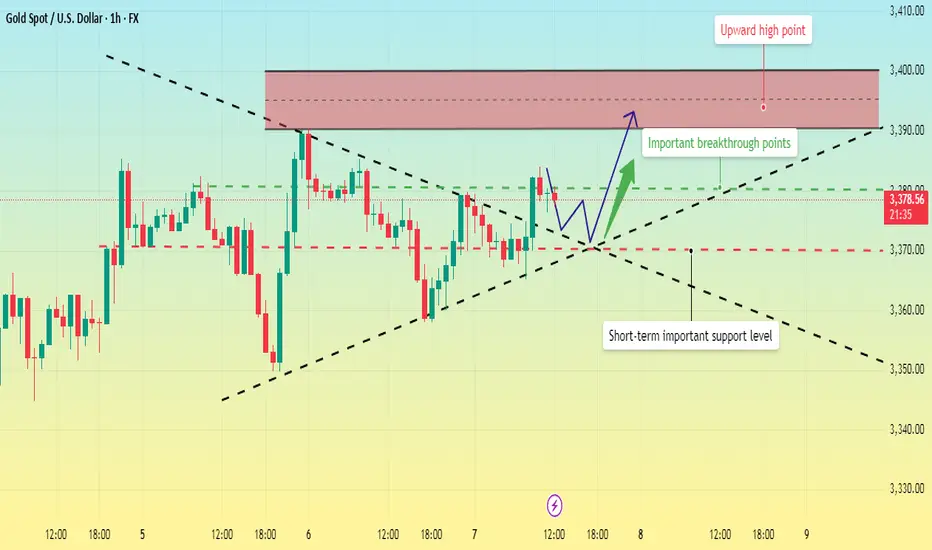
Gold Consolidates at High Levels. Waiting for a New Trend?Gold barely held the 3360 level on Wednesday and will remain in the 3360-3380 consolidation range outlined by Quaid.
Quaid considers Thursday to be a more important day. From a timing perspective, today may impact whether gold can continue its upward trend. However, it is possible that the market could continue its consolidation today. One thing is that the daily line must close above 3360, then the subsequent rise in gold will continue.
On the contrary, if it closes below 3360, then the rise will definitely not be able to continue in the short term. In the short term, gold may remain above 3370 today.
We can see that 3375-3370 is an important support, but the daily line has not yet stabilized above 3380, so the upward space has not yet been opened. If the daily chart can stabilize above 3380, then a test of 3400-3410 is in the cards.
Trading strategy:
Buy between 3365-3370, stop loss at 3355, profit range 3380-3390-3400.
XAUUSD needs retest before swing highM30-H1 TIMEFRAME SETUP
Currently we have range of 3345-3380 area also we have proper CHOCH on H4 at 3335 support area
What possible scenarios we have ?
• If market remains low 3372-3378 then you can scalp a sell trades towards 3360-3350 area which I take sell with minimal risk.
• secondly I wait for drop to my Buying area where I will buy XAUUSD in dips and my optimal target will be 3402-3410.
Additional Tip:
Market is on bullish Bias ,above 3385 no sell Trade .
#XAUUSD
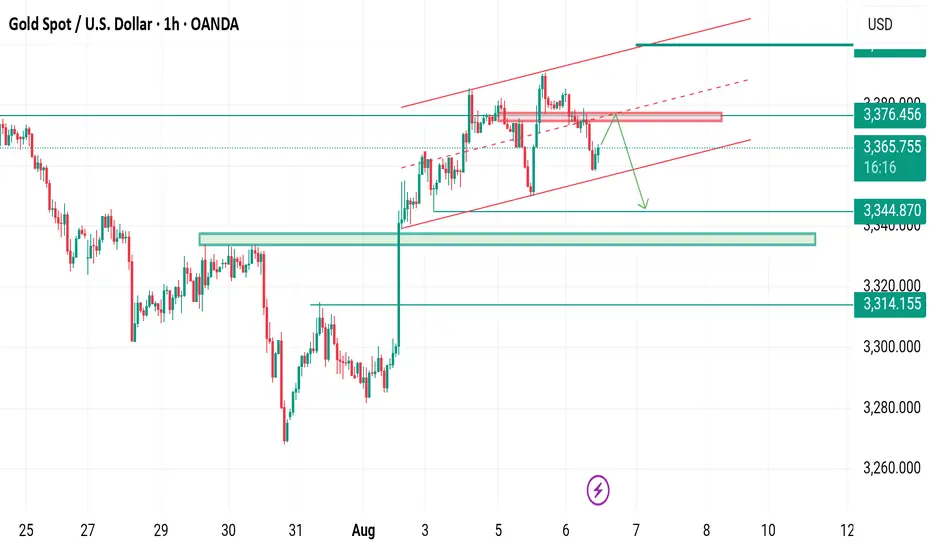
Gold XAUUSD Analysis 06.08.2025Entry: 3373–3378 (on retracement into 1H supply zone)
Stop Loss: 3385 (above recent swing high)
Take Profit: 3352 (targeting previous low / 1H demand)
Bias: BearishRRR: ~2.5:1
Analysis:
Price showed strong rejection from the 3373–3378 supply zone. Expecting a pullback into this area before continuation lower. Bearish structure remains intact with clean lower highs. Plan is to sell the retracement, with SL above 3385. Targeting 3352, which aligns with prior demand and liquidity.
Kindly show support by following liking and commenting your favourite pair for analysis.

Will the bull market continue? A sense of crisis.Can gold continue last week's rally? Will it be another flash in the pan? In early Asian trading on Monday, gold rose to 3370 before falling slightly to around 3345 and currently fluctuating around 3360.
On Monday, focus on the 3340-3335 area. This was support before last Friday's rebound, and it also served as a key resistance level that has now become a support point. After last week's strong performance, don't rush into buying. Wait for a pullback to confirm the trend, or for an upward breakout in the European session before considering entering the market before the US market opens. In volatile markets, try to control the pace and avoid frequent in-and-out moves.
The 4-hour chart shows that gold is currently facing resistance near 3370, but this strong upward move is likely to correct in the European session, preparing for a subsequent secondary rally. This period has been range-bound, not a strong, one-way trend. Even if bullish, don't chase the market; wait for confirmation after a pullback before taking action.
Quaid believes that support today lies in the 3340-3335 range. A pullback near this area is a good opportunity to go long. The early Asian session's surge is a continuation of last Friday's bullish trend. The 3340-3335 area served as support before Friday's final rally and a key level for top-to-bottom reversals. If the price breaks through 3370 and stabilizes above it, it could potentially reach 3375-3385. However, after reaching the high, Quaid believes a pullback is highly likely, with a focus on the 3330-3310 area.
Trading Strategy:
Go long near 3330, stop-loss at 3320, and profit range at 3360-3370.
Short near 3375, stop-loss at 3385, and profit range at 3330-3320-3310.
Gold The Week Ahead Key Support and Resistance Levels
Resistance Level 1: 3386
Resistance Level 2: 3410
Resistance Level 3: 3438
Support Level 1: 3315
Support Level 2: 3295
Support Level 3: 3268
This communication is for informational purposes only and should not be viewed as any form of recommendation as to a particular course of action or as investment advice. It is not intended as an offer or solicitation for the purchase or sale of any financial instrument or as an official confirmation of any transaction. Opinions, estimates and assumptions expressed herein are made as of the date of this communication and are subject to change without notice. This communication has been prepared based upon information, including market prices, data and other information, believed to be reliable; however, Trade Nation does not warrant its completeness or accuracy. All market prices and market data contained in or attached to this communication are indicative and subject to change without notice.

POSSIBLE BEARISH CONTINUATION ON GOLDBased on price action, Gold presents a very bearish sentiment from the daily point of view.
The indicated supply region may be the area of interest for the build up of the sells if indeed Gold is bound for the monthly lows.
Confirmation is needed for an entry.

GOLD - Monthly breakout retest may confirm multi-year bull cycleHello everyone, what are your thoughts on the long-term outlook for XAUUSD?
Looking at the monthly chart (1M), we can clearly see that XAUUSD has broken out of the long-standing ascending channel that has held since 2015 — a major signal suggesting the start of a new bullish cycle. Price is now retesting the previously broken trendline, hinting at the possibility of a fresh upward leg to resume the longer-term bullish trend we've seen recently.
Personally, I'm targeting $3,600 in the medium term, and potentially $4,000 by 2026–2028 if institutional capital continues to rotate back into safe-haven assets like gold.
What about you — do you think BTC/USD will rise or fall in the coming years?
And what’s your target for it?

GOLD What Next? BUY!
My dear friends,
Please, find my technical outlook for GOLD below:
The price is coiling around a solid key level - 3366.7
Bias - Bullish
Technical Indicators: Pivot Points Low anticipates a potential price reversal.
Super trend shows a clear buy, giving a perfect indicators' convergence.
Goal - 3375.9
Safe Stop Loss - 3361.7
About Used Indicators:
The pivot point itself is simply the average of the high, low and closing prices from the previous trading day.
Disclosure: I am part of Trade Nation's Influencer program and receive a monthly fee for using their TradingView charts in my analysis.
———————————
WISH YOU ALL LUCK