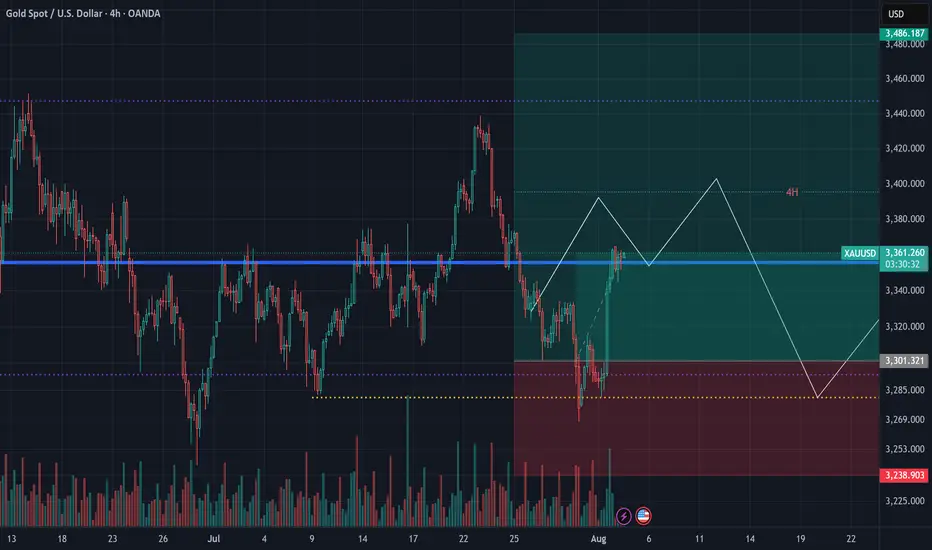
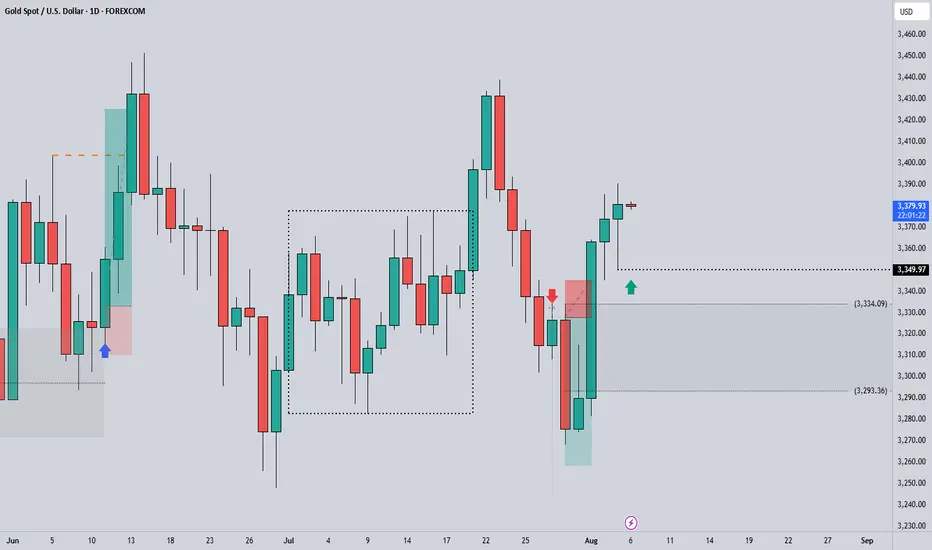
XAUUSD Technical Outlook – August 4, 2025Last week, prior to Powell’s speech, we expected a move down to the $3280 area.
While we anticipated a brief pullback to lighten liquidity around $3400 first,
price instead dropped straight down without a bounce.
✅ The reaction at our level was spot-on,
culminating in a weekly close above $3360 — very bullish.
With liquidity around $3370 already cleared,
we don’t expect strong resistance ahead.
📈 The preferred strategy for this week: Buy gold.
🎯 A solid entry zone lies between $3320–$3330.
⚠️ For those insisting on counter-trend trades,
we strongly advise keeping targets small.
GOLD trade ideas
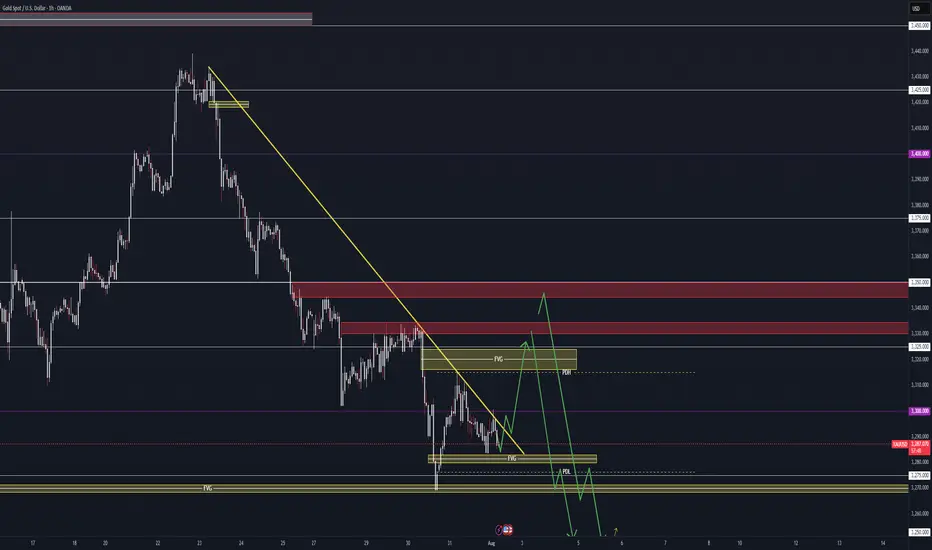
NFP Friday - XAUUSD Prediction - August 2025#NFP Friday + New Month 👇
- Still leaning bearish on TVC:GOLD
- New month = re-positioning flows
- Watching 3225–3250 zone (Fib 38/50 confluence)
- Clean pullback setup near Psy level & untested orders
News Prediction:
- Labor market still holding up, I’m thinking NFP prints closer to 130k–150k, not that 110k estimate
- Yes, tech & retail saw some layoffs, but not enough to tank the whole report
- Adapt if wrong, execute if right. No stress
#XAUUSD #Gold #NFP #Dollar #NFPFriday #XAUUSD #Gold #NFP #JobsReport #Dollar #Macro #Trading #MarketOutlook #NFPFriday
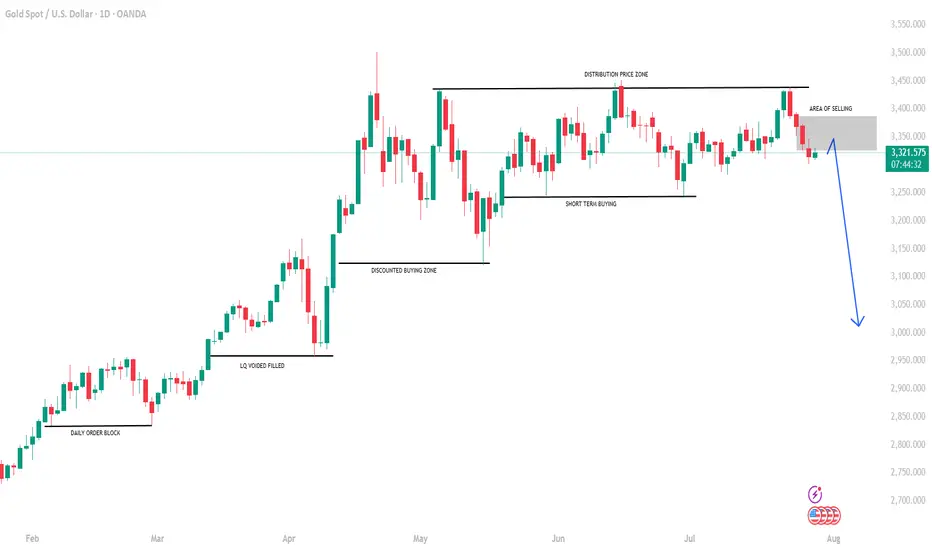
GOLD: Time for massive drop? +3000 pips move! Gold has failed to breakthrough the previous resistance indicating a strong sellers hold around $3440 region. Now since the price has stared dropping we can see it dropping around $2800 in long term. In order for this to happen we need strong confirmation, which will help us understand the possible volume.
Agree with our idea?
Like and comment!
XAUSD : M30 Long BiasThis trading plan adopts a bullish bias, anticipating an upward move initiated with an entry into the Fair Value Gap (FVG) zone highlighted on the chart.
Key Components of the Plan:
Entry Zone:
The primary entry for a long position is upon price entering the FVG area (Fair Value Gap). This gap represents a price imbalance, often caused by institutional buying or selling, where the market tends to revisit to fill the gap before continuing its trend. Buying at this zone provides a good risk-reward profile.
Price Context :
Current price is approaching the FVG after a prior strong bullish move, indicating the possibility of a pullback to accumulate before price continuation.
Target Area:
Expect the price to move upward from the FVG zone towards higher levels, potentially reaching recent swing highs or resistance zones mapped by Smart Money Concepts such as order blocks or liquidity targets.
Stop Loss Placement:
A prudent stop loss can be placed just below the lower boundary of the FVG zone or below the strong recent low, to protect against extended downside moves invalidating the trade setup.
Trade Rationale:
The plan leverages smart money concepts where institutional buying in the FVG zone creates a strong demand area for positioning long. This is backed by the technical structure seen in the chart and typical market behavior of filling such gaps.

Check the trend If the price consolidates above the green resistance zone, the uptrend is likely to continue. Otherwise, a correction to the support zone is possible.
XAUUSD 15m XAUUSD Possible Pullback Buy SetupThis is what I'm looking at currently for gold. The breakout from the range and reclaim of previous resistance as support indicates buyers are in control, but market is approaching heavy resistance above, so I'm looking for “buy dips” rather than chasing late longs.

XAUUSD Long ProjectHi guys...😎
It's time to do a Long Project on XAUUSD with 3 key reasons:
1. Price Drivers: institutional longing
2. Trend: up
3. Momentum: bullish
Action: waiting for entry on the intraday timeframe (entry will be published further)
XAU usd , a possible route mapplease go thru the path, watch and do act according to ur view as well.. good luck..
please note: this information has to take as an educational purpose. entering to this trade must be at ur risk..
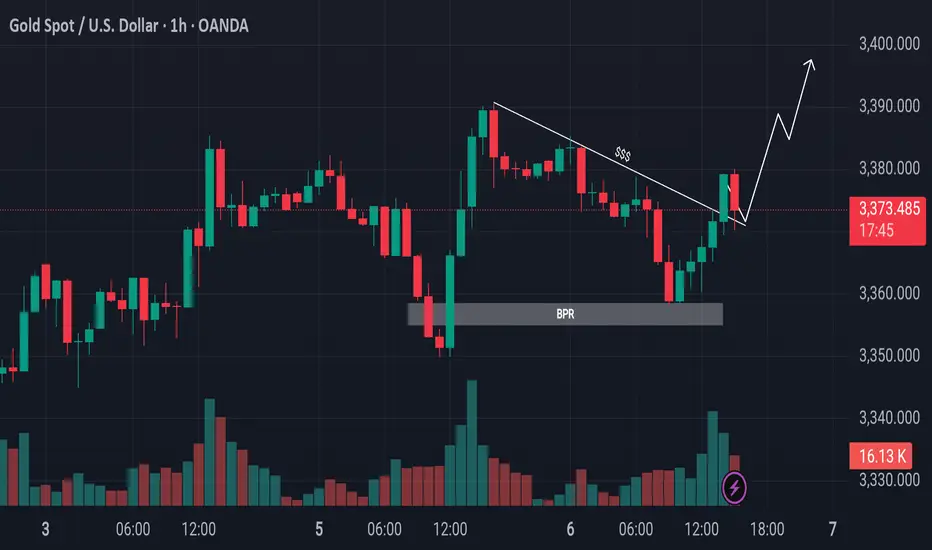
Gold Retraces to OTE and Breaks ResistanceEyes on Swing Highs!Gold Market Update
The gold market declined from its previous bullish leg and retraced below the 50% level, reaching into the Optimal Trade Entry (OTE) zone. It also tapped into a Bullish Price Rejection (BPR) area. Following that, price broke above the trendline resistance. Currently, it is advisable to wait for a potential retest of the breakout level. If confirmed, the market could continue its upward movement toward the previous swing highs.
Do Your Own Research (DYOR)
Long position Price respected FVG on 15 time frame with a hope that it’s gonna take out liquidity on buy side

RIDE THE TREND OPPORTUNITYPrice seems to have a correction movement before continue flying to next supply area.


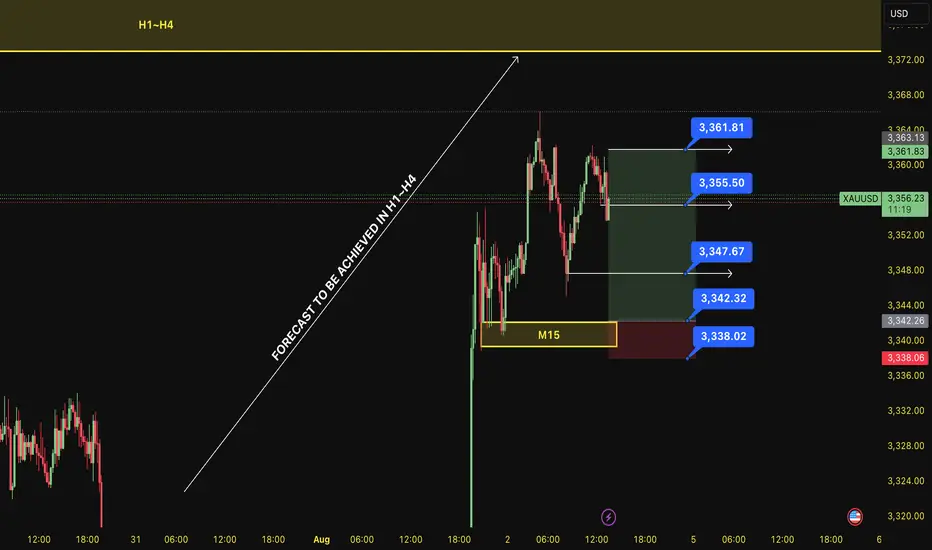
BUY XAU 4.8.2025Confluence order: BUY at M15
Type of order: Limit order
Reason:
- The current top is not touching anything, expected to rise to the H4~H1 above.
Note:
- Management of money carefully at the last bottom (3,347)
Set up entry:
- Entry buy at 3,342
- SL at 3,338
- TP1: 3,347 (~1R)
- TP2: 3,355 (~3R)
- TP3: 3,361 (~4,5R)
Trading Method: Price action (No indicator, only trend and candles)
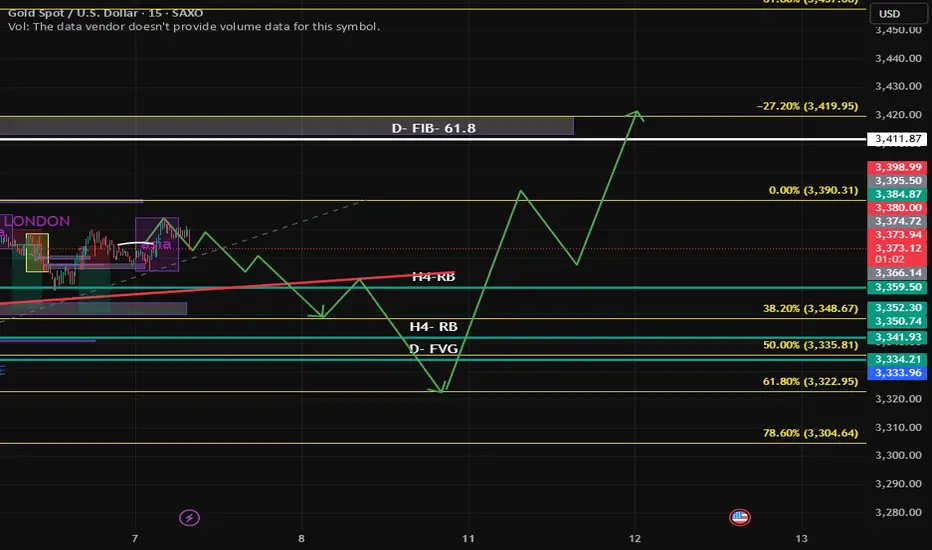
XAUUSD Gold Swing Trading Plan – 1st Week of August 2025 (H4 TF)Strategy Type: Swing Trade (Multi-Day Positioning)
Timeframe: H4 (4-hour)
Market Bias: Bullish Continuation
Risk Profile: Medium-to-Low Frequency, High Conviction
Trade Style: Buy-the-Dip, Scale-out Strategy
🧠 Macro & Technical Outlook
Gold is currently maintaining a bullish higher-high, higher-low structure on the H4 chart, reflecting continued strength from macro drivers including inflation hedging, softening USD, and a shift toward safe-haven assets amid geopolitical and economic uncertainty.
The market has recently completed a local impulse wave and is entering a healthy retracement phase. This sets up a textbook swing opportunity, where pullbacks to key Fibonacci levels can be capitalised for the next bullish leg up.
🔍 H4 Trading Plan Summary
✅ Phase 1: Buy on Pullback to 3360
Entry Zone: 3360 (H4 support and key retracement level)
Reasoning:
Confluence of dynamic support and 50–61.8% Fibonacci retracement zone of the previous H4 swing
Former resistance turned support (RBS zone)
Volume tapering and RSI cooling off — signalling a healthy setup for bullish continuation
Entry Trigger:
Bullish engulfing or pin bar candle on H4
Optional confirmation: RSI > 40 after bounce, MACD crossover
Stop Loss: Below 3340 (beneath structural support)
🎯 Target 1: 3383
Why:
Local resistance zone from previous H4 rejection wick
Close to psychological level and good zone for first partial profit
Action:
Secure 25% profits
Move SL to breakeven or +10 pips for risk-free continuation
Wait for next retracement
✅ Phase 2: Wait for Pullback After 3383
Retracement Zone: Estimated dip to 3370–3375 (higher low area)
Entry Trigger:
Confirmation of strong bounce at this level with tight consolidation and breakout on smaller timeframes (M30/H1)
🎯 Target 2: 3430
Why:
Strong historical resistance from early July
Mid-level of long-term range (3330–3480)
Often serves as decision point between accumulation or breakout
Action:
Secure additional 40–50% profits
Trail SL below the most recent higher low (~3390)
✅ Phase 3: Final Position Hold Toward 3475
Retracement Zone: Likely dip to 3410–3420 after 3430 is reached
Final Entry (Optional): Only if momentum is strong and structure holds
Target 3: 3475
Why:
Multi-month resistance and projected upside target from recent breakout
Round number magnet + liquidity zone for larger institutional exits
Action:
Close remaining 25–30% of the position
Reassess for breakout or reversal at 3475
⚠️ Risk Management Plan
Max exposure: 1.5–2% of account
Stop losses fixed — no averaging down
Use position sizing to handle swing duration volatility
Scale-in only with structure confirmation
🔁 Summary Table
Phase Buy Level Target SL Action
Phase 1 3360 3383 3340 Partial TP, BE SL
Phase 2 3370–3375 3430 3355–3365 Add size, secure more
Phase 3 3410–3420 3475 3390 Final TP, full exit
📊 Indicators to Watch (H4)
RSI: Look for 40–60 zone bounce and push toward 70
MACD: Cross above signal line confirms momentum
Volume: Increased buy-side volume at 3360–3375 confirms entry strength
🧭 Fundamental Considerations
Watch DXY: Weakness in Dollar continues to support Gold’s uptrend
FOMC or Jobs Data Ahead?: Any surprise comments from Fed could introduce volatility
Global Headlines: Risk-off flows (e.g., China/US tensions, war news) are bullish for Gold

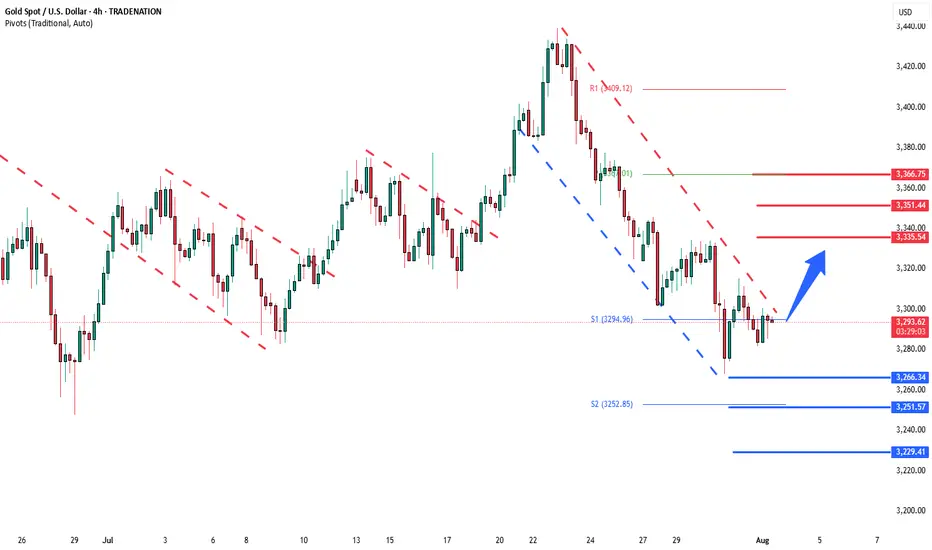
Gold deeper consolidation supported at 3266The Gold remains in a bullish trend, with recent price action showing signs of a continuation breakout within the broader uptrend.
Support Zone: 3266 – a key level from previous consolidation. Price is currently testing or approaching this level.
A bullish rebound from 3266 would confirm ongoing upside momentum, with potential targets at:
3335 – initial resistance
3351 – psychological and structural level
3366 – extended resistance on the longer-term chart
Bearish Scenario:
A confirmed break and daily close below 3308 would weaken the bullish outlook and suggest deeper downside risk toward:
3250 – minor support
3230 – stronger support and potential demand zone
Outlook:
Bullish bias remains intact while the Gold holds above 3266. A sustained break below this level could shift momentum to the downside in the short term.
This communication is for informational purposes only and should not be viewed as any form of recommendation as to a particular course of action or as investment advice. It is not intended as an offer or solicitation for the purchase or sale of any financial instrument or as an official confirmation of any transaction. Opinions, estimates and assumptions expressed herein are made as of the date of this communication and are subject to change without notice. This communication has been prepared based upon information, including market prices, data and other information, believed to be reliable; however, Trade Nation does not warrant its completeness or accuracy. All market prices and market data contained in or attached to this communication are indicative and subject to change without notice.
Hidden secrets amidst gold volatility
💡Message Strategy
The current gold price is primarily supported by the following fundamental factors:
First, US President Trump signed an executive order imposing an additional 25% tariff on Indian imports, bringing the cumulative tariff rate to 50%. Meanwhile, the market expects Japanese goods to face an additional 15% tariff. This series of policies has fueled concerns about global economic uncertainty, significantly increasing market demand for safe-haven assets and benefiting gold.
Second, recent weak US economic data, including last Friday's weaker-than-expected non-farm payroll data and Tuesday's subdued ISM services PMI, have reinforced expectations of a Federal Reserve rate cut this year.
Furthermore, the US dollar has remained under pressure, weakening against major currencies to a more than one-week low. Since gold is priced in US dollars, a weaker dollar has increased purchasing power in non-US markets, indirectly pushing up gold prices.
Despite the overall optimistic tone in the equity market, the upward trend in risky assets has not dampened gold's momentum, indicating that market sentiment has not yet returned to a risk-on, and gold continues to serve as a core safe-haven asset.
📊Technical aspects
Looking at the two-hour chart, gold prices have been trading in a volatile consolidation pattern since rebounding from a low of $2,955. They are currently trading above the middle Bollinger Band ($3,340) and approaching the upper Bollinger Band ($3,430).
The Bollinger Bands are showing signs of convergence, indicating a temporary contraction in volatility, which could be a precursor to a potential breakout. A subsequent breakout above the upper Bollinger Band on larger volume would signal a "Bollinger Band squeeze + breakout" pattern, potentially testing the previous high of $3,430.
If gold breaks through the 3440 line with strength, then gold will continue to challenge the 3500 integer mark.
💰Strategy Package
Long Position:3365-3375,SL:3350,Target: 3400-3430

XAUUSD GOLD H1 ANALYSIS BUY NOW 3365 XAUUSD (Gold) Trade Update:
Gold is currently a buy at 3365, with an upside target of 3420. The support area is at 3348, while the resistance is seen around 3380. Traders who have been following my analysis are advised to hold their positions strongly and stay confident in the setup. This move aligns with the ongoing bullish momentum, so stay focused and manage your trades accordingly.

06/08/25 Gold Swing LevelsWednesday 06/08/25 levels are marked; still expecting a downtrend.
Always, price action determines trade.
Trade parameters
Entry on 5 min chart
Sl: 30-50pips
TP: 2-4x SL

XAUUSD - TAKE A LOOKHere are some guidelines of what could happen. This is purely technical analysis, which may be affected by any news, but it is currently aligning with the ongoing movement.

BUY XAUUSD ....GOLDBUY XAUUSD price gas reached a potential strong bullish orderblock and a well structured demand zone
use proper risk management

Gold is fluctuating at a high level. Latest analysis.On Monday, gold surged to around 3370 in the morning before retreating slightly. It fell back to support near $3345 in the European session. The dividing line between bulls and bears lies below 3340, which also marks the support level and the top-bottom reversal before the close of last Friday's non-farm payroll report.
Quaid planned to go long near 3340 on Monday, but the price rebounded to 3345, halting its decline and then fluctuating sideways, preventing an entry opportunity. However, a short opportunity near 3385 was successfully implemented with a slight pullback. Although it did not reach the expected target, a small profit was achieved after the pullback to 3370.
Monday showed an overall upward trend, with the closing price fluctuating at a high level, reaching a high around 3385 before retracing to confirm 3370. The overall market trend remains upward, with a temporary potential for a move to around $3400. Quaid recommends a buy-on-low strategy today. Currently, the 1-hour moving average is trending flat, and the trend of prices continuing to fluctuate at high levels cannot be ruled out.
Support for Tuesday's pullback lies near 3370. The key to a renewed rally lies at 3360, also the level of resistance before Monday's US market opening. As long as this level remains intact, the overall strategy remains unchanged. Alternatively, watch for a re-break of 3385, with upside targets at 3385-3390-3400.
Strategy:
Long at 3360-3365, stop-loss at 3355, profit range at 3380-3400;
Short at 3395-3400, stop-loss at 3410, profit range at 3370-3350;
Key Points:
First Support Level: 3370, Second Support Level: 3360, Third Support Level: 3350
First Resistance Level: 3385, Second Resistance Level: 3395, Third Resistance Level: 3405.

XAUUSD (Gold) Intraday/Swing Trading Plan – Tuesday, 5th August Timeframe: M30 (30-Minute)
Strategy Type: Structured Buy-the-Dip with Staggered Take Profits
Market Bias: Bullish
Risk Profile: Moderate Risk, Medium Holding Duration
Trade Style: Intraday Momentum + Short Swing
🧠 Market Structure & Context
Gold continues to show a strong upward momentum in early August, with the M30 chart printing higher highs and higher lows consistently. Monday’s session closed with bullish strength above key psychological zones, suggesting the uptrend remains intact. Price is currently retracing after an impulsive move, providing a prime opportunity for a clean entry.
The M30 structure also shows a tight bullish channel, and pullbacks into confluence zones have proven to be reliable buy areas. The plan will focus on timing re-entries after each impulse leg to ride multiple profit waves toward higher targets.
🔍 M30 Trading Plan Breakdown
✅ Phase 1: Buy on Retracement to 3379 (Primary Entry Zone)
Entry Zone: 3379
Why:
Key support zone from previous structure breakout
Near 50% Fibonacci retracement of prior impulse
Price-action pivot zone where buyers stepped in Monday
Confirmation to Enter:
Bullish engulfing or hammer on M30
RSI bounce above 40–45
Price closes back above dynamic support (50 EMA)
Stop Loss:
Below 3369 (10 pips buffer beneath structure)
🎯 Target 1: 3395
Reasoning:
Short-term resistance from Monday NY session wick high
Completion of first impulse move (~1.5R target)
Action:
Take 30–40% profit
Move SL to breakeven or trail slightly below new support at 3385
Wait for pullback to enter Phase 2
✅ Phase 2: Re-Entry After Pullback (Post-3395)
Retracement Zone: 3388–3390 (bullish flag / higher low expected)
Re-Entry Trigger:
Tight consolidation followed by bullish breakout on M30
RSI remains above midline; MACD crossover confirmation optional
🎯 Target 2: 3418
Why:
Next resistance zone based on price rejection in late July
Also aligns with intraday Fibonacci extension (1.272 of the first wave)
Strong psychological + structural zone
Action:
Take 30–40% more profit
Adjust trailing SL to 3398 or dynamic support based on EMA
Monitor for pullback to hold or fade
✅ Phase 3: Final Position Hold or Re-Add on Pullback
Retracement Zone: 3405–3408 (previous resistance turned support)
Entry/Scaling Condition:
Price respects the new support zone and prints continuation candle
M30 volume and momentum remain positive
🎯 Target 3: 3443
Why:
Key psychological level near 3440–3450 resistance
Top of projected trend channel and potential supply zone
Excellent exit zone before possible reversal or profit-taking by institutions
Action:
Close remaining 20–30% of position
Optional: Watch for breakout >3443 for longer swing continuation if fundamentals align
⚠️ Risk Management Notes
Max risk per full plan: 1.5–2% of account
SLs strictly enforced at each entry
No entry during high-impact news spikes (check economic calendar)
Never chase — only execute on confirmed candle setups and risk-reward compliance
🔁 Summary Table
Phase Buy Level Target SL Action
Phase 1 3379 3395 3369 Take 30–40%, trail SL
Phase 2 3388–3390 3418 3379 Take 30–40%, trail SL
Phase 3 3405–3408 3443 3395 Take final 20–30%, full exit
📊 Indicators Used
50 EMA / 200 EMA: Confirm trend and support
RSI (14): Trend strength and bounce signal
MACD: Confirmation of momentum continuation
Volume: Increased buy-side volume confirms valid breakout after retracement
🕒 Session Timing Considerations
Asian Session: Wait for price to dip to 3379 — ideal entry zone
London Open (3pm SG time): Look for breakout toward 3395
New York Open (8:30pm SG time): Strong move possible to 3418 or 3443 depending on momentum and news catalysts

XAUUSD Technical Analysis – Bullish Continuation SetupXAUUSD Technical Analysis – Bullish Continuation Setup
📊 Market Structure Overview:
The chart shows a clear bullish structure shift, marked by multiple Break of Structure (BOS) events that validate strength from buyers. After forming equal lows and a liquidity sweep at the strong support zone, price has aggressively moved higher, breaking through minor resistance levels and showing clear bullish intent.
🧱 Key Technical Elements:
🔹 1. Strong Support Zone (Demand Rejection)
Price respected the strong demand zone between $3,260 – $3,280, where aggressive buying was seen after forming a bullish engulfing breakout. This zone aligns with previous demand and a major BOS, confirming institutional buying interest.
🔹 2. Bullish Order Flow & Break of Structure (BOS)
Multiple BOS levels across July and early August highlight a sequence of higher highs and higher lows, indicating trend continuation.
The most recent BOS after July 30 shows an impulsive break, confirming bullish dominance and clean order flow.
🔹 3. Fair Value Gaps (FVGs)
Bullish FVG (Mid-July): Price respected and bounced from this zone, showing previous imbalance was filled and used as a base for continuation.
New FVG (Above $3,420): The current upside target lies within this area, acting as a magnet for price due to unfilled orders.
🔹 4. Buy-Side Liquidity & Target Zone
The market is approaching a buy-side liquidity zone around $3,385, a key short-term target where previous highs and stop orders are likely pooled.
If liquidity above $3,385 is taken efficiently, price may expand into the FVG zone between $3,420 – $3,460.
🔹 5. Bullish Confirmation & Momentum
The candle structure shows a clean bullish impulsive move, followed by minor consolidation—likely a bullish flag/pennant indicating potential for further continuation.
Momentum is favoring buyers, and short-term consolidation above $3,340 is healthy for continuation.
🔐 Liquidity & Institutional Narrative
Equal Lows (EQL) and FVG fills suggest prior liquidity was swept and used to fuel institutional long positions.
The recent BOS confirmed that smart money has shifted bias toward longs, and price is now targeting remaining inefficiencies to the upside.
The clear alignment of BOS, liquidity sweep, and bullish FVGs reinforces a strong institutional footprint on this move.
🔍 Key Levels to Watch:
Level Type Price Zone (USD)
🔺 Resistance / FVG 3,420 – 3,460
🎯 Immediate Target 3,385
📉 Short-Term Support 3,340 – 3,320
🛡️ Major Demand Zone 3,260 – 3,280
📌 Conclusion & Outlook:
XAUUSD has initiated a strong bullish leg from the demand zone, confirming accumulation and structural reversal. Price is now moving toward the buy-side liquidity target of $3,385, with potential continuation toward the FVG resistance zone of $3,420–$3,460.
As long as price remains above the $3,320 structure support, the bullish bias remains intact. Any pullbacks should be seen as buying opportunities, especially on lower timeframe confirmations.
