The Impact of Corporations on Global Trade1. Corporations as Engines of Trade Expansion
Corporations, especially MNCs, are central to the expansion of global trade. These organizations operate in multiple countries, producing and selling goods and services on a scale that often surpasses the capacity of national economies. By establishing subsidiaries and joint ventures in foreign markets, corporations increase trade flows both in imports and exports. For instance, a technology company headquartered in the United States may source components from Japan, manufacture products in China, and sell them across Europe, effectively linking multiple economies through a single corporate network. This activity not only boosts trade volumes but also diversifies market opportunities for smaller businesses that supply inputs to these corporations.
2. Supply Chain Integration and Global Value Chains
A critical way in which corporations impact global trade is through the development of global supply chains and value chains. Modern production processes are fragmented across nations, allowing corporations to optimize costs, access specialized skills, and leverage comparative advantages. For example, automotive companies often design vehicles in Europe, manufacture engines in Germany, assemble components in Mexico, and distribute finished products worldwide. These intricate supply chains have led to the emergence of Global Value Chains (GVCs), where value is added in different stages across multiple countries. This fragmentation increases cross-border trade in intermediate goods and services, significantly expanding global trade volumes.
3. Technology Transfer and Knowledge Dissemination
Corporations are key conduits of technology and knowledge transfer across borders. When a corporation invests in a foreign country, it often brings advanced production techniques, management practices, and innovation capabilities. This transfer of technology boosts the productivity and competitiveness of the host country, indirectly influencing trade by enhancing export potential. For example, foreign direct investment (FDI) by high-tech corporations in developing economies can enable local firms to adopt modern technologies, facilitating the production of export-quality goods and services. Consequently, corporations not only trade goods but also foster skill development and technological upgrading globally.
4. Market Creation and Consumer Demand Expansion
Corporations also shape global trade by creating new markets and stimulating consumer demand. Through strategic marketing, product localization, and brand recognition, corporations expand the reach of their products to international markets. This expansion often encourages other domestic and international suppliers to enter these markets, increasing trade activity. For instance, the entry of multinational consumer goods companies into emerging economies often introduces a range of new products and stimulates imports of raw materials, packaging, and equipment. This effect extends beyond mere consumption—it establishes long-term trade relationships between suppliers and corporate buyers worldwide.
5. Influence on Trade Policy and International Regulations
Large corporations often influence global trade policies and regulations. Through lobbying, strategic partnerships, and participation in international organizations, corporations can affect trade agreements, tariffs, and standards. For example, tech giants may lobby for reduced tariffs on electronic goods or for harmonized digital standards, thereby facilitating smoother cross-border trade. Their influence can also shape regulatory frameworks regarding intellectual property, environmental standards, and labor practices, which in turn affect how trade flows are structured globally. While this can accelerate trade liberalization, it may also create challenges for smaller firms that cannot navigate complex regulatory environments.
6. Economic Impact and Market Competition
Corporations’ impact on global trade extends to economic growth and market competition. By expanding into new markets, corporations generate employment, contribute to tax revenues, and foster industrial development. Increased competition from multinational entrants can encourage local firms to innovate and improve efficiency, raising the overall competitiveness of industries in different countries. However, this dominance can also concentrate market power, leading to monopolistic practices that may distort trade and limit benefits for smaller players. The balance between stimulating trade and maintaining fair competition is a critical aspect of corporate influence on the global economy.
7. Challenges and Criticisms
Despite their positive contributions, corporations’ role in global trade is not without criticism. Critics argue that MNCs can exacerbate economic inequality by extracting resources from developing nations without sufficient local reinvestment. They may exploit labor and environmental regulations to minimize costs, leading to social and ecological consequences. Additionally, the dominance of a few large corporations in key sectors, such as technology or pharmaceuticals, can limit market access for smaller firms and distort trade dynamics. Trade imbalances may also arise if corporations disproportionately favor production in low-cost countries while concentrating profits in high-income regions. Addressing these challenges requires international cooperation, responsible corporate governance, and equitable trade policies.
8. Future Trends and Evolving Corporate Roles
The role of corporations in global trade is evolving in response to technological innovation, geopolitical shifts, and sustainability concerns. The rise of digital platforms and e-commerce enables even small and medium-sized enterprises (SMEs) to engage in cross-border trade, challenging the traditional dominance of large corporations. Sustainability initiatives are pushing corporations to consider environmental and social factors in supply chains, potentially reshaping trade patterns toward greener practices. Moreover, geopolitical tensions, trade wars, and regional trade agreements are influencing corporate decisions on production locations and supply chain management, reflecting a more complex and strategic approach to global trade.
Conclusion
Corporations, particularly multinational ones, are fundamental drivers of global trade. They expand markets, integrate supply chains, transfer technology, and shape consumer demand, all of which amplify international trade flows. At the same time, they wield significant influence over trade policies and economic structures, generating both opportunities and challenges for global markets. While their operations contribute to economic growth and innovation, they also raise concerns regarding inequality, environmental impact, and market concentration. Understanding the multifaceted impact of corporations on global trade is essential for policymakers, businesses, and international organizations seeking to foster equitable, sustainable, and efficient trade systems. As global commerce continues to evolve, the role of corporations will remain central, shaping not only the movement of goods and services but also the broader economic landscape of the 21st century.
Trade ideas

Gold further downside next weekGold price had closed below 5 day moving average for the past 3 days, this would be a sign for further downside. This is also the third time the gold price is unable to break above 4250 area.
There should be further attempts to try to break above, in the mean time, momentary retracement should be on the cards next week.
This retracement might be to gather further strength to break to the upside later.
Trading strategy -> continue to buy on dip, control small lot size.

GOLD ANALYSIS What’s Moving the Market Today?(December 05, 2025)OANDA:XAUUSD GOLD ANALYSIS What’s Moving the Market Today?(December 05, 2025)
Welcome back to Trade with DECRYPTERS, where we decode smart-money footprints into clean, actionable buy & sell zones.
Keep it simple. Trust the levels. Follow the plan.
📰 Market Overview
Gold continues its upward rotation after reacting perfectly from Smart Money Buy Orders earlier this week. Price is now pushing toward major liquidity pockets and approaching premium sell zones, keeping bulls firmly in command despite mild USD stabilization.
The U.S. Dollar Index remains soft following post-election volatility, hovering near structural lows. Combined with elevated geopolitical tensions and aggressive central-bank accumulation, gold continues to operate inside a macro-bullish environment.
With key U.S. data releases (ADP, ISM Services, PCE) and the December 9–10 FOMC meeting ahead, markets remain cautious but structurally bullish. Gold is respecting the premium discount rotation cleanly, offering multiple low-risk, high-probability setups for disciplined traders.
🔍 Key Fundamentals Driving Today’s Move
📈 88% probability of a December rate cut → lower yield competition boosts gold
💵 USD stabilizing but not strengthening → downside limited
🌍 Geopolitical tensions elevated → strong safe-haven premium
🏦 Central banks remain net buyers (634t YTD) → consistent long-term accumulation
📊 Core PCE at 2.9% → keeps Fed leaning dovish
Gold’s strength remains driven by a powerful combination of macro uncertainty + structural demand + smart-money order flow.
📰 Insights from Key Sources
Spot gold rose 1% to $4,199.19/oz on Nov 28, signaling renewed buying interest and aggressive dip-accumulation.
Bank of America projects gold could reach $5,000/oz by 2026, backed by tight supply, low inventories, and persistent monetary support.
Deutsche Bank raised its 2026 average gold forecast to $4,450/oz (up from $4,000), citing ETF inflows and sustained central-bank demand.
Australian miners are ramping up exploration to capitalize on the rally.
South Africa has opened its first underground gold mine in 15 years (Qala Shallows), aiming to stockpile ore amid record prices.
Structural supply constraints remain a bullish driver, supporting higher long-term price projections.
These insights reinforce the institutional bias: long-term accumulation remains strong, and the upside narrative is supported by both fundamentals and supply-demand dynamics.
📆 KEY EVENTS TO WATCH
🔸 Core PCE Data — Recently Released
A major Federal Reserve–driven volatility catalyst.
Latest Core PCE: 2.9% YoY
Latest Monthly Change: 0.2% MoM
If Core PCE comes in softer than expectations:
✔️ Strengthens the December rate-cut narrative
✔️ Supports a continuation toward premium sell zones (4245 → 4264 → 4284)
✔️ Confirms easing inflation pressure and boosts non-yielding assets like gold
If Core PCE comes in hotter than forecast:
✔️ Sparks temporary USD strength
✔️ Expect a liquidity sweep into discount zones (4203 → 4189 → 4167)
✔️ Real direction usually follows after the stop-hunt, not the initial candle
🔸 Geopolitical Landscape
Geopolitical tensions continue to amplify intraday volatility:
🌍 Escalation → safe-haven spike into premium zones
🌤️ Calm → controlled pullbacks into buy zones
Trend remains bullish, but momentum varies depending on global risk sentiment.
Geopolitics generally strengthens the prevailing smart-money trend rather than reversing it.
🟩 GOLD TECHNICAL LEVELS
Gold continues to respect its rising structure, reacting cleanly from discount zones and rotating toward institutional premium blocks. Price currently sits just below major sell-side liquidity.
🟩 📌 SMART MONEY BUY ORDERS: 4147 – 4167
Primary institutional demand zone with ~$22 million in resting buy-side liquidity.
Expect:
✔️ Strong reaction on first tap
✔️ Accumulation & mitigation
✔️ Higher-low formations inside bullish channel
Break below 4147 opens liquidity toward 4108 → 4075.
🟩 📌 SCALP BUY AREA: 4203 – 4189
Short-term discount zone for:
✔️ Intraday long scalps
✔️ Retracement continuation setups
✔️ Mid-range liquidity grabs
A break of 4189 brings price back into the deeper Smart Money Buy Zone.
🟧 📌 SCALP SELL AREA: 4245 – 4254
Short-term distribution zone ideal for:
✔️ Quick reaction shorts
✔️ Intraday pullbacks
✔️ Stop runs before testing the major premium zone
Rejection sends price back toward 4200–4210 liquidity.
🔺 📌 SMART MONEY SELL AREA: 4264 – 4284
High-probability institutional distribution zone with $33 million in sell-side orders.
Expect:
✔️ Manipulation wicks into premium
✔️ Liquidity grabs above local highs
✔️ Swing reversal setups near range extreme
A decisive break & hold above 4284 opens continuation toward 4310 → 4325.
📌 Conclusion
gold remains firmly bullish as long as the 4147–4167 Smart Money Buy Zone is protected, with price continuing its clean rotation between institutional discount and premium levels. With unemployment data set to inject volatility, expect engineered liquidity sweeps before the true direction unfolds. The broader narrative of dovish policy, geopolitical risk, and heavy central-bank accumulation keeps the upside intact. Stay patient, trust the zones, and let smart-money footprints guide every decision.
🙌 Support the Analysis
If this breakdown brought value to your trading:
👍 Drop a like
💬 Comment your levels
📈 Share your charts with the community
Let’s grow together.
Best Regards,
M. MOIZ KHATTAK | Founder — TRADE WITH DECRYPTERS

XAUUSDGold has been in a sustained long-term uptrend since 2019–2020.
Throughout 2025, the bullish structure has remained intact despite strong pullbacks.
Price created a new all-time high around 4,400 before correcting.
This correction formed a consolidation zone near 3,960, followed by a bullish push that created a higher low at 4,250, in relation to the 4,400 high.
The subsequent drop failed to break below the previous consolidation low (3,960), confirming that buyers are still defending the long-term structure. From there, price started moving upward again toward the 4,000 region.
Recently, price has been consolidating on the H4 timeframe between 4,250 (resistance) and 4,175 (support).
A clean breakout above 4,250 would open the way toward the previous high at 4,400.
A break above 4,400 would confirm a continuation of the long-term bullish trend, aligning with the macro expectation since 2020 that gold will eventually reach the 4,000+ extended targets.
Gold remains structurally bullish, but the next decisive move depends on the breakout of the 4,250 zone.

Gold - Warning #2 IssuedBut isn't Gold going to go up forever? Not necessarily...
Our systems at Bullfinder-official have identified potential high risk in OANDA:XAUUSD , issuing Warning #2.
This is the second time sirens have been sounded over the recent months on Gold.
Although this may not be the exact top of Gold's run, we would like to note that current regions may warrant greater caution, and present greater levels of risk.
What's to come over the months to follow? Time will tell.
We're inspired to bring you the latest developments across worldwide markets, helping you look in the right place, at the right time.
Thank you for reading. Stay tuned for further updates, and we look forward to being of service along your trading & investing journey...
Disclaimer: Please note all information contained within this post and all other Bullfinder-official Tradingview content is strictly for informational purposes only and is not intended to be investment advice. Please DYOR & Consult your licensed financial advisors before acting on any information contained within this post, or any other Bullfinder-official TV content.

Let the candle breakoutFrom overall view if we change to line chart in 1H we can see it doing the uptrend. Hence we need double confirmation for the candle breakout and retest in zone before we decide which direction the XAUUSD is going.

Not Tradable but Investment is under radarxauusd is not tradable now..
Waiting for yellow line correction.
Buy in decline only... this is strategy
I will update after more price data...
Manage your risk

Gold Looks Heavy,Downside Break Loading?📰 What’s happening:
Gold is losing strength because the market thinks rate cuts are not coming soon.
Strong USD = weak gold.
Simple.
📉 What the chart is showing:
Selling pressure is stacking up.
Market structure is leaning bearish.
We’re sitting right on a major support zone: $4,200
⚠️ Why this matters:
If this support cracks, gold could slide fast into the $4,100zone — that’s the next clean liquidity area.
📌 My view:
I’m watching for a break → retest → continuation to the downside.
Buyers look tired. Sellers look hungry.

GOLD ANALYSIS What’s Moving the Market Today? December 03, 2025OANDA:XAUUSD GOLD ANALYSIS What’s Moving the Market Today? (December 03, 2025)
Welcome back to Trade with DECRYPTERS, where we decode smart-money footprints into clean, actionable buy & sell zones.
Keep it simple. Trust the levels. Follow the plan.
📰 Market Overview
Gold continues its steady climb after reacting perfectly from Smart Money Buy Orders earlier this week. With price now rotating toward upper liquidity pockets, bulls remain firmly in control despite mild USD stabilization.
The U.S. Dollar Index has cooled after its post-election volatility, but ongoing geopolitical pressure and aggressive central-bank accumulation continue to support gold’s macro-bullish structure.
With key U.S. data (ADP, ISM Services, PCE) lined up this week and the FOMC approaching on December 9–10, markets are moving cautiously. Gold remains well-positioned inside a clean premium–discount rotation, respecting SMC structure consistently.
🔍 Key Fundamentals Driving Today’s Move
📈 88% probability of a December rate cut → lower yield competition boosts gold
💵 USD stabilizing but not strengthening → limits downside pressure
🌍 Global geopolitical tensions remain elevated → strong safe-haven premium
🏦 Central banks remain net buyers (634t YTD) → long-term structural demand
📊 Core PCE at 2.9% → keeps the Fed dovish-leaning but cautious
Gold’s strength continues to be driven by a clean mix of macro uncertainty, structural demand, and institutional order-flow behavior.
📆 Key Events to Watch
🔸 ADP Employment Data — Today at 01:15 UK Time
Weak ADP → bullish continuation toward sell zones
Strong ADP → liquidity sweep downward into buy areas
🔸 ISM Services PMI — Later Today
Contraction → strengthens rate-cut expectations
Expansion → stronger USD → intraday dip
🔸 PCE Inflation — December 5
The Fed’s preferred gauge
Soft PCE → pushes gold toward 4300+
Hot PCE → deeper retracement
🔸 FOMC Decision — December 9–10
Market expects 25 bp cut.
Hawkish → tests deeper discount zones
Dovish → breaks into new highs
🔸 Geopolitical Landscape
Any escalation = instant safe-haven spike
Calm USD strength = controlled pullback
🟩 GOLD TECHNICAL LEVELS
Gold continues to respect the rising structure, reacting precisely from discount zones and moving toward your institutional premium blocks. The impulsive bullish leg now positions price directly beneath the next major Smart Money Sell Area.
🟩 📌 SMART MONEY BUY ORDERS: 4147 – 4167
This is your primary institutional demand block, holding nearly $19 million in buy-side liquidity.
Expect:
✔️ First-tap reactions
✔️ Accumulation behavior
✔️ Discount long setups inside the broader bullish channel
A clean breakdown below 4147 opens liquidity toward 4108 → 4075.
🔺 📌 SMART MONEY SELL AREA: 4264 – 4284
This remains your high-probability distribution block, stacked with $29 million in sell-side orders.
Expect:
✔️ Manipulation wicks into premium
✔️ Stop-run behavior
✔️ Swing reversal setups
A break & hold above 4284 = continuation toward 4310 → 4325.
📌 Conclusion
Gold continues to rotate smoothly between institutional premium and discount zones, maintaining a strong bullish structure as long as 4147–4167 holds firm. With ADP data set to inject volatility, expect liquidity-driven movements rather than trend shifts. Stay patient, let the levels do the work, and execute only where smart money is active.
🙌 Support the Analysis
If this breakdown adds clarity to your trading, support with a like & comment it motivates deeper daily analysis.
Share your charts. Engage with the community.
Let’s grow together.
Best Regards,
M. MOIZ KHATTAK | Founder — TRADE WITH DECRYPTERS

Gold price analysis December 2After a slight correction to the 4195 support area, gold quickly regained momentum and continued to maintain the main uptrend structure. This shows that the buyers are still in good control of the market rhythm, especially when the price always receives support at important support zones.
In today's session, the trading strategy still prioritizes BUY orders in line with the trend. It is expected that the market will move towards challenging the psychological resistance zone of 4300 - where profit-taking pressure from the sellers may appear.
📌 Reference strategy
Hold BUY from the 4195 area
BUY Trigger when there is a clear price rejection signal at the support zones: 4170 - 4115
Risk: if the price closes below 4110, selling pressure may return strongly and break the short-term uptrend structure

Report 2/12/25The Federal Reserve’s push toward a December rate cut despite an unusually divided committee, and the way that debate bleeds into the dollar, risk assets and global policy spillovers.
The policy setup is unusually binary. Reporting indicates Chair Powell’s allies have laid the groundwork to deliver a third consecutive cut, moving the target range to roughly 3.50%–3.75%, even at the cost of multiple dissents. The preferred path is “cut-then-hold”: cut once, then use the statement to raise the bar for further easing (a replay of Powell’s 2019 playbook). The alternative is to wait for more labor-market and inflation data in January, but that risks several weeks of public discord with no guarantee of resolution. Markets were pricing the cut above 80% late Monday, after New York Fed President John Williams said there’s “room for a further adjustment in the near term,” and Governor Waller again argued for an imminent move. The split reflects a mix of stubborn ~3% inflation and a cooling, but not collapsing, job market that smells a bit like “mini-stagflation.”
The immediate market reaction has favored “duration-sensitive risk.” Stocks bounced as odds of a December move rose, with tech leading the relief bid; the driver wasn’t fresh data so much as a shift in Fed rhetoric and probabilities. Money-market reference points corroborate easier conditions at the front end: effective fed funds sit near 3.88%, SOFR around 4.12%, and the Treasury bill complex now clears ~3.63%–3.91% across 4–26 weeks. Those levels are consistent with a market already leaning into a down-shift in policy restraint.
The dollar impulse is softer but nuanced. The WSJ Dollar Index is down ~5.8% YTD, with the ICE Dollar Index December future near 99.36. Into a “cut-then-hold,” the messaging matters: if the Fed signals a firm pause after December, the knee-jerk USD selloff should fade; if Powell leans toward an easing cycle, dollar weakness can extend, most visibly against higher-carry and growth-sensitive FX.
The strategic base case is that Powell delivers one cut with tight forward guidance. That path recognizes that earlier tariff-related inflation risks have ebbed at the margin while labor-market downside risks have grown. It also re-establishes consensus by trading one final adjustment today for fewer policy surprises tomorrow. Inside the building, this lowers the temperature without committing to a 2026-style easing cycle. If the committee blinks and waits, expect volatility to build across the dollar and front-end rates for another 4–6 weeks, because the same hawk-dove split will simply roll forward.
On fiscal and political optics, a one-and-done cut helps at the margin by easing Treasury’s near-term bill and note funding costs without stoking the criticism that the Fed is “financing” deficits. It also buys room for the Fed to argue it is not overreacting to every data wiggle. But repeated dissent votes would be politically sensitive and could reopen congressional scrutiny of the Fed’s independence, especially with interest paid on reserves in the spotlight as a perceived “bank subsidy” and with remittances to Treasury volatile around a deferred-asset period. That makes a tightly-messaged, minimal-footprint decision more likely. (The money-rate and remittance dynamics are visible in current policy-rate and SOFR prints; the political scrutiny has recurred whenever IORB outlays are large relative to remittances.)
For Europe, the spillover is double-edged. A softer dollar eases imported inflation for the euro area and the UK, but it also tests ECB communication just as the bloc wrestles with structurally weaker growth and a still-restrictive policy stance (policy rate ~2.15%). If the Fed cuts and the ECB stays put, EUR/USD can grind higher into year-end, but any hawkish Fed framing caps the move. European bank equities would like a steeper curve; a softer USD also tends to support commodities priced in dollars, which complicates the disinflation narrative.
Risks to the base case cluster around three nodes. First, an upside inflation surprise on core services would embarrass a December cut and re-price the entire 2026 curve; that’s why hawks prefer to wait. Second, labor-market fragility is asymmetrically dangerous: if jobless claims or payrolls slip, the committee will wish it had eased earlier, precisely why doves want to move now. Third, communications error risk is high. If Powell fails to clearly separate “insurance cut” from “easing cycle,” equities and high-beta credit could over-extend, forcing a rhetorical counter-swing later.
Here’s how this policy event maps to the assets you care about:
Gold (XAUUSD). A cut lowers real short-rates at the margin and tends to weaken the dollar, both supportive for bullion. Given the Fed’s likely “cut-then-hold,” gold’s impulse is a drift higher rather than a breakout: supportive USD headwinds, but capped by a strong “not a cycle” signal. If the Fed surprises by waiting, gold dips initially on a stronger USD but should stay underpinned by geopolitical tail risk and curve-steepening later in the quarter. The metals complex is already firm (copper futures remain elevated), which is typically consistent with resilient global nominal growth and supportive for precious metals beta.
S&P 500 and Dow Jones. One and done favors long-duration growth (mega-cap tech, secular AI) and quality balance sheets, with domestic cyclicals lagging if guidance is hawkish. The latest tape shows indices grinding higher after a choppy November, and valuation metrics remain rich enough that any whiff of “no more cuts” can spark a rotation into value and dividends. A “wait” outcome would probably take 2%–3% off in the first 24–48 hours, concentrated in high-multiple tech.
USDJPY. The cross is a volatility trap. A Fed cut narrows policy-rate differentials and should, in textbooks, support the yen; but if risk rallies, carry demand can keep USDJPY elevated. Japan’s policy rate sits ~1.875% and 10-year JGB yields are still historically high for this cycle, yet the BoJ’s stance remains looser than the Fed’s, making any USDJPY downside grindy rather than impulsive. Should the Fed wait and sound hawkish, the pair can squeeze higher; watch for MoF jawboning if the move is fast.
DXY / broad USD. The cleanest read. With WSJ Dollar Index down ~5.8% YTD and ICE DXY futures in the high-99s, a “cut-then-hold” extends USD softness modestly against pro-growth FX (AUD, NOK) and EM with credible policy. A surprise hold or a hawkish-cut tone stabilizes and possibly lifts the dollar into year-end.
Crude oil. The macro impulse is small but positive: a softer dollar and a less-restrictive Fed support demand expectations and ease financial-conditions headwinds for energy beta. Absent a fresh supply shock, oil’s near-term path is more dollar-driven than inventory-driven around the meeting. Metals & petroleum futures positioning, as reflected in recent settlements, already implies resilient nominal demand.
What to watch next.:
The market will trade three things on decision day: the size and vote count, the forward-guidance sentence about “further adjustments,” and the press-conference tone. A narrow margin with multiple dissents but hawkish guidance should be risk-neutral. A broader majority and softer language would be risk-positive and USD-negative. If the Fed punts to January, expect a higher dollar, a steeper front-end, and a quick factor-rotation out of high-duration equities. Money-rate prints (fed funds, SOFR, bills) will be the first, clean signal of whether financial conditions are easing as intended.
Actionable framing for you. Into the meeting, the asymmetry looks modestly pro-risk: the committee has already socialized the “cut-then-hold” idea, and front-end rates and the dollar are leaning that way. That supports a bias to buy dips in quality growth and to keep a mild long in gold versus the dollar basket. But respect the communication risk: if Powell over-delivers on hawkish guidance, fade any opening-rally exuberance in high-multiple tech and add back USD on crosses most exposed to carry-unwinds.

GOLD: My biggest fearHello,
This post is to not scare anyone, take it as a long term warning.
Today US debt is super high and it is hard to pay interests and pay off the debt.
Only way US can get out of it is by Hyper inflation, meaning money becomes cheap and their debt becomes very small compared to GDP.
Just by looking at GOLD, I see that if the red resistance is crossed, we could expect gold to reach 4000+ in next 4 to 5 years, which is a life changing thing for anyone.
Currencies collapsing, major war, life style changes and poverty will prevail.
Only way to control this is by reducing US spending and stabilizing US economy and increasing the production and services.
Silver is also looking very scary, if GOLD breaks out then Silver will easy go 2x.
INVEST SMARTLY, PROTECT YOURSELF FROM INFLATION.
CAPITALCOM:GOLD
Cheers,
Happy investing

long XAUUSD“The market has completed a bullish correction, retracing into key Fibonacci levels. There is also an FVG aligned with this zone, making it a favorable area for potential longs as long as the bullish structure remains intact.”

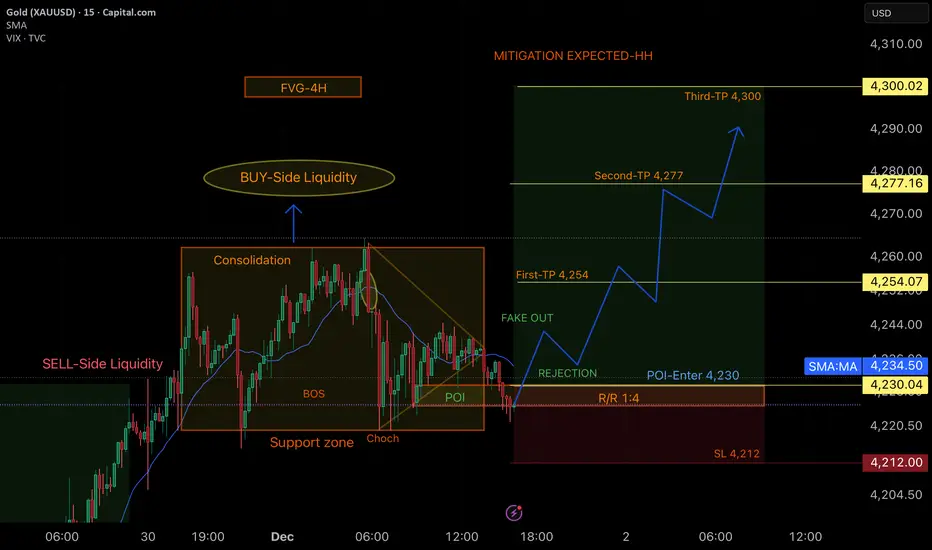
Bullish Analysis Gold-15M (SMC)Breakdown
On the 15-minute chart, I’m seeing a very clean accumulation → manipulation → expansion sequence that aligns perfectly with institutional behavior. 📈✨
The market first formed a consolidation range, building both buy-side and sell-side liquidity. 💧⬆️⬇️ After that liquidity was engineered, price delivered a Buy-Side Liquidity sweep, followed by a strong move down that broke structure, giving me a clear BOS and shortly after a CHOCH, signaling a potential shift in momentum. ⚡🔄
Once the shift was confirmed, price tapped directly into my POI at 4,230, which aligns with an order block and a previous support zone that has shown strong reactions. 🎯📍 This is the level I’m interested in for entries because institutions often return here to mitigate before starting their expansion phase.
Inside this POI we got a small fake out, followed by a clean rejection, confirming the setup. From here, I project a bullish move with a 1:4 R/R, protected with a stop-loss at 4,212. 🛡️📊
I set three take-profit levels based on liquidity and imbalances:
• TP1: 4,254 → first reaction zone & nearby liquidity. 🥇📌
• TP2: 4,277 → unmitigated imbalance and previous liquidity. 🥈📈
• TP3: 4,300 → expected mitigation at the previous higher highs; major liquidity target. 🥇🎯✨
My bullish bias remains intact as long as price respects the POI. Liquidity, structure, and the unmitigated 4H FVG above all support the idea of price pushing toward those higher highs. 🚀💚
💬 Motivational Message
Every analysis—win or loss—brings you one step closer to mastery.
Trust your process, stay disciplined, and remember: the market rewards those who stay consistent even when the setup takes time.
You’re leveling up every single day. Keep pushing.
GOOD LUCK TRADERS…. 💪🔥📈
Gold buy idea📈 Gold Buy Idea
Gold has been in an uptrend since Friday. Price continues to rise as London provides the main supply expansion, and NY liquidity merges with the London move, creating strong bullish momentum.
How to Trade It
1️⃣ Wait for the 30m candle to close above 4262
You need a full bullish candle closing above this level to confirm continuation.
2️⃣ Volume Confirmation
Volume must be above average or at least match the previous candle’s volume to validate strength.
Invalidation / Avoid Taking the Trade
❌ If the current 30m candle closes below the previous candle, skip the trade.
❌ You can re-enter only if price closes back above 4262, following the same confluences listed above.

XAUUSD : H3 Quick Update , 4200$ Time To Back Fall Gold ??Lets Start Our Journey Of Trading Lets Learn And Grow Together Oky Guys Stay Tuned And Stay With Us
In This Anaylsis We Are Waiting For A Confirmation To Sell Xauusd Down Trend Lets Goo Gold And The Second Setup Is We Are Waiting For Bullish Setup From CISD or ORDER BLOCK to Buy Gold Target Will Same Where We Are Selling Stay Strong Be Patient
Thanks 🙏 Can Comment Your Opinion And Kindly Share This Post As Possible Boost And Follow My Account ✅

XAUUSD | Gold Signal |Dec 2,2025BUY TREND TARGET FOR TODAY 📊
The market is pricing in a near-certain rate cut in December. Dovish comments from Fed officials from Waller to Williams, coupled with weak manufacturing data, reinforce the argument that growth risks are rising faster than inflation risks. Gold reacted sensitively to this backdrop, with the dollar falling to a two-week low before recovering slightly. I believe the gold-silver market is entering a period of high volatility, but the bullish structure remains intact.
Rate cut expectations, a weaker dollar, and weak economic data continue to be the three main pillars supporting prices. However, rising bond yields and uncertainty over Fed leadership mean the rally could be interrupted in the short term. Powell’s speech this week will play a guiding role, especially on Q1 2026 interest rate expectations.1
Strategically, investors should keep a close eye on employment, PCE, and bond developments. In an environment where the monetary policy cycle is pivoting, gold plays the role of portfolio insurance, while silver continues to be the asset that responds most strongly to market sentiment and macro expectations, with higher returns but also greater risk.1% The main trend of gold remains bullish in structure.
♾️Gold BUY @ 4215- 4220
💰TP1 - 4225
💰TP1 - 4230
🚨Sl: 4210

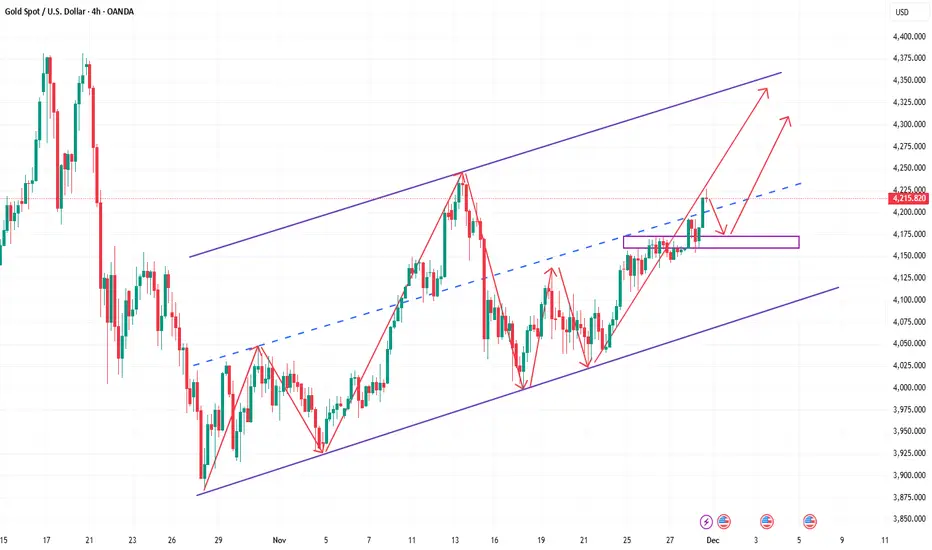
XAUUSD - H4
1. Overall Trend Context
The chart shows bullish structure on the H4 timeframe.
After a period of accumulation and a confirmed Break of Structure (BOS) to the upside, price has continued climbing within a rising channel.
Your marked ChoCH (Change of Character) signaled the initial shift from bearish to bullish.
🔵 2. Key Levels & Zones Identified in Chart
Demand / Reaccumulation Areas (Blue Zones)
4,168 – 4,176
4,192 – 4,200
These represent areas of:
Prior demand
Unmitigated FVG (Fair Value Gap)
Potential retests before continuation
These are the logical retracement points before bullish continuation.

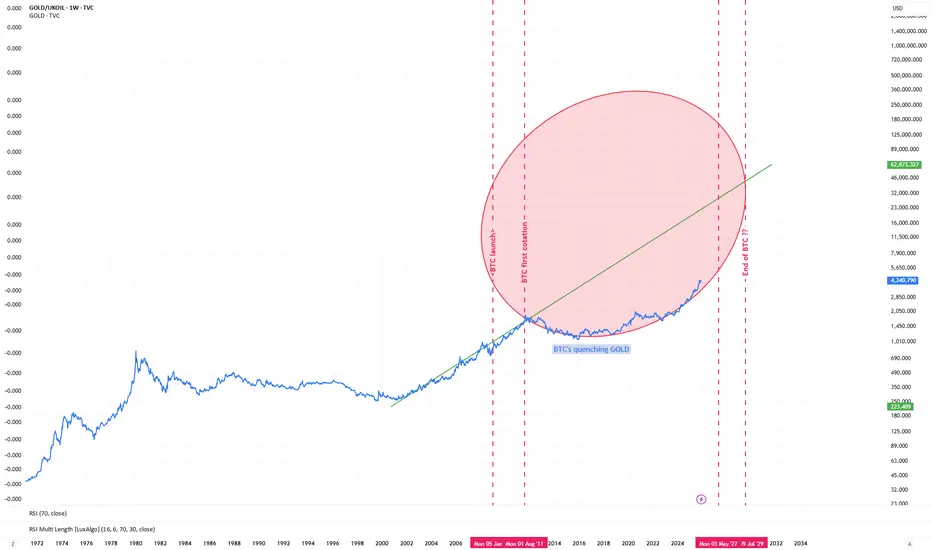
BTC has been lauched just to quench GOLD. After years of fight, GOLD finally won a few months ago.
Paper gold/silver and (real) privacy cryptos are going to pop the banking system.
Gold prices continue to recover 4277⭐️GOLDEN INFORMATION:
Gold (XAU/USD) trades firmer near $4,230 in early Asian hours on Monday, supported by rising expectations of a Fed rate cut in December. Markets now look ahead to Monday’s US ISM Manufacturing PMI for further direction.
Speculation of continued Fed easing remains a key driver for gold, with weaker US data and dovish comments from policymakers boosting bets on a December cut. The CME FedWatch Tool now shows an 87% probability of a rate reduction at the December 9–10 meeting, up from 71% last week. Lower rates reduce the opportunity cost of holding non-yielding gold, further supporting the metal
⭐️Personal comments NOVA:
Continued recovery momentum - gold price maintained its increase above 4205. Bulls believe in the last rate cut in December 2025
⭐️SET UP GOLD PRICE:
🔥SELL GOLD zone: 4275 - 4277 SL 4282
TP1: $4260
TP2: $4245
TP3: $4230
🔥BUY GOLD zone: 4195 - 4193 SL 4188
TP1: $4210
TP2: $4225
TP3: $4240
⭐️Technical analysis:
Based on technical indicators EMA 34, EMA89 and support resistance areas to set up a reasonable BUY order.
⭐️NOTE:
Note: Nova wishes traders to manage their capital well
- take the number of lots that match your capital
- Takeprofit equal to 4-6% of capital account
- Stoplose equal to 2-3% of capital account

How high will gold go next week How much room is there to go up?Gold Technical Analysis: Gold has seen several highlights this week, breaking through the 4200 mark again, a figure that has caused considerable panic. Coupled with consecutive daily gains and high-level consolidation, this is the first sign of a strong upward move. The daily chart shows a reversal from a bearish to a bullish pattern, and if this pattern continues for two more days, forming a consecutive bullish formation, it will likely evolve into a second upward move. On Friday, gold experienced a relatively strong surge, falling to a low of around 4153 and rising to a high of around 4226. Currently, the bullish trend remains unchanged, and pullbacks present opportunities to enter long positions. The next key resistance level to watch is around 4245; if this level holds, a short position can be considered before going long.
This week, the key resistance area for gold is around 4240-4250. If it can break through effectively, the price of gold is expected to further test the previous highs of 4300 and even 4380. On the downside, 4175-4160 has turned from resistance into the first strong support, and the more critical support is at the 4150 level, a trading zone between bulls and bears. From the 4-hour chart, the main support for the price is at 4200. As long as the market maintains its strong upward momentum, it will not retrace too deeply. Therefore, it is necessary to pay attention to the short-term bullish trend. On the hourly chart, the price rose from 4155, and after a retracement from 4170-4180, it rose to 4226. The bullish trend support is at 4155. As long as the price does not break 4155, it will continue to rise and move towards the 4240-4250 area. In summary, the recommended strategy for gold trading next Monday is to primarily buy on dips and secondarily sell on rallies. The key resistance level to watch in the short term is 4240-4250, while the key support level is 4180-4160. Please keep up with the pace of the market.
XAUUSD: Strong Growth and Buying OpportunityWith the prospect of a Fed interest rate cut and the weakening of the USD, XAUUSD is showing signs of a strong growth phase. Based on macroeconomic news and technical charts, we can see that the price of gold continues to hold steady above the uptrend line .
XAUUSD is currently pulling back to instant support at 4,120,000 USD . The uptrend is supported by the EMA (34, 89) indicators and the current upward trend. The strong support at 4,120,000 USD plays a crucial role in maintaining this upward momentum.
Short-Term Forecast:
XAUUSD could continue to rise to higher levels if it holds above 4,120,000 USD, with the next target being the TP1 level at 4,200,000 USD , and even the TP2 level at 4,250,000 USD . This is supported by market expectations that the Fed will continue to lower interest rates in December, weakening the USD and boosting demand for gold as a safe-haven asset.
Conclusion:
With a stable upward trend and support from both the market and chart indicators, XAUUSD is likely to continue its upward movement. If there is a pullback to the support level, it will provide an excellent opportunity for buying.

GOLD ANALYSIS (1 W)To understand the psychology in Gold,
I use only two tools:
Fibonacci retracement,
Trend-based Fibonacci extension.
We will use these two tools to measure the weekly cycles.
Since November 2022, Gold has been forming a pattern that can only be explained by Fibonacci principles.
Using Fibonacci retracement for each swing high and low, you'll realize that each retracement equals around 50%.
In only one example, we see that a higher low reaches the 61.8% level, which is also acceptable.
After these retracements, the next leg of the impulsive move always reaches around the 1.618 Fibonacci extension.
According to these two basic technical factors, Gold should first reach around $3,800, and then aim for the $6,600 level during the next impulsive leg in the coming years.
I’m not even going to list all the reasons why Gold tends to go up over time.
Most people reading this analysis are already aware of the fundamentals behind Gold’s long-term bullish nature.
Thanks for reading.
