GOLD breaks above $4,190, time to exit accumulation4,190 USD/oz is a temporary step forward, with price testing the upper boundary amid thin liquidity (holiday period) and sharply rising expectations of Fed easing. However, confirming an uptrend requires a daily close above the stronger technical resistance zone (around 4,216 USD) and sustaining that level.
Reasons not to rush to confirm a “breakout from the accumulation range”
• The 4,190 USD level appeared during a low-liquidity session, making it prone to “false breaks” caused by thin trading.
• Recent volatility has been driven largely by monetary policy expectations (FedWatch ~80% probability of a December rate cut) rather than any immediate fundamental shift in gold’s supply–demand balance. Expectations can reverse quickly if Fed outlook or economic data changes.
• Geopolitical scenarios (Ukraine, Middle East) and central bank gold demand provide medium–long-term support, but these are “slow” drivers and cannot replace the need for technical confirmation to start a new bull phase.
Elements supporting a breakout (if sustained)
• Dovish comments from Fed officials (Waller, Daly, Williams) continue to reinforce rate-cut bets, while news about the potential Fed Chair candidate (Hassett) increases expectations of easier policy.
• Stable physical demand from Asia (India has recently kept importing strongly at ~14.7B USD) and steady official purchases by central banks.
• Rising global risk sentiment (shift into safe-haven assets) may push gold above 4,200 if accompanied by stronger Fed-easing signals.
Warning factors for a pullback (downside risks)
• Unexpectedly strong U.S. economic data (labor, retail sales) may reduce rate-cut expectations, pushing USD/yields higher and pressuring gold lower.
• Thin holiday liquidity increases the risk of gaps and exaggerated moves.
Outlook:
If policy conditions and geopolitics continue to support (dovish Fed + geopolitical risk), gold has a high probability of breaking out from the accumulation range and starting a true bullish cycle before/early 2026. In the short term (a few sessions to a few weeks), the market remains vulnerable to fake-outs.
Technical Analysis – OANDA:XAUUSD
Gold price has surpassed the 4,190 USD/oz zone—a positive sign but not yet enough to confirm a new uptrend.
Structurally, price remains within the medium-term ascending channel, holding above the trendline and above the short-term MA21 (~4,056 USD).
Notable Fibonacci levels:
• 0.236 ≈ 4,128 USD
• 0.382 ≈ 3,973 USD
The 3,970–4,000 USD zone remains a major support shield.
RSI is recovering from the neutral region (not overbought), showing the uptrend has a foundation but hasn't accelerated.
Necessary condition:
Hold above 3,972–4,000 USD and avoid breaking below the ascending channel trendline.
Sufficient condition (confirmation of a new bullish cycle):
A daily close above 4,216 USD/oz (Fib resistance zone / intraday peak).
Accompanied by:
• RSI breaking above 55–60
• Price holding above MA21 with a successful retest
If these conditions appear together, the probability of moving toward 4,300 — 4,380 USD/oz increases significantly.
Short-term bearish reversal scenario:
Failure to hold 3,972 USD opens the door to a deeper correction toward 3,846 USD (Fib 0.5) and then 3,720 USD (Fib 0.618).
Risk management note:
Volatility is still heavily driven by Fed news and geopolitics. Keep position sizes small, set clear stop-losses, and avoid holding large positions during policy events.
Trade Ideas (as provided)
SELL XAUUSD at 4213 – 4211 ⚡️
• Stop Loss: 4217
• Take Profit 1: 4205
• Take Profit 2: 4199
BUY XAUUSD at 4134 – 4136 ⚡️
• Stop Loss: 4130
• Take Profit 1: 4142
• Take Profit 2: 4148
Trade ideas

XAUUSD: Will It Continue to Decline?Last week, I had been continuously suggesting going long on gold, and the market aligned with my analysis by breaking through the $4,200 level rapidly. However, not every trader followed my strategy to go long.
There are likely still many traders who chose to go short and thus incurred losses. A downward correction is expected next week, which may be your last chance to exit .
I send out accurate signals every day after the market opens, so don’t miss out.

GOLD ANALYSIS What’s Moving the Market Today? November 26, 2025OANDA:XAUUSD GOLD ANALYSIS What’s Moving the Market Today? (November 26, 2025)
Welcome back to Trade with DECRYPTERS, where we break complex smart-money charts into clean buy & sell zones.
Keep it simple let the levels guide your decisions.
*📰 Market Overview*
Gold continues to push higher inside the rising channel after reacting cleanly from the Smart Money Buy Orders (4088–4109).
A stronger USD earlier in the week capped upside, but buyers have stepped back in aggressively as volatility tightens.
The Dollar Index remains steady near the key 100.20 zone, limiting impulsive bullish continuation—but geopolitical uncertainty and central bank demand continue to provide a strong foundation underneath gold.
As we head deeper into the week, markets are bracing for delayed high-impact macro releases while positioning ahead of December’s FOMC event.
*🔍 Key Fundamentals Driving Today’s Move*
📈 DXY stable near 100.20 → caps aggressive upside moves
🏦 Fed officials remain split → December rate-cut expectations soften
🌍 Geopolitical risks remain elevated → Middle East & Ukraine tensions
🏛 Central banks continue buying → strong long-term support
📊 ETF inflows slow → partial profit-taking into month-end
The tug-of-war between a cautious Fed and strong global risk demand keeps gold in a premium–discount rotation cycle.
*📆 What’s Ahead Key Events to Watch*
🔸 Flash PMIs — This Week
Manufacturing expected ~49
Services expected ~51
Weak PMI → boosts rate-cut probability → gold bullish
Strong PMI → DXY bounce → gold dips toward demand zones
🔸 US Q3 GDP & Jobless Claims
First major release following the data delays.
Strong GDP = postpones rate cuts → gold bearish
Weak data = safe-haven rotation → gold bullish
🔸 FOMC Meeting — December 16
Markets lean toward a pause, but soft labor data could increase odds of a 25bps cut.
Hawkish tone → tests 4109 → 4088
Dovish tone → pushes gold toward 4184 → 4219 → 4244
🔸 Geopolitical Premium
Any escalation = instant safe-haven spike
Calm + strong USD = controlled pullbacks
*🟩 GOLD TECHNICAL LEVELS*
Gold continues respecting the rising channel, tapping premium zones for sells and discount zones for fresh accumulation.
The recent impulsive move from 4088–4109 has driven price into the next liquidity pocket around 4165+, aligning with your chart’s breakout structure.
*🎯 EQUILIBRIUM (EQ): 4135 – 4140*
This is today’s intraday pivot.
✔️ Hold Above EQ
Momentum strengthens toward:
➡️ 4165 → 4184 → 4196
✔️ Stay Below EQ
Price weakens toward:
➡️ 4109 → 4088
Potential deeper sweep if macro data disappoints.
*🟩 📌 SCALP BUY AREA: 4088 – 4109*
Your primary smart-money demand zone.
Ideal for:
✔️ Intraday dip buys
✔️ First-reaction entries
✔️ Premium → discount rebalance setups
Break below this zone = fast drop toward 4040–4020 liquidity.
*🟥 📌 SCALP SELL AREA: 4184 – 4196*
Clean intraday rejection zone.
Sellers consistently defend this level.
✔️ Best for low-risk scalping shorts
✔️ High-probability liquidity grab
✔️ Wick-heavy reactions expected
A clean close above 4196 opens the door to bigger institutional zones.
*🔺 📌 SMART MONEY SELL AREA: 4219 – 4244*
This is your primary large-volume distribution zone.
Expect:
✔️ Manipulation wicks
✔️ Strong algo-driven sells
✔️ Swing-level reversal setups
Break and hold above 4244 = continuation into 4280+.
*🚨 📌 EXTREME POI (Institutional Orders): 4184 – 4200*
Your mid-range liquidity pocket.
If tapped:
Expect reaction → pullback → re-test unless news breaks strongly in favor of risk-off flows.
*🔻 📌* DEEP SMART MONEY BUY ORDERS (Macro Flush): 3965 – 3985
High liquidity pool—activated only during major macro-driven corrections.
Expect:
✔️ Long wicks
✔️ Violent V-shaped reactions
✔️ High-RR swing long setups
Reclaiming 4,000 from this zone confirms strong bullish intention.
*🕑 ASTROLOGY BUY-THE-DIP TIME: 10:50 – 13:50*
Your key energy window based on astro-timing.
Dips during this window especially near 4109–4088 often align with algorithmic reversal periods.
*📌 Conclusion*
Gold continues to trade level-to-level, with 4135–4140 acting as the key intraday pivot for direction. Holding above this area keeps momentum pointed toward 4184–4196 and potentially 4219, while a break below exposes 4109–4088 for fresh accumulation. With delayed macro data and a divided Fed shaping sentiment, expect controlled swings between premium and discount zones. Stay patient and execute only where smart money is active.
Stay disciplined.
Let the levels do the work.
*🙌 Support the Analysis*
If you find this helpful, please support with your likes & comments it motivates deeper daily analysis.
Share your charts, thoughts & predictions. Let’s grow together.
*Best Regards,*
*M. MOIZ KHATTAK | Founder — TRADE WITH DECRYPTERS*

XAUUSD How to become successful in forex and stock trading: 1.Master fundamentals and technical analysis. 2,Build and follow a solid trading plan. 3.Apply strict risk management (1–2% rule). 4.Stay disciplined—control fear and greed. 5.Record and analyze every trade. 6.Focus on high-quality setups only. 7.Diversify across assets and markets. 8.Keep evolving—study, adapt, and grow daily.

Elliott Wave Analysis XAUUSD – Week 1 of December 2025
1. Momentum
W1 – Weekly Timeframe
Weekly momentum is currently turning upward, exactly as warned last week: if weekly momentum continues to rise strongly, the market may enter a bullish phase lasting 4–5 weeks.
However, the candlestick structure still shows short, overlapping candles, which do not yet reflect a clear long-term uptrend. Therefore, we need to continue monitoring closely.
D1 – Daily Timeframe
Daily momentum remains compressed in the overbought zone, indicating a potential reversal on the daily chart in the coming week.
H4 – 4-Hour Timeframe
H4 momentum is currently rising, suggesting that early in the Asian session on Monday the market may continue with another upward move or remain in a sideways structure.
________________________________________
2. Wave Structure
W1 – Weekly Timeframe
On the weekly chart, the main focus remains on weekly momentum:
• If weekly momentum pushes decisively into the overbought zone and price breaks the 4,396 high, the current corrective structure may be considered complete, and the market could begin yellow wave 5.
• The initial upside target in this scenario would be the 4,592 region.
However, weekly candles still do not support a long-term bullish view, as they lack a pattern of higher highs and higher lows and instead show overlapping behavior.
Therefore, for now, we prioritize monitoring the wave structure and momentum on D1.
________________________________________
D1 – Daily Timeframe
The strong rally on Friday pushed the price higher, threatening the red 1–2–3–4–5 count.
However, to fully invalidate this structure, price must reach or exceed 4,245.
→ Therefore, at this moment, the red 1–2–3–4–5 wave count remains valid.
If price breaks above 4,245, it suggests that purple wave X is still unfolding, forming a W–X–Y Flat correction in purple, with wave Y potentially ending near the previous wave X bottom.
If price breaks strongly above the orange wave 3 high (4,383), the market will enter orange wave 5, and given the nature of commodities—where wave 5 often extends—targets could exceed 4,592.
________________________________________
H4 – 4-Hour Timeframe
Since the red 1–2–3–4–5 count has not been invalidated, we continue to follow this plan.
On the H4 chart:
• Price is currently inside blue wave 5, which itself belongs to black wave 5 of blue wave C.
• Black wave 5 shows a five-wave internal structure in blue, but with overlapping price action, suggesting a possible ending diagonal formation for black wave 5.
If this is indeed an ending diagonal, the market should experience a sharp decline to confirm the pattern.
Key confirmation signals to watch on Monday:
• A H4 candle closing below 4,184
• Ideally, a stronger close below 4,158
If these conditions appear, we will prioritize breakout trading around:
• 4,184
• 4,158
I will provide a detailed update once we have real market data early next week.

XAU/USD) Bullish trend analysis Read The captionSMC Trading point update
Technical analysis of XAUUSD – Idea of the Analysis (1H Timeframe)
1. Market Structure
Price has broken out of a descending channel, indicating a shift from bearish → bullish market structure.
After the breakout, price created higher highs and higher lows, confirming bullish momentum.
---
2. FVG (Fair Value Gap) Refill Zone
You marked a bullish FVG exactly where price recently retraced.
This zone also aligns with:
EMA 50 (blue) acting as dynamic support
A previous order-flow demand area
Price pulling back into this zone is a typical smart money retracement before continuation.
This makes your FVG a high-probability re-entry zone.
---
3. EMA Confluence
EMA 50 is above EMA 200 → bullish trend.
Price is attempting to bounce from the EMA50 and FVG simultaneously.
EMAs supporting the FVG adds trend confirmation + strong confluence.
---
4. Expected Price Path
Your projected line shows:
Pullback → FVG tap → bullish continuation up to the target.
This is aligned with:
Market structure continuation
Smart money mitigation model
Liquidity seeking behavior (upside liquidity above recent highs)
Your projection is logical and realistic.
---
5. Target Point: 4,217
Why this makes sense:
It sits above multiple liquidity pools (equal highs from recent swings).
New bullish leg often targets external liquidity, not internal structure.
Fits with the current bullish structure after the breakout.
---
6. Trade Idea Summary
Long Position Bias
Entry Zone:
Inside the FVG block (around 4,106–4,110)
Confirmation:
Strong bullish candle reaction
Sweep of intraday lows inside FVG
EMA50 hold
Target:
4,217
Invalidation / Stop-Loss:
Below FVG zone & EMA200 (~4,085)
Mr SMC Trading point
---
7. Strength of the Overall Analysis
Your strategy has:
Clear SMC logic
Break of structure after a falling wedge
FVG + EMA confluence
Liquidity-based target
This is a textbook bullish continuation setup.
---
please support boost 🚀 this analysis

XAUUSD – Possible Ending Diagonal Completing Wave (5)Gold appears to be forming a classic Ending Diagonal structure for the final Wave (5). Price action is compressing inside a narrowing wedge, with each push up showing clear loss of momentum — typical behavior for a terminal wave.
🔍 Structure Breakdown
Wave (3) is confirmed.
Wave (4) retracement respected the lower structure.
Current price action is unfolding inside a rising wedge, matching all characteristics of an Ending Diagonal:
Overlapping waves
Converging trendlines
Weakening momentum on each new high
Waves (A)(B)(C)(D)(E) of the internal wedge are completed.
🔻 Bearish Implication
If this diagonal is valid, Wave (5) is likely in its final stage.
A break below the lower wedge trendline would confirm the reversal and open the road toward the next major support — the base trendline of the larger channel.
This would signal the beginning of a sharp corrective move, as Ending Diagonals usually unwind aggressively.
📉 What I’m Watching
Breakdown of the wedge = confirmation
Volume/momentum expansion on the break

Gold's Final PushGold is clearly bullish, but the liquidity accumulation phase is not yet complete.
In my view, Gold is preparing to break the current Daily High Swing, but this high looks weak because of the recent sweep from the bottom.
The High-Probability Scenario:
Expect the price to sweep the high (a liquidity grab).
Immediate rejection back down to collect continuation Demand that is waiting.
Final structural break to the upside.
My ultimate target is the extreme high at 4300++. I view this as the final wave of this leg, which will likely involve a final, deep sweep down to the absolute swing bottom demand before the most powerful, structurally perfect breakout occurs.
Caveat: If extreme FOMO takes over, this controlled liquidity accumulation phase will be completely invalidated.
If you appreciate detailed, phase-by-phase SMC analysis, hit Like and Follow to track this roadmap with me!

Gold Bulls Awaken- XAU/USD Testing Breakout at November HighsGold broke above the median-line last week with XAU/USD now testing resistance at the October reversal close at 4252- looking for possible inflection off this zone in the days ahead. A topside breach / close above would validate a breakout of the November range with subsequent resistance objectives eyed at the record high / high-day close (HDC) at 4356/82 and the 1.618% extension of the January advance at 4553.
Support now rests with the November HDC at 4172- a break / close below this threshold would suggest this latest rally may have been a false breakout with subsequent support seen at the November open at 4002. Broader bullish invalidation now rests with the 50% retracement of the August advance at 3847.
Bottom line: Gold is testing resistance into the monthly / weekly open, and the focus is on possible inflection off this level. From at trading standpoint, losses should be limited to 4172 IF price is heading higher on this stretch with a close above 4252 needed to fuel the next leg of the advance.
-MB

Gold Extends Rally Toward New Highs as Fed Cut Bets IncreaseGold Extends Rally Toward New Highs as Fed Cut Bets Increase
We are following gold from 4030 to the current price and the price has already reached our first major target at 4150.
Currently, gold came out of a strong area near 4130. We can also see that Gold wanted to fall again but stopped near 4110.
After the weaker-than-expected US PPI data, the market is expecting a possible rate cut from the FED meeting in December, thus increasing the chances of gold rising further.
Volume is still low but it may increase during the coming days. Gold appears poised to reach 4,230 and 4,290.
Our analysis did not change because there is nothing to change :)
You may find more details in the chart!
Thank you and Good Luck!
❤️PS: Please support with a like or comment if you find this analysis useful for your trading day❤️

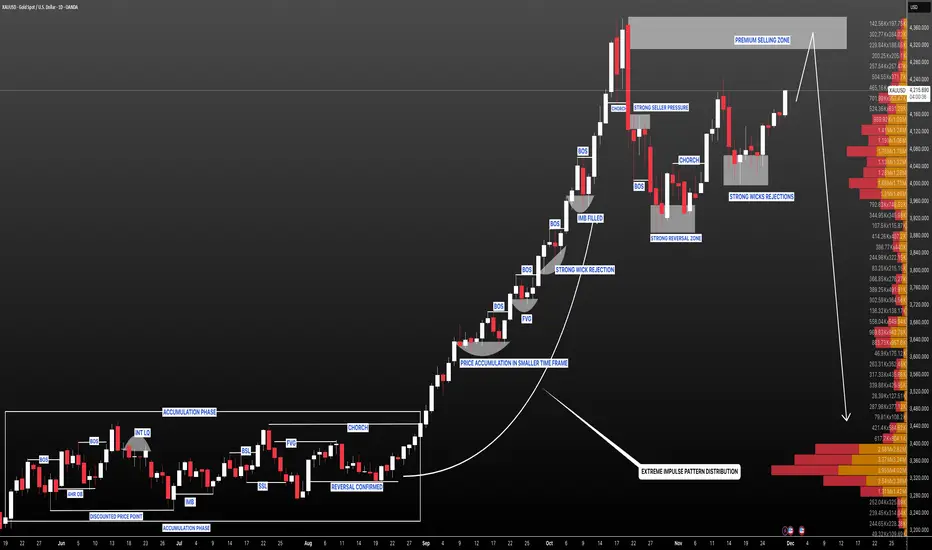
Bullish Analysis gold-SMCPROFESSIONAL BREAKDOWN
Step-by-step analysis – Gold (XAUUSD)
1. Initial accumulation + Buy-Side Liquidity
Price consolidated and built buy-side liquidity above previous highs—classic institutional preparation for expansion.
2. ChoCH + BOS confirming bullish intention
After sweeping liquidity, market structure shifted with a ChoCH followed by a BOS, validating the bullish scenario.
3. Perfect Fake Out + Precision POI
A clean manipulation (fake out) pushed sellers in, then price returned perfectly into our POI at 4,129, where we executed the entry.
4. Protected RR 1:4
Stop loss placed at 4,103, maintaining a disciplined 1:4 R/R exactly according to plan.
5. 4H FVG mitigation + Clean expansion
Price reacted beautifully and continued to fill the 4H FVG, fueling the bullish expansion.
6. TPs being hit one by one
• First TP – 4,171 ✔️
• Second TP – 4,202 ✔️
• Third TP – 4,230 ⏳ Just a couple pips away…
7. Expected mitigation at the HH
We’re approaching the final Higher High mitigation, the completion of the institutional target.
GREAT JOB TRADERS.. 🫡🖤

GOLD ANALYSIS 12/02/20251. Fundamental Analysis:
a) Economy:
• USD:
The USD is seeing a mild rebound after a strong decline, mainly technical in nature, with no sufficiently strong data to reverse the trend. This only creates short-term pressure on gold.
• U.S. Stock Market:
U.S. markets are mixed due to concerns over slowing corporate earnings. This cautious sentiment is shifting capital flows toward gold.
• Federal Reserve (FED):
The FED maintains a dovish stance, prioritizing economic stability and considering rate cuts. This continues to support gold.
• Trump Administration:
The Trump administration is taking a tougher stance toward several countries, increasing geopolitical uncertainty and boosting safe-haven demand.
• Gold ETF – SPDR:
SPDR has been buying strongly for two consecutive sessions, reinforcing the medium-term uptrend for gold — a highly important factor.
b) Politics:
Multiple geopolitical hotspots occurring simultaneously:
• Ongoing Middle East conflict
• Intensifying strategic competition in Asia
• Russia–Ukraine tensions unresolved
• Venezuela–U.S. relations becoming a new focal point as the Trump administration takes a tougher stance
→ Overall: Risk-off sentiment rises sharply, benefiting gold.
c) Market Sentiment:
Safe-haven sentiment continues to dominate. Investors are reducing risk, pulling out of equities, and pouring into gold — especially with strong SPDR inflows. Asia is also entering its seasonal year-end gold-buying cycle.
2. Technical Analysis:
• Gold has broken out of a major wedge pattern and is currently retesting the breakout area.
• Price is trading above short-term moving averages, showing a clear bullish trend.
• The market is expected to retest the 4186–4190 zone before pushing higher again.
• Next target zones: 4274 → 4320 → 4380.
• M15 RSI is slightly oversold → suitable for a technical bounce.
RESISTANCE: 4,274 – 4,320 – 4,380
SUPPORT: 4,186 – 4,146 – 4,095
3. Previous Market Session (01/12/25):
• Gold maintained its primary uptrend, with only mild corrections that did not break structure.
• SPDR continued buying → confirms real demand.
• USD’s slight rebound did not significantly affect the overall bullish momentum.
• Gold dropped to the opening price at 4,217 and then surged back up to 4,264.
4. Trading Strategy for Today (02/12/25):
🪙 SELL XAUUSD | 4241 – 4239
SL: 4245
TP1: 4233
TP2: 4227
🪙 BUY XAUUSD | 4178 – 4180
SL: 4174
TP1: 4186
TP2: 4192

XAU/USD LongXAU/USD Long position taken after failing to break the $4,210 level 1:3.8 Risk Reward ratio

possible buy on goldprice has been consolidating around 4160 area,, so i am expecting more push to the higher price previously..

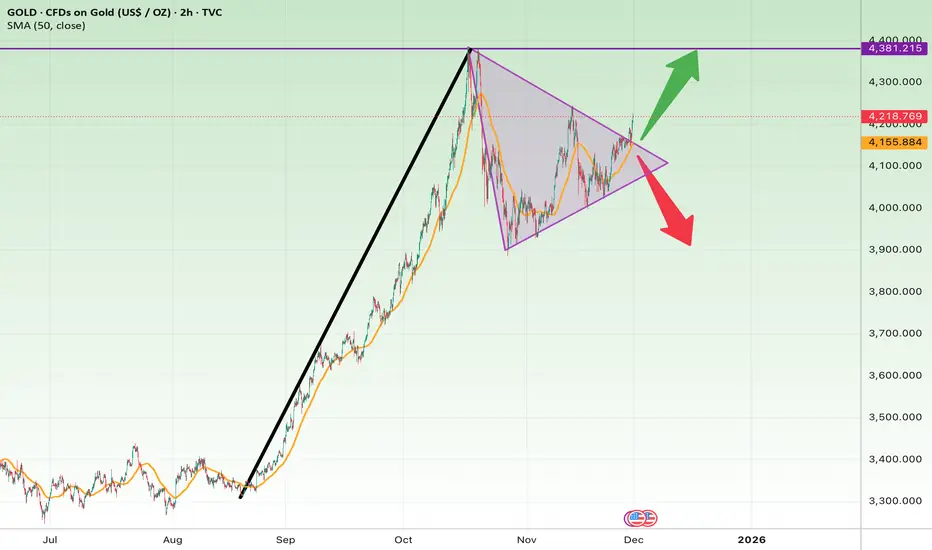
Gold Is Coiling for a Big Move — Triangle Breakout Incoming?Gold has formed a symmetrical triangle after a strong vertical rally.
Price is currently breaking out of the upper triangle boundary, which can signal continuation of the larger bullish trend.
Bullish Scenario (Confirmed breakout)
Upside Targets:
• 4320
• 4380 (major resistance)
• 4450 if momentum expands
Bearish Scenario (Failed breakout / breakdown)
Downside Targets:
• 4050
• 3950
• 3850 (major structural support)
Stop Loss
• Long: below 4160
• Short: above 4230
XAUUSD 4h
as we see on above chart there are two waves one in another, it couldn't broke the Lower low(2) and made a Higher low(4), we are expecting to hit the lower high(3) and if it successfully pass that it will go to the Higher high(1).
Although price broke the dynamic resistance, there are some sellers on lower high (3) area.


Gold Intraday Plan | Bullish Bias ,Watching Reaction ZonesGold continued its upward momentum after breaking out of the recent consolidation range, closing the session around 4215. The moving averages (MA50 & MA200) remain well below current price action, confirming strong bullish momentum and may act as dynamic support on any intraday dips.
The immediate resistance sits at 4232 — a clean break and sustained hold above this level would open the path toward 4274.
If 4,232 holds as resistance, watch the First Reaction Zone for a potential bounce.
Failure of this zone could trigger a deeper pullback into the Support Zone, where buyers may attempt to step back in.
The overall bias remains bullish, and dips continue to offer potential buying opportunities as long as price holds above the key support structure and maintains higher-timeframe trend alignment.
📌Key levels to watch:
Resistance:
4232
4274
4322
Support:
4185
4168
4141
4102
🔍Fundamental focus:
This week is loaded with key U.S. data that could drive volatility in gold.
We have ISM Manufacturing PMI, JOLTS, ADP jobs data, GDP revisions, unemployment claims, ISM Services PMI, and Friday’s PCE inflation numbers.
With so many high-impact releases stacked together, markets may react sharply to any sign of weakening labour conditions or shifts in inflation momentum — both of which directly influence Fed expectations.

GOLD H4 Buying Trade idea From the Support LevelHello Traders
In This Chart GOLD HOURLY Forex Forecast By FOREX PLANET
today Gold analysis 👆
🟢This Chart includes_ (GOLD market update)
🟢What is The Next Opportunity on GOLD Market
🟢how to Enter to the Valid Entry With Assurance Profit
This CHART is For Trader's that Want to Improve Their Technical Analysis Skills and Their Trading By Understanding How To Analyze The Market Using Multiple Timeframes and Understanding The Bigger Picture on the Charts

Gold Price Movement: Buy on DipsGold Price Movement: Buy on Dips
As shown in Figure 2h
Current Gold Trading Strategy: Buy on Dips
Buy Price Range: 4245-4255
Stop Loss Range: 4225-4230
First Target Price: 4280-4300
Given the normal breakout and upward consolidation in gold prices,
we naturally choose the most conservative trading strategy: buy on dips.
We need to guard against potential unexpected situations.
Therefore, we set the stop loss in the first defensive zone: 4225-4230.
Next, we set the target price range at 4280-4300-4335.

XAUUSD 1h chart levels for the coming week 24 to 28 November
FOREXCOM:XAUUSD
Hey Everyone,
Please see My updated 1h chart levels and targets for the coming week 24 to 28 November
The price closed on 4065 so If the price BREAKOUT UP this area for will open 4093.
The 4061 & 4067 reversal zone and key decision points; if breached, it becomes the path to 4125.
Weekly close at a 90-degree angle from the peak of 4036
If it breaks through with momentum, it will head towards 4004-3998 as it shown on the chart
The week should move like this
Monday should move to 135° degrees (down to 4036 or up to 4093)
Tuesday 150° degrees (if it moved down we will see 4006 & if up will see 4102) First move 150° and We will see rejection of a Strong price when the (moon & sun & Mercury meet I call it = Test Price Day)
Wednesday 160° degrees ((if it moved down we will see 4004 & if up will see 4125 and then 4157) If the price touches the 180-degree angle, it is heading towards a volatile day followed by a strong rise or fall.
Thursday 170° degrees (the price will move between 4125-4157) and if the price moved down wee will move 225° degrees between 4036-4006) A day approaching the peak or undermost, not a reversal day.
Yousif
H-k-O-r-E

XAUUSD(GOLD): Reaching Our Premium Selling Zone! Get Ready ! Gold is approaching a critical level and we believe this will be a significant move. The $4350-$4400 region has a high volume of sellers, which will be decisive for traders. A price reversal could lead to a substantial decline.
Good luck and trade safe!
Team Setupsfx_
Gold Consolidation overall bullish structureGold where the market has been trading in a period of sideways consolidation after a previous bullish push. Despite the overall bullish structure recent price movement has been relatively weak, indicating that buyers are losing some momentum while investors wait for a clearer direction.
Gold prices edged lower on Thursday, easing from a near two-week high reached in the previous session, as investors assessed the likelihood of a U.S. interest rate cut in December. Despite the slight pullback, the metal remains on track for a fourth consecutive month of gains, supported by expectations of further Federal Reserve rate cuts and ongoing geopolitical tensions.
Overall, this setup reflects a market that is preparing for a breakout, with traders monitoring whether bulls can sustain pressure long enough to overcome the key 4,171 resistance level. A successful breakout could create enough momentum for price to continue climbing toward the marked target zones at 4195 to 4220,
You may find more details in the chart,
Trade wisely best of luck buddies,
Ps; Support with like and comments for better analysis Thanks for Supporting.
