Gold Extends Rally Toward New Highs as Fed Cut Bets IncreaseGold Extends Rally Toward New Highs as Fed Cut Bets Increase
We are following gold from 4030 to the current price and the price has already reached our first major target at 4150.
Currently, gold came out of a strong area near 4130. We can also see that Gold wanted to fall again but stopped near 4110.
After the weaker-than-expected US PPI data, the market is expecting a possible rate cut from the FED meeting in December, thus increasing the chances of gold rising further.
Volume is still low but it may increase during the coming days. Gold appears poised to reach 4,230 and 4,290.
Our analysis did not change because there is nothing to change :)
You may find more details in the chart!
Thank you and Good Luck!
❤️PS: Please support with a like or comment if you find this analysis useful for your trading day❤️
Trade ideas

XAUUSD 4h
as we see on above chart there are two waves one in another, it couldn't broke the Lower low(2) and made a Higher low(4), we are expecting to hit the lower high(3) and if it successfully pass that it will go to the Higher high(1).
Although price broke the dynamic resistance, there are some sellers on lower high (3) area.


possible buy on goldprice has been consolidating around 4160 area,, so i am expecting more push to the higher price previously..

Upward ChannelExpecting to complete wave 5. Watching closely at the very top if will break out or Sell opportunity will be the next move.

GOLD (XAUUSD): Road to ATH
As I predicted earlier, Gold successfully bounced to 4215.
The market closed, testing a key daily resistance.
Next week, I suggest looking for its breakout to buy.
Your confirmation will be a daily candle close above 4245.
With a high probability, the market will rise to a resistance
based on a current ATH.
❤️Please, support my work with like, thank you!❤️
I am part of Trade Nation's Influencer program and receive a monthly fee for using their TradingView charts in my analysis.

Gold Consolidation overall bullish structureGold where the market has been trading in a period of sideways consolidation after a previous bullish push. Despite the overall bullish structure recent price movement has been relatively weak, indicating that buyers are losing some momentum while investors wait for a clearer direction.
Gold prices edged lower on Thursday, easing from a near two-week high reached in the previous session, as investors assessed the likelihood of a U.S. interest rate cut in December. Despite the slight pullback, the metal remains on track for a fourth consecutive month of gains, supported by expectations of further Federal Reserve rate cuts and ongoing geopolitical tensions.
Overall, this setup reflects a market that is preparing for a breakout, with traders monitoring whether bulls can sustain pressure long enough to overcome the key 4,171 resistance level. A successful breakout could create enough momentum for price to continue climbing toward the marked target zones at 4195 to 4220,
You may find more details in the chart,
Trade wisely best of luck buddies,
Ps; Support with like and comments for better analysis Thanks for Supporting.

GOLD ALERT: Sharp and Clean Sell OutlookHello my friends. Without wasting any time, I’m sharing my concise and clear bearish outlook with you.

Hellena | GOLD (4H): LONG to resistance area of 4382(Wave 3).In the past forecast, many have rightly pointed out that wave “4” went behind the high of wave “2” and yet we are not dealing with a diagonal.
This means that the waves have stretched and have a larger range of motion and now the correction in wave “2” is ending.
Essentially the upward movement is still prioritized and I expect two scenarios:
1) Continuation of the upward movement to the resistance area of 4382 (market entry)
2) Reaching the support area 3994.4, after which the correction can be considered complete and only then the movement to the area 4382 will start.
Manage your capital correctly and competently! Only enter trades based on reliable patterns!

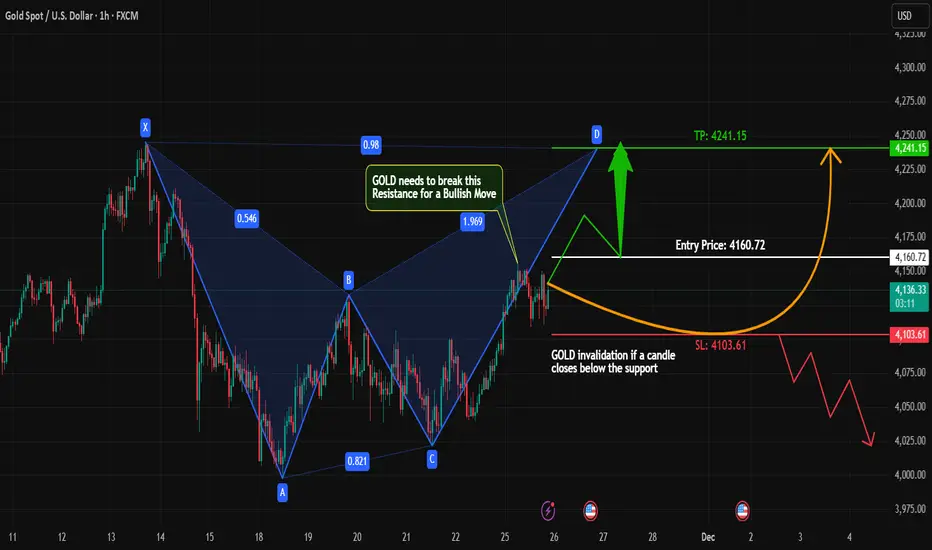
GOLD Long Setup Loading… Watching the Final Harmonic Leg!#Gold has been consolidating sideways on the higher timeframes, but things are getting interesting on the 1H chart. A clean Harmonic Pattern is developing, and the final leg is almost complete.
What I’m Watching:
A breakout above the immediate resistance zone.
Once price breaks and closes above this level, it can trigger a strong upside move as the harmonic pattern completes.
My Trading Plan:
Go long only after a confirmed breakout
Wait for candle close above resistance
Follow strict risk management and avoid early entries
This setup has potential for a solid risk-to-reward if it plays out.
Let me know in the comments if you want the exact levels or chart screenshot!
What do you think—Will Gold break out or reject again?
Like, comment, and follow for live trade updates & more chart ideas!
#GOLD #XAUUSD #HarmonicPatterns #PriceAction #BreakoutTrading
#TechnicalAnalysis #Forex #Commodities #TradingSetup #SwingTrade
#DayTrading #MarketAnalysis #ChartPatterns #TraderCommunity
XAUUSD – LANA PRIORITIZES BUYING ACCORDING TO SWING WAVES AT...XAUUSD – LANA PRIORITIZES BUYING ACCORDING TO SWING WAVES AT THE BEGINNING OF THE WEEK
Fundamental Analysis
The Fed has just announced it will end the QT (quantitative tightening) program from December 1st, accompanied by a target federal interest rate of 3.75–4%.
When the Fed stops QT, the pace of balance sheet reduction slows down, meaning the pressure to withdraw liquidity from the market decreases, which is usually a positive factor for risky assets and gold.
Mechanism:
QE: balance sheet expands, injecting liquidity into the market.
QT: balance sheet contracts, withdrawing liquidity.
The temporary halt of QT leads the market to expect the Fed is being softer with monetary policy, thereby supporting the medium-term upward trend of gold.
In this context, Lana perceives that gold at the beginning of the week still has room to rise, but there will be fluctuations around important liquidity zones.
Technical Analysis
On the H4 chart, the price structure is following an upward Elliott wave, with clear waves (1)–(2)–(3)–(4)–(5). The current upward wave has not yet shown a major reversal signal.
The Swing zone 4190–4195 below is the nearest important bottom, acting as the main short-term support. This is also where Lana prioritizes watching for swing wave buying.
Above, two notable Liquidity zones:
4250–4260: near liquidity zone, potential for fake break/adjustment.
4365–4370: further liquidity zone, coinciding with the old peak, likely a strong profit-taking area if the price continues to expand the upward wave.
Lana's preferred scenario: gold may slightly adjust to the swing zone 4190–4195, then continue to expand the wave to test the upper liquidity zones in turn. However, right at the Liquidity zone, the market is very prone to stop sweeps, fake breaks, so Lana does not encourage chasing Buy at these zones.
Price Zones to Watch
Main Support (Swing & Buy Zone): 4190 – 4195
Resistance / Liquidity Zones: 4250 – 4260
4365 – 4370
Trading Scenario
Buy 4190 – 4195
SL: 4185
TP: 4250 – 4260 – 4365 – 4370

Gold (XAUUSD) 4H Key Levels & Strategy🔥 Strong Buy Zone: 4385 ➜ Targets 🎯 4500, 5000
❗ If 4385 fails to break → 🔻 Sell toward 4200, 4000
🟢 Buy Zone: Break above 4261 ➜ Targets 🎯 4300, 4350
🟩 Buy Opportunity: Break above 4221 ➜ Targets 🎯 4248, 4260
🔴 Strong Sell: Break below 4180 ➜ Targets 🎯 4150, 4100
⚠️ Major Breakdown Level:
Strong Sell below 4100 ➜ Targets 🎯 4000, 3900
📊 Trend Status:
Market approaching critical resistance zones. Watch for breakout confirmation above 4221 & 4261 for bullish continuation. Rejection can push price back toward 4180 & 4100 levels.
💡 Trading Tip: Always wait for candle close confirmation on 30 M to avoid fakeouts.
🚀 Smart Levels • 📉 Clean Structure • 🔮 Future-Focused Trading
⚠️ NOTICE
This analysis is for educational purposes only. 📚
Not financial advice. 💼
Always do your own research and trade at your own risk. ⚠️
Market conditions can change rapidly — use proper risk management. 🛡️

Unfortunately, gold is about to fall.Hello Traders! 👋
What are your thoughts on GOLD?
Gold corrected upward as expected, reaching the top of the descending channel and the resistance zone, where it showed a clear price rejection.
In this region, gold is expected to show some consolidation and liquidity buildup, followed by a renewed bearish move toward the lower marked levels.
Political and geopolitical developments — especially talks and the possibility of a peace agreement between Ukraine and Russia — may accelerate this bearish movement.
As long as price fails to break above the resistance zone and the channel top, the short-term outlook remains bearish, and any upward correction should be viewed only as a pullback.
Don’t forget to like and share your thoughts in the comments! ❤️

Gold Trend AnalysisGold continues to maintain a robust upward structure, with higher highs and higher lows. The recent break above the 4,200 USD level further confirms the bullish trend, indicating that buyers are still firmly controlling the market rhythm. Notably, a series of FVGs (Fair Value Gaps) appear consistently below, showing that proactive buying is absorbing most corrective moves.
1. Technical perspective: Uptrend remains dominant
Gold formed a higher low around 4,120 – 4,140 and broke through the 4,200 barrier, which had held for nearly 10 days. FVGs at 4,165, 4,120 – 4,135, and 4,080 – 4,100 serve as potential retracement zones where the market may revisit to regain bullish momentum. Volume Profile also shows heavy activity around 4,150 – 4,170, suggesting a pause before the next leg upward.
2. Forecast for gold’s next move
The bullish structure remains clear. Therefore, a mild pullback before further ascent is the dominant scenario. From the 4,215 zone, gold may retreat to 4,180 – 4,165 to form a base, then rally towards 4,240 – 4,260. If buying remains strong, further targets could reach 4,300 – 4,320.
An immediate surge is also possible, particularly if the USD weakens or macro news supports it. In such a case, gold could push directly to 4,240 – 4,250, though this type of rally is usually prone to quick profit-taking.
3. News perspective: The market supporting gold
At the US close, gold eased slightly to 4,159 USD/oz—a healthy cooling after a strong rally. Meanwhile, Morgan Stanley continues to target 4,500 USD in 2026, supported by the strongest ETF inflows since 2020, net purchases from central banks, and expectations of lower interest rates—all reinforcing the long-term uptrend.
However, short-term risks remain, such as rising real rates or a USD rebound. These could create pressure, but overall, the trend still favours buyers.

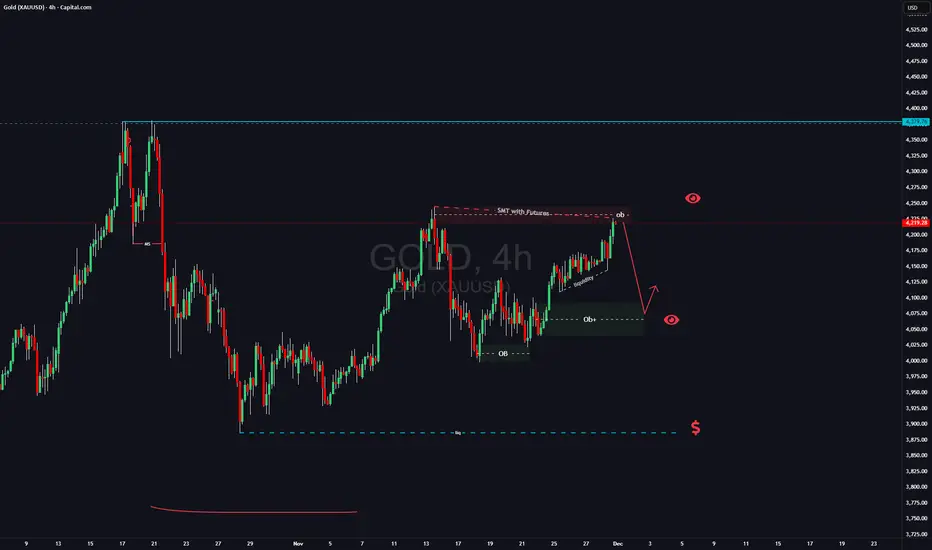
GOLD SETUP: The Liquidity Grab That Could Change Your Month!There is intresting situation on Gold right now:
1) There is SMT with futures(on futures price went higher than previous high from November 13th
2) Have a lot of liqudiity down below which usually means that this liqudiity will be taken
3) strong uptrend on LTF
taking in consideration these factors and that it will be beginign of the month on Monday i will be looking for manipulation at market opening. If i see trend shift on LTF i will be looking for short position till 4110 area (4h OB) , if this wont happen i simply gonna skiip trading GOLD this week.
When price action is not clean and when its hard to see clear picture better to avoid such trade and just watch.
Like and follow if you like my analysis
Buyers’ Interest Zone (Neutral View)“Price is pulling back into a demand area. I’m watching how the market responds within this zone.”

XAUUSD / GOLDGold retesting a strong support zone after breaking out of a downward trendline. This support area separates the market into two zones:
Buy Side Area: If price holds above the support and breaks back above the trendline, buyers may push price toward the 1st target near 4,251 and the 2nd target around 4,300.
Sell Side Area: If price fails to hold this support, it may drop back into the lower zone around 4,165 or further.
Overall, the structure suggests that gold is preparing for a potential bullish reversal, but confirmation comes only if price breaks upward from the support and buy zone
If you find it helpful please like and comments for this post and share thanks.

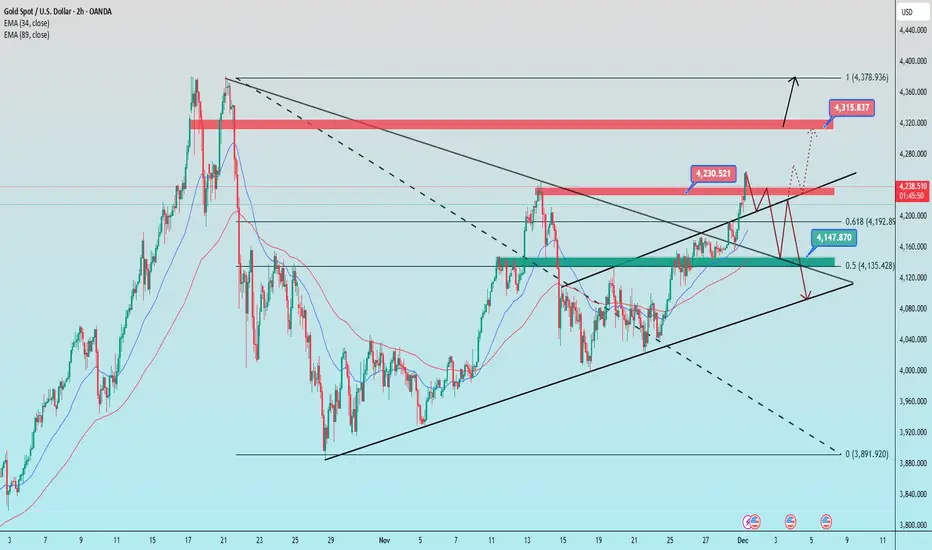
How did gold move in the first week of December? CONCISE & COMPREHENSIVE TECHNICAL ANALYSIS
1. Trend Lines
Ascending trend line (lower black line)
This is the main dynamic support of the current uptrend structure.
The price has bounced off this trend line several times → the short-term trend remains bullish as long as this line is not broken.
Major descending trend line (upper black line)
This is strong dynamic resistance on larger time frames, and the price recently touched this area.
This is an area where selling pressure frequently arises.
2. Support – Resistance
Resistance
4,243–4,245 (red zone):
This is the confluence of the previous peak and the descending trend line → selling pressure appears right in this area.
4,315–4,320 (next major resistance):
If this area is broken, the price will likely head towards 4,375–4,380.
Support
4.147–4.150 (green zone confluence):
Confluence of moving averages, the nearest swing low, and Fibonacci levels → important support that maintains the bullish structure.
4.105–4.120 (lower trendline):
If the price breaks through this area → the short-term trend has the potential to turn bearish.
3. Fibonacci
Fibonacci 0.618 = 4.194
→ Area with a high probability of a rebound if the price corrects.
Fibonacci 0.5 = 4.135
→ Confluence with strong support + trendline → potential buy zone if a deeper pullback occurs.
4. Price Scenarios
Scenario 1 – Continue Upward (Priority)
If the price remains above 4,200–4,215, there is potential for a retest:
➡️ 4,230 → 4,315 → 4,375
Scenario 2 – Downward Correction
If the price breaks through 4,190 and breaks through the green zone of 4,144–4,150, then:
➡️ Risk of a downward movement towards the 4,105–4,120 trend line
📌 Trading Plan
BUY GOLD: 4,148 – 4,250
Stop Loss: 4,138
Take Profit: 100–300–500 pips
SELL GOLD: 4,313 – 4,315
Stop Loss: 4,325
Take Profit: 100–300–500 pip
XAUUSD: Buys (30m)R:R = 1.72:1
30M Resistance broken with decent room til the next ceiling. We’re in buys. This is not financial advice.

XAUUSD 1H — Bullish Structure Holding | Retest Setup ActiveGold has moved out of a range market and built momentum toward premium pricing. After a liquidity grab and correction, the market is now retesting the breakout structure. If the retest holds, this will likely serve as the continuation point toward the next liquidity target at 4378.
Key Scenarios
✅ Bullish Case 🚀
If price retests 4156–4175 and holds with bullish reaction:
🎯 Target 1: 4255
🎯 Target 2: 4378 (major liquidity sweep)
❌ Bearish Case 📉
A sustained break and close below 4107 may shift momentum and open deeper corrective downside.
Current Levels to Watch
Support / Retest Zone: 4156–4175
Secondary Support: 4107
Liquidity Target: 4378
⚠️ Disclaimer: This analysis is for educational purposes only. Not financial advice OANDA:XAUUSD OANDA:XAUUSD

A POSSIBLE TREND SHIFT A sell at 4185-90, sl at 4203 , a low probability sell until we close below 4170 today

GOLD ANALYSIS 12/02/20251. Fundamental Analysis:
a) Economy:
• USD:
The USD is seeing a mild rebound after a strong decline, mainly technical in nature, with no sufficiently strong data to reverse the trend. This only creates short-term pressure on gold.
• U.S. Stock Market:
U.S. markets are mixed due to concerns over slowing corporate earnings. This cautious sentiment is shifting capital flows toward gold.
• Federal Reserve (FED):
The FED maintains a dovish stance, prioritizing economic stability and considering rate cuts. This continues to support gold.
• Trump Administration:
The Trump administration is taking a tougher stance toward several countries, increasing geopolitical uncertainty and boosting safe-haven demand.
• Gold ETF – SPDR:
SPDR has been buying strongly for two consecutive sessions, reinforcing the medium-term uptrend for gold — a highly important factor.
b) Politics:
Multiple geopolitical hotspots occurring simultaneously:
• Ongoing Middle East conflict
• Intensifying strategic competition in Asia
• Russia–Ukraine tensions unresolved
• Venezuela–U.S. relations becoming a new focal point as the Trump administration takes a tougher stance
→ Overall: Risk-off sentiment rises sharply, benefiting gold.
c) Market Sentiment:
Safe-haven sentiment continues to dominate. Investors are reducing risk, pulling out of equities, and pouring into gold — especially with strong SPDR inflows. Asia is also entering its seasonal year-end gold-buying cycle.
2. Technical Analysis:
• Gold has broken out of a major wedge pattern and is currently retesting the breakout area.
• Price is trading above short-term moving averages, showing a clear bullish trend.
• The market is expected to retest the 4186–4190 zone before pushing higher again.
• Next target zones: 4274 → 4320 → 4380.
• M15 RSI is slightly oversold → suitable for a technical bounce.
RESISTANCE: 4,274 – 4,320 – 4,380
SUPPORT: 4,186 – 4,146 – 4,095
3. Previous Market Session (01/12/25):
• Gold maintained its primary uptrend, with only mild corrections that did not break structure.
• SPDR continued buying → confirms real demand.
• USD’s slight rebound did not significantly affect the overall bullish momentum.
• Gold dropped to the opening price at 4,217 and then surged back up to 4,264.
4. Trading Strategy for Today (02/12/25):
🪙 SELL XAUUSD | 4241 – 4239
SL: 4245
TP1: 4233
TP2: 4227
🪙 BUY XAUUSD | 4178 – 4180
SL: 4174
TP1: 4186
TP2: 4192

XAUUSD – Possible Ending Diagonal Completing Wave (5)Gold appears to be forming a classic Ending Diagonal structure for the final Wave (5). Price action is compressing inside a narrowing wedge, with each push up showing clear loss of momentum — typical behavior for a terminal wave.
🔍 Structure Breakdown
Wave (3) is confirmed.
Wave (4) retracement respected the lower structure.
Current price action is unfolding inside a rising wedge, matching all characteristics of an Ending Diagonal:
Overlapping waves
Converging trendlines
Weakening momentum on each new high
Waves (A)(B)(C)(D)(E) of the internal wedge are completed.
🔻 Bearish Implication
If this diagonal is valid, Wave (5) is likely in its final stage.
A break below the lower wedge trendline would confirm the reversal and open the road toward the next major support — the base trendline of the larger channel.
This would signal the beginning of a sharp corrective move, as Ending Diagonals usually unwind aggressively.
📉 What I’m Watching
Breakdown of the wedge = confirmation
Volume/momentum expansion on the break
