GOLD Consolidation bullish run momenmtumGold moved into consolidation after a bullish run. The metal pulled back to $4110/oz on Tuesday as investors booked profits following Monday’s six-week high. The market is now focused on U.S. interest rate expectations, with growing anticipation of a rate cut next week. Traders are also awaiting remarks from Federal Reserve Chair Jerome Powell later today for additional guidance on the Fed’s rate trajectory.
Price retested the 4205 zone and rebounded, indicating a healthy pullback within the uptrend If bulls successfully hold the 4210 support range, upward momentum could strengthen quickly On the upside, the next major resistance levels to watch are 4260 and 4300.
You may find more details in the chart.
Trade wisely best of luck buddies.
Ps; Support with like and comments for better analysis thanks for supporting.
Trade ideas
Elite | XAU/USD – Institutional Buy Zone Retest + Liquidity Run OANDA:XAUUSD
Gold continues to respect the rising trend support, generating repeated support bounces along the diagonal structure. Price recently swept sell-side liquidity inside the institutional buy zone (4182–4196) and reacted bullishly, showing willingness to target upside imbalance.
Bullish Scenario – Preferred Outlook
If price holds above the entry zone at 4208–4215:
🎯 Target 1 → 4244 – 4248
🎯 Target 2 → 4256 – 4260 liquidity zone
A break above Buy-Side Liquidity opens the way for continuation into the imbalance above.
Bearish Invalidations
Break below 4182 removes bullish strength and may shift price back toward discounted levels.
⚠️ This analysis is for educational purposes only — not financial advice.

XAUUSD–Volume Profile buy scenario around 4,200, target 4,265+XAUUSD–Volume Profile buy scenario around 4,200, target 4,265+
Brian – Prioritize buying with the trend, use VAL to position entry
Market snapshot
At the end of the US session yesterday, gold had a strong increase and then stabilized, currently moving sideways around 4,216 on H1.
The structure is still an uptrend, the current decline is mainly a technical correction within the value area.
On the chart, the 4,264–4,265 area is marked as important resistance, where if broken, the medium-term uptrend could be unleashed more strongly.
Volume Profile & key price areas
The VAL (Value Area Low) of the Volume Profile is currently around 4,200 – this is an area where the market has previously accepted a large volume of trades, suitable for trend-following buys.
A deeper support area is around 4,164 (Supportsides on the chart), where buyers have previously intervened very clearly.
Above: 4,265 – confirmed resistance, if broken will strengthen the scenario of gold heading to higher price areas, matching the "super cycle 5,000 USD" story in the long term.
Trading plan for next week (according to H1 & Volume Profile)
Priority scenario – Buy at VAL with the trend
Buying area: around 4,200 (VAL of Volume Profile).
Can flexibly range 4,198–4,203 depending on spread and market conditions.
Idea: wait for the price to pull back to the VAL area, observe H1 candle reactions (long lower tail, rejection candles...) before entering the order.
Immediate targets:
TP1: area 4,240–4,245
TP2: 4,265 – important resistance marked as "important resistance, confirming medium term increase".
If the price closes clearly above 4,265 and successfully retests, consider holding part of the position or finding additional entry points, according to the scenario of expanding to higher areas in the new cycle.
Defensive scenario – Deep support
If the 4,200 area does not hold, the 4,164 area will be the next support to watch.
Closing H1/D1 below 4,164 will be a signal to reduce short-term expectations and wait for a new structure instead of trying to "buy every dip".
Fundamental context – Reasons gold is still supported
Gold is heading for its best growth year since 1979, with an increase of over 60% in 2025 – this is the context of a true bull market, not just a recovery wave.
YTD performance of XAU outperforms BTC, showing that large capital flows prioritize stability and gold's safe haven role.
Current supporting factors: US bond yields cooling, USD weakening.
Geopolitical tensions escalating, Russia–US negotiations have not brought clear breakthroughs.
The market prices in nearly a 90% chance of the Fed cutting rates at the next meeting, making non-yielding assets like gold more attractive.
Follow Brian to share the Gold scenario together

Gold (XAU/USD) Analysis – 15m ChartPrice continues to respect the ascending channel structure with multiple confirmations. After a strong reaction from the lower trendline, we are now looking for potential continuation toward the upper boundary.
Scenario: If the channel holds, price may aim for the mid-range and possibly retest the recent highs.
Key Levels:
Resistance: 4,220
Support: 4,195
Invalidation Zone: 4,175
This is a technical observation based on trend structure and price action. Not financial advice.
DISCLAIMER : THIS IS JUST FOR EDUCATIONAL PURPOSE I AM NOT A FINANCIAL ADVISOR

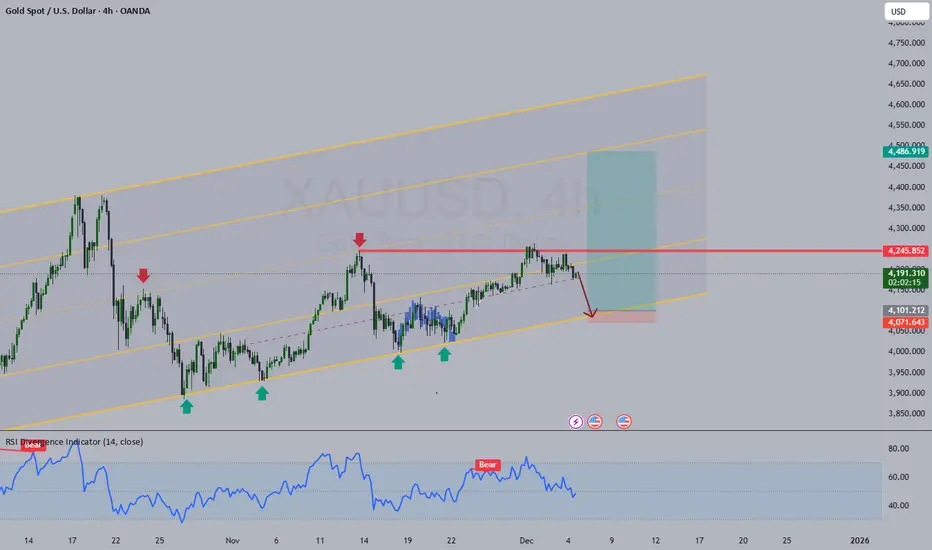
I am bullish on GOLD but still need small correction Gold has tested its previous peak but failed to make a higher high, and has now moved back into its mid-term range. I’m planning to wait for a retest of around 4100, which is the lower boundary of the uptrend, before opening a swing long position.
XAU/USD | A free fall or an bullish attempt? (READ THE CAPTION!)As you can see, Gold has been moving on a range recently, with no clear intention as to where it is headed. A possible scenario could be dropping down to the 4164 NDOG and then an uptrend move above the pool of liquidity above 4265 and the 4272 FVG.
However if it fails to make a move at that level, it'll drop further to 4111-4159 IFVG, which then I expect it to bounce back and go up again. However, if it fails to make a move then, we will witness a free fall of Gold.
Let's see what happens.

XAUUSD – Price Action OutlookPrice is hovering around a major resistance area, and the recent candles suggest hesitation from buyers. A clear rejection from this zone may invite selling pressure, while a strong breakout and sustain above it can open the door for further upside.
At this stage, it’s important to wait for confirmation rather than anticipate the move. Gold often gives false breakouts around key levels, so disciplined risk management is essential. Let the price action decide the next direction.

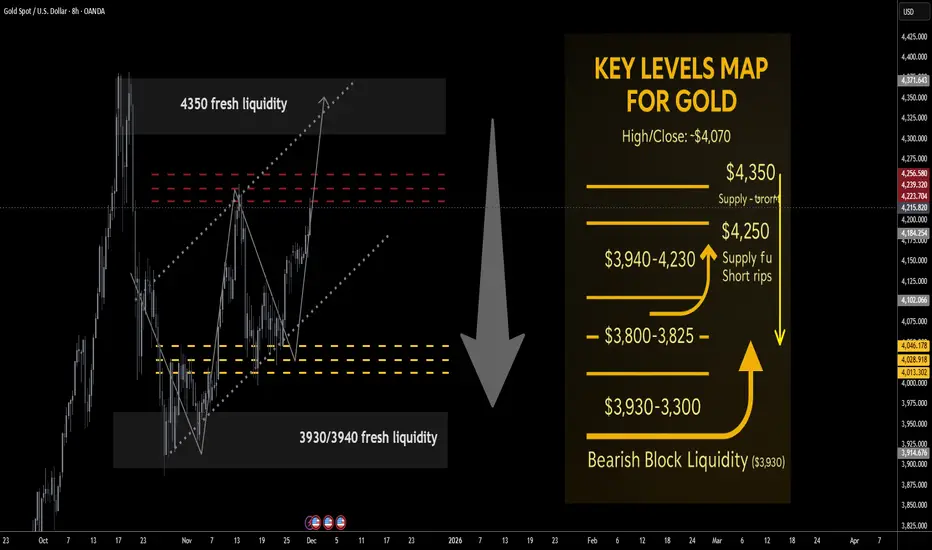
Gold next week Key S/R Levels and Outlook for Traders🔥 GOLD WEEKLY SNAPSHOT — BY PROJECTSYNDICATE
🏆 Swing High / Swing low:
$4,350 → ~$3,930 — clean rejection from the $4,350 bear-liquidity pocket, weekly close back inside prior range and below $4.1k.
📈 Trend:
Structural uptrend still intact above ~$3,900, but near-term momentum has flipped distributive: rallies into $4,250–$4,350 look like supply, not fresh markup. Upside is seen as asymmetric to the downside from overhead resistance.
🛡 Supports:
• $4,060–$4,020: first demand / reaction band below the close.
• $4,000–$3,960: psychological shelf; first downside target on failed rallies.
• $3,940–$3,930: bullish block liquidity — key structural demand; loss of this area risks a deeper de-leveraging leg.
🚧 Resistances:
• $4,200–$4,230: immediate supply from the weekly close; first “sell-the-rip” area.
• $4,250–$4,280: primary bearish liquidity / core short zone.
• $4,300–$4,350: exhaustion band; $4,350 = recent swing high / bear block.
• Stretch: $4,380 prior spike; only expected on an overshoot / stop run.
🧭 Bias Next Week:
Fade strength rather than chase upside.
Base idea: short rips into $4,220–$4,320, scale adds toward $4,350, looking for reversal back into $4,060 → $4,000–$3,960.
• A weekly close above $4,380 would invalidate the short-the-rip bias and open room toward the higher Street targets.
________________________________________
🔝 Key Resistance Zones Short-Side Focus
• $4,200–$4,230: first supply from the weekly close; good area for initial probe shorts.
• $4,250–$4,280: primary bearish liquidity / main take-profit area for trapped late longs.
• $4,300–$4,350: extension / exhaustion band; includes the $4,350 swing high and core “blow-off” liquidity pocket.
• $4,380: prior spike high / stretched stop-run; only expect in a squeeze.
________________________________________
🛡 Support Zones Downside Objectives / Where Shorts Start Covering
• $4,060–$4,020: first reaction band below; scale out partial profits here.
• $4,000–$3,960: key psychological shelf; second profit zone and likely area of responsive dip-buyers.
• $3,940–$3,930: bullish block liquidity; final target for aggressive shorts, and the spot where higher-timeframe bulls are expected to defend. A sustained break below would be a regime change.
________________________________________
⚖️ Base Case Scenario
• Rallies into $4,220–$4,320 encounter selling as late longs de-risk and fresh shorts engage.
• Price fails to sustain above $4,300–$4,350, leaving a wick / rejection on the higher timeframes.
• From there, rotation lower toward $4,060, then $4,000–$3,960 as the primary downside objective.
• Only if the $3,960–$3,930 block cracks cleanly do we start talking about a deeper flush into $3,880–$3,850 as a secondary scenario.
________________________________________
🚀 Breakout / Invalidation Trigger
• Bearish framework invalidation:
o A strong daily/weekly acceptance > $4,380 would suggest bears are trapped and open the door toward $4,450+, in line with the newly raised Street forecasts.
o In that case, shift from short-the-rip to neutral / buy shallow pullbacks until a new top structure forms.
________________________________________
💡 Market Drivers to Watch This Week
• Fed communication and front-end real yields – any hawkish surprise or delay in cuts could extend the correction; dovish surprise risks another squeeze.
• USD index swings around data / politics – sharp dollar bounces favour your short bias from resistance.
• Central-bank headlines (reserve diversification, sanction risk) – supportive in the background but less impactful intraday; use them as context, not trade triggers.
• Geopolitical flare-ups – can create squeezes into your sell zones; be ready for fast spikes into $4,300–$4,350 rather than waiting for slow grinds.
________________________________________
🔓 Bull / Bear Trigger Lines
• Structural bull line:
• Above $3,930–$4,000: long-term bull structure intact; even if you’re tactically shorting rips, treat deep flushes into this band with respect — this is where bigger players are likely accumulating.
• Bear expansion line:
• Below $3,930: opens scope for a faster liquidation wave toward $3,880–$3,850; would indicate that the 2025 blow-off is transitioning toward a broader consolidation or mean-reversion phase.
________________________________________
🧭 Strategy
Use overhead resistance as a place to sell strength, not initiate fresh longs. Expect limited upside and a reversal from liquidity above the market.
1️⃣ Primary Short Setup – Fade the Rips
• Entry zones:
o First scale: $4,220–$4,250
o Add / build: $4,250–$4,280 (primary bear-liquidity block)
o Final add / exhaustion: $4,300–$4,350 (only if tape shows blow-off / stop-run behaviour).
• Stops / invalidation:
o Tactical: hard stop above $4,380.
o More conservative traders can run a soft line at $4,350 and hard stop just beyond $4,380.
• Targets:
o TP1: $4,060–$4,020
o TP2: $4,000–$3,960
o Stretch TP3 (runner): $3,940–$3,930 bullish block.
________________________________________
🌍 Macro Tailwinds
• • Policy / Real Yields
Markets are leaning into lower US real rates and more cuts through 2026, with talk of “fiscal dominance” and persistent deficits. This keeps the medium-term backdrop supportive for gold even after the parabolic run.
• • FX / USD Dynamics
A softer, more volatile dollar driven by rate-cut expectations and concerns over US fiscal sustainability continues to underpin gold on dips, even if short-term dollar squeezes can trigger sharp pullbacks.
• • Flows: Central Banks Still the Backbone
Central banks remain heavy net buyers, with H1 and Q3 data showing robust additions and EM reserve managers diversifying away from sanction-risk USD assets. Recent commentary links record highs to this central-bank bid plus tight physical markets.
• • Flows: ETF & Investor Participation
After several years of outflows, ETF demand has turned back to net inflows, adding to central-bank buying and reinforcing the idea of a higher structural floor in the ~$3.9k area even after corrections.
• • Geopolitics & Safe-Haven Premium
Gold’s 2025 surge is still anchored in elevated geopolitical risk (Russia–NATO tensions, US–China frictions, tariff headlines), plus anxiety about frozen reserves and sanctions. This keeps the safety bid sticky even when positioning looks crowded.
• ________________________________________
Gold - This is the bullrun top!⚰️Gold ( OANDA:XAUUSD ) is slowly reversing now:
🔎Analysis summary:
Starting back in the end of 2015, Gold established another major bullish cycle. Ever since the rounding bottom breakout, Gold has been rallying higher and higher. But at this exact moment, Gold retests major resistance and is slowly starting to create a reversal.
📝Levels to watch:
$4,000
SwingTraderPhil
SwingTrading.Simplified. | Investing.Simplified. | #LONGTERMVISION

XAUUSD 4H MA50 break signals lower prices.Gold (XAUUSD) has been trading within a Channel Up in the past 1.5 month. Within this pattern, every time the 4H MA50 (blue trend-line) broke downwards, the price tested the Higher Lows trend-line.
As a result, we expect Gold to reach 4115 next, which will be an interesting cluster as marginally below will be the Support Zone o the 4H MA200 (orange trend-line) and more importantly the 1D MA50 (red trend-line). That will most likely decide the long-term trend.
---
** Please LIKE 👍, FOLLOW ✅, SHARE 🙌 and COMMENT ✍ if you enjoy this idea! Also share your ideas and charts in the comments section below! This is best way to keep it relevant, support us, keep the content here free and allow the idea to reach as many people as possible. **
---
💸💸💸💸💸💸
👇 👇 👇 👇 👇 👇

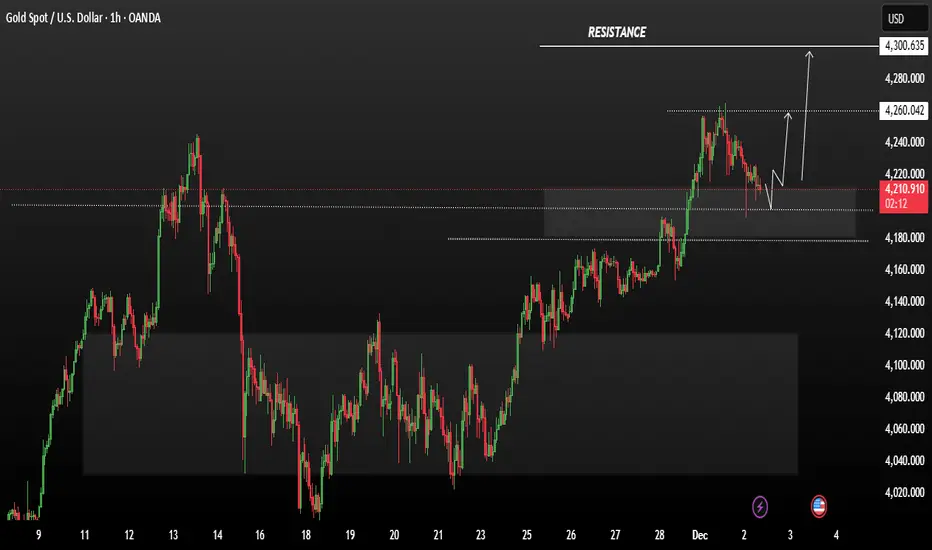
XAU/USD – Technical Outlook (1H Chart)The chart shows gold consolidating within a clearly defined support zone after pulling back from recent intraday highs. Price has reacted multiple times to this support area, indicating that buyers are still active around the lower boundary.
A short-term bullish reaction is anticipated if the support continues to hold. The projection shows a potential recovery toward the first target near 4219, which aligns with a previous structure level acting as minor resistance.
Above that, a broader resistance zone sits higher on the chart, marked as the final target. This zone coincides with prior swing highs, making it a key area where momentum may slow or reverse if reached.
Key Notes:
Support Zone: Area where buyers have previously stepped in.
Mid-level / 1st Target: 4219 region, aligning with structural resistance.
Major Resistance / Final Target: Upper grey zone highlighted on the chart.
Bias remains neutral-to-bullish as long as the support zone continues to hold.
This analysis focuses on market structure and observable levels—not financial advice, just a technical interpretation of current price action.

Gold: Narrow-Range Oscillation TodayGold is trading in a narrow-range oscillation overall with intense bull-bear confrontation. Influenced by a combination of fundamental and technical factors, the market is in a short-term consolidation phase, awaiting a clear directional breakout. Despite extremely stable intraday performance (volatility less than 0.3%), the backdrop features a high-stakes game with open interest surging to 450,000 contracts. Primarily, amid anticipation of the Fed’s policy announcement, market sentiment remains cautious, making a one-sided trend unlikely.
The Bollinger Bands are showing signs of contraction, and the moving average system is converging, this pattern further confirms gold’s current consolidation state.
Key support and resistance levels are clearly defined:
Intraday Short-term Resistance: $4,225 – $4,230, a critical suppression level for short-term price action.
Strong Resistance: $4,250 – $4,260, a zone that has repelled multiple breakout attempts, accumulating significant profit-taking sell orders.
Intraday Short-term Support: $4,190 – $4,200.
Strong Support: Around $4,175 – $4,180 that is a crucial watershed for bull-bear dynamics.
Trading Strategy:
Buy 4195 - 4205
SL 4180
TP 4225 - 4235 - 4245
Sell 4235 - 4225
SL 4245
TP 4210 - 4200 - 4190

Gold Stalls as Markets Brace for the FedGold is entering a sensitive phase as both news and technicals show the market temporarily hitting the brakes ahead of the Fed’s signal. On the macro side, the delayed release of October–November PPI data to January 2026 adds another layer of uncertainty around inflation. With a lack of critical numbers, investors typically reduce risk exposure, causing safe-haven demand for gold to cool off. At the same time, this week’s Fed meeting is creating notable psychological pressure. Many traders fear Powell may adopt a firmer tone or signal that it is “too early to ease,” which could dampen rate-cut expectations. In this environment, the DXY has inched higher and the 10-year yield is holding near 4.15%, both acting as headwinds for gold.
On the chart, after failing to retest 4,220 USD/oz successfully, gold slipped back toward 4,180–4,190 and is showing visible hesitation. The 4,210–4,220 area remains a short-term ceiling, with repeated upper-wick rejections signaling ongoing profit-taking pressure. To the downside, price is still holding above the Ichimoku cloud and the 4,170–4,180 equilibrium zone, but if this area breaks, the risk of a deeper move toward 4,140–4,150 increases significantly.

4250–4180: The Box Controlling GoldDespite a week filled with major fundamental releases, gold spent the entire period trapped inside a 4250–4180 range.
Even Friday’s strong early rally into 4250 failed to hold, with the daily close producing a sharp sell-off that left traders without a clear directional bias.
Today’s Asian session opened with renewed buying interest, lifting price back toward 4220, the midpoint of the range. But without a decisive breakout, the medium-term direction remains unclear.
Technically, both the medium-term and long-term trends are still bullish. However, as long as price remains locked inside this range, taking trades carries elevated risk.
What I want to see next:
Bullish scenario:
A fresh attempt to break above resistance, followed by either a clean breakout or a tight consolidation right below it — a classic pressure-building structure.
Bearish scenario:
A breakdown below 4175–4180, which could open the door for a move back toward 4100 or even lower.
Until we get clarity, I remain on the sidelines.
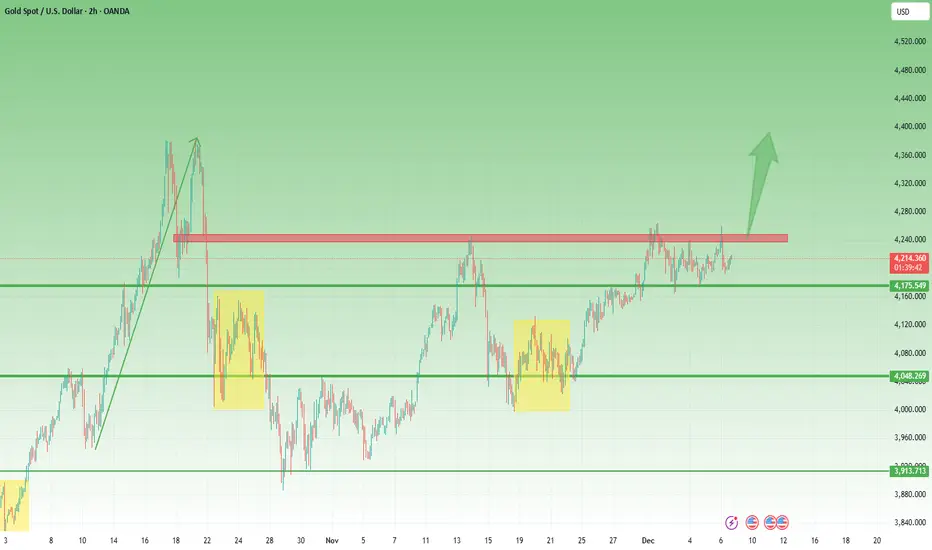
Gold Weekly Trend: XAU/USD Ready to SurgeGold Weekly Trend: XAU/USD Ready to Surge
Gold closes the week with a steady bullish profile, maintaining a structure that reflects strong positioning from larger market participants. The weekly flow shows a market that continues to rotate upward through liquidity pockets while holding firm during corrective phases.
This week’s behavior indicates that buyers remain active on every controlled retracement, keeping the overall structure balanced and directional. The price continues to move in a sequence of expansion → stabilisation → renewed expansion, which is a common pattern when the market is preparing for sustained upside development.
Underlying order flow suggests that Gold is still within a broad accumulation cycle at higher levels, where the market repeatedly absorbs sell-side attempts and transitions back into bullish pressure. The consistency of this pattern signals confidence from long-term participants and reduces the probability of a structural shift at this stage.
As the week closes, the overall environment remains favorable for continued appreciation. Price is advancing in a measured, orderly fashion rather than showing signs of exhaustion. This steady progression typically precedes multi-week continuation phases, especially when liquidity objectives remain active above current trading levels.

Gold Weekly Analysis – Dec 8Hi guys
🔶 Gold Weekly Analysis – Dec 8 (H4)
📈 Overall bias: Bullish
🔸 Resistance 1: 4237.5
If we see a CHOCH + break of structure, I’ll look for a sell setup.
🔸 Resistance 2: 4317.4
If price breaks above the first zone, this is the next major level to watch.
🔹 Support: 4100.4
If price pulls back to this zone and gives a CHOCH confirmation, it can be a great buy setup.

THE KOG REPORT - UpdateEnd of day update from us here at KOG:
Not a bad start to the week with price following our path and red boxes to pave it's way into our target levels as well as giving buyers opportunity to get that long trade into the immediate EXC target which is now complete.
Now, with FOMC tomorrow we would expect this to want to hover around here and attempt the lower support levels which stand at 4002 and below the 4195. 4190 is the key level and price needs to stay above that to continue higher. A break below will confirm the move for us.
For us, the plan is working so we'll stick with it.
As always, trade safe.
KOG

Gold Market Outlook: From Friday’s Volatility to Weekly Strategy
Last Friday was a textbook example of why I prefer to close positions early during the New York session. Everything followed my plan until mid-NY, when price broke the previous high but quickly pulled back to the 4,200 psychological benchmark. This was clear profit-taking ahead of the weekend, a common pattern that reinforces disciplined risk management on Fridays.
The monthly chart tells a compelling story. After breaking a multi-year neutral rectangle, gold entered a strong bullish cycle starting March 2024.
Key observations:
First bull run: 7 months, +28.7% gain → followed by 2-month consolidation.
Second bull run: 2 months, +25% gain → followed by 3-month consolidation.
Third bull run: +25% gain → now in third consolidation zone, likely before an attack on a new historical high.
This cyclical pattern suggests that the current consolidation is a launchpad for the next breakout, with mid-term targets at 4,300 and 4,380, and potential for new all-time highs if m
momentum persists.
On the 4H chart, price remains inside the neutral zone of an ascending channel:
Strong support: 4,192
A break below this level opens the path to the channel’s higher low at 4,164.
More likely scenario: Bullish engagement above 4,220 zone, aiming for a retest of the previous month high (4,246).
This week is packed with catalysts:
Wednesday: Federal Reserve interest rate decision – a critical event that could define gold’s next major move.
Labor market data: Strong U.S. numbers may trigger short-term pullbacks, while weaker data will reinforce bullish sentiment.
Geopolitical tensions and rate-cut expectations continue to provide structural support for gold.

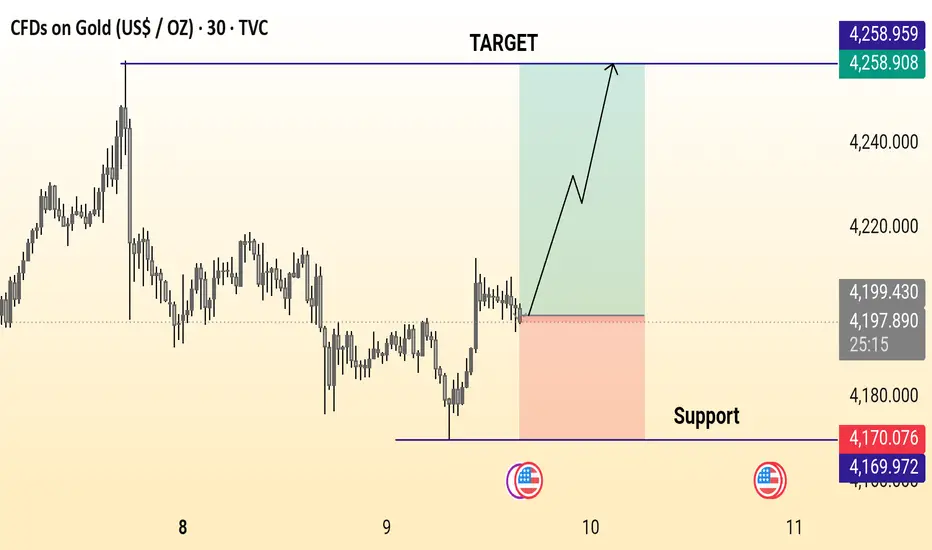
Gold bullish breakout setupGold (30-min) shows a bullish setup, bouncing from support near 4170 and aiming for an upside target around 4259 if price holds above the breakout zone.
Gold Buyers Lose Momentum as Correction Risks IncreaseHello everyone,
On the H4 timeframe, gold continues to face heavy resistance as it approaches the 4,225–4,235 USD zone — an area that has repeatedly formed bearish FVGs and concentrated liquidity at the highs, causing every bullish attempt to be rejected. The latest strong bearish candle pushed the price below the equilibrium zone and dragged gold back toward 4,200 USD, clearly reflecting a more cautious market sentiment as buyers fail to maintain previous momentum.
From a structural perspective, gold is moving within a weakening sideways phase, consistently forming lower highs around 4,230–4,235 USD. This signals that buyers have lost their advantage, while larger players appear to be distributing positions at resistance. Although the price still trades above the Ichimoku cloud edge, consecutive candle closes below the equilibrium line are creating visible corrective pressure. This pattern is typical before gold attempts a deeper downward move to sweep liquidity beneath current levels.
The Volume Profile further reinforces this view. The dense trading range observed between 11–19 November has established a strong supply zone at 4,220–4,235 USD. Every time the price retests this area, immediate selling pressure emerges, showing sellers are defending the zone effectively while buyers lack the strength to break through. The combination of weakening structure, resistance FVGs, and a significant supply cluster continues to elevate the short-term correction risk for gold.

GOLD WEEKLY CHART MID/LONG TERM ROUTE MAPHey everyone,
Please see our weekly chart timeframe Routemap and Trading plans for the week ahead.
After securing 4059 last week, we now have a long range candle body close gap above at 4294, with 4059 acting as support. We can expect price action to play between these two levels. A further EMA5 cross and lock above 4059 will strengthen the gap toward 4294. Conversely, a candle body close back below 4059 would reopen the broader retracement range.
We’ll keep these long timeframe structures in mind as we continue with our plan to buy dips.
We will keep you all updated as this chart idea unfolds.
Mr Gold

Selena | XAUUSD 30M – Trend Support + Liquidity Hunt ScenarioFOREXCOM:XAUUSD OANDA:XAUUSD PEPPERSTONE:XAUUSD
4H candle chart thought
Structure remains bullish as long as the trendline + holding zones hold. Smart-money liquidity sits above previous highs — a break may initiate continuation to extended targets.
📈 Bullish Scenario (Primary Bias)
If price holds above 4,200 and reclaims the entry block:
🎯 TP1 – 4,240–4,245
🎯 TP2 – 4,258–4,260 (Buy-Side Liquidity)
🎯 Final Target – 4,270+
📉 Bearish Invalidations
Break & close below: 4,176
Stronger confirmed reversal below: 4,125
Current Levels To Watch
Resistance 🔴: 4,245 / 4,260 / 4,275
Support 🟢: 4,200 / 4,176 / 4,120
⚠️ Disclaimer: For educational purposes only — not financial advice.

GOLD : Bullish ContinuationThere is a strong likelihood that Gold will continue to appreciate following a confirmed breakout above a significant intraday/daily resistance cluster.
We anticipate a move upwards to at least 4300.
