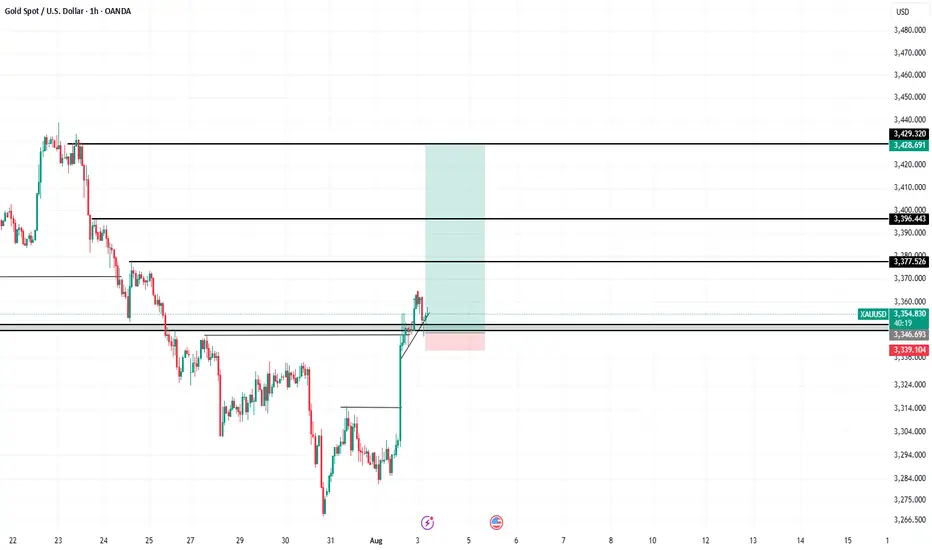
XAUUSD Breakout and Retest – Targeting 3428 Supply ZoneGold (XAUUSD) has broken above key resistance at 3346 and successfully retested it as support, forming a bullish structure with higher lows. This aligns with a classic breakout–retest continuation setup.
The entry is taken after confirmation of support holding, with the following levels in focus:
Entry: Around 3355
Stop Loss: Below retest zone at 3339
Targets:
TP1: 3377 (minor resistance)
TP2: 3396
Final TP: 3428–3430 supply zone
Market structure is bullish on the 1H timeframe, and momentum supports upside continuation. Trade aligned with trend and key demand zone reaction.
📌 Always manage risk. Not financial advice.
GOLD trade ideas
GOLD CAN FALLING SOONAccording to M15 analysis gold market in flying pressure from last day now market maybe go down from RESISTANCE ZONE if you want then go sell from RESISTANCE ZONE is best for you Dont be greedy use money management
TRADE AT YOUR OWN RISK
REGARD ALBERT

Gold looks like bearish move as the price hitting it resistance Gold is showing signs of a bearish move as the price tests its resistance zone. Sellers may take control if it fails to break above. Watch for confirmations before entering! 💹
#GoldAnalysis #XAUUSD #ForexTrading #BearishMove #ResistanceLevel"
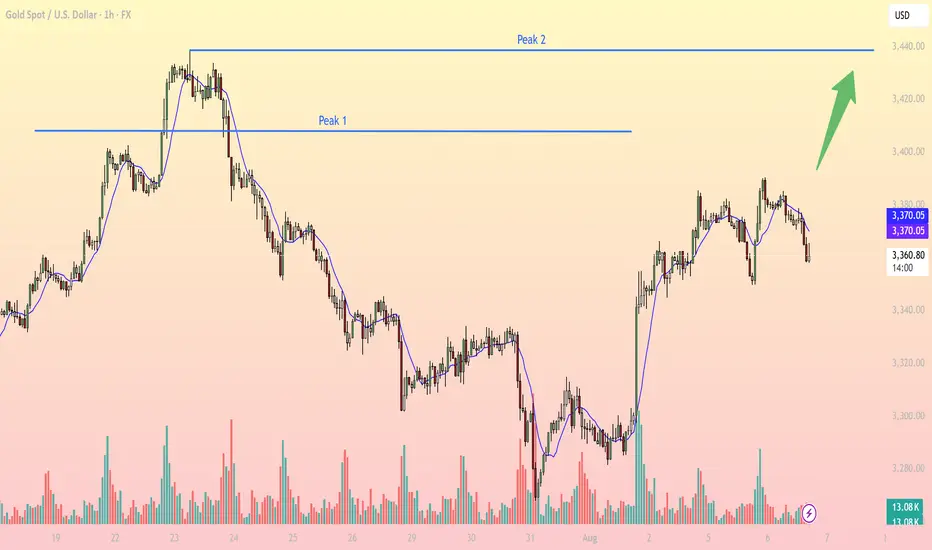
Intraday Gold Price Analysis – Key Levels and Strategy1. Technical Overview – Gold OANDA:XAUUSD on 1H Timeframe
At the time of writing, gold is trading around 3,361 USD, continuing to range just below the key resistance zones after a short-term bullish recovery. Price structure is forming a potential higher low, but a clear breakout above resistance is still pending for trend confirmation.
2. Key Levels to Watch
Support 1: 3,335 – 3,340 - Near EMA10 + previous demand zone, potential bounce area
Resistance 1 (Peak 1): 3,375 – 3,380 - Previous local top, acted as rejection zone recently
Resistance 2 (Peak 2): 3,435 – 3,440 - Major breakout target from previous double top pattern
3. Indicators Analysis
EMA10 (blue line): Currently serving as dynamic intraday resistance. Price is oscillating around it, showing consolidation.
Volume Profile: Rising on bullish candles – indicates accumulation pressure, though not yet confirmed by breakout.
RSI (not shown): Likely hovering near 50 – neutral bias, awaiting directional trigger.
4. Price Behavior and Structure
Market has recovered from end-of-July selloff, creating a local bottom near 3,280.
Forming a potential cup-and-handle pattern targeting break of 3,375, with bullish continuation targeting 3,440.
Sideways movement on lower volume suggests accumulation phase before breakout.
5. Trading Strategy Suggestion (Intraday)
- Bullish Scenario:
Entry: Buy on confirmed breakout above 3,375 (Peak 1) with strong candle + volume.
SL: Below 3,360.
TP1: 3,400
TP2: 3,440 (Peak 2 – measured move from breakout)
- Reversal Scenario:
Sell on rejection from 3,375 if price forms double top or bearish engulfing candle.
SL: Above 3,380.
TP1: 3,345
TP2: 3,330
- Neutral Bias:
Wait for price to retest EMA10 and demand zone near 3,340 before entering long, especially if RSI and volume show divergence.
6. Final Notes
Price action is coiling below major resistance, hinting at a potential explosive move. Patience and level-based execution are key today. Scalpers can utilize 15m confirmation inside key zones for tighter entries.
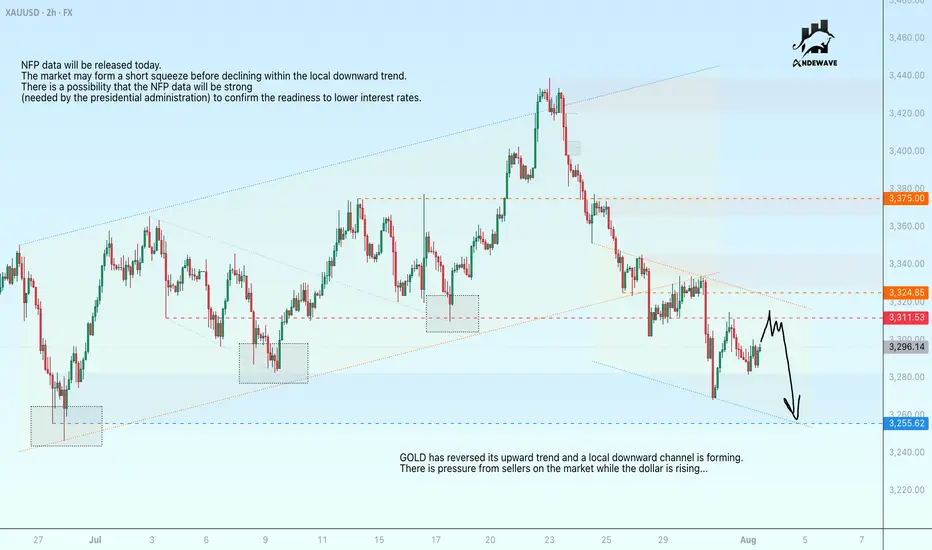
GOLD may be subject to manipulation ahead of the NFPGOLD has reversed its upward trend and a local downward channel is forming. There is pressure from sellers on the market while the dollar is rising...
NFP data will be released today. The market may form a short squeeze before declining within the local downward trend.
There is a possibility that NFP data will be strong (needed by the presidential administration) to confirm the readiness to lower interest rates.
Scenario: ahead lies a strong resistance zone at 3311.5 - 3324.85. The formation of a false breakout could intensify bearish pressure, leading to a decline in prices to 3255
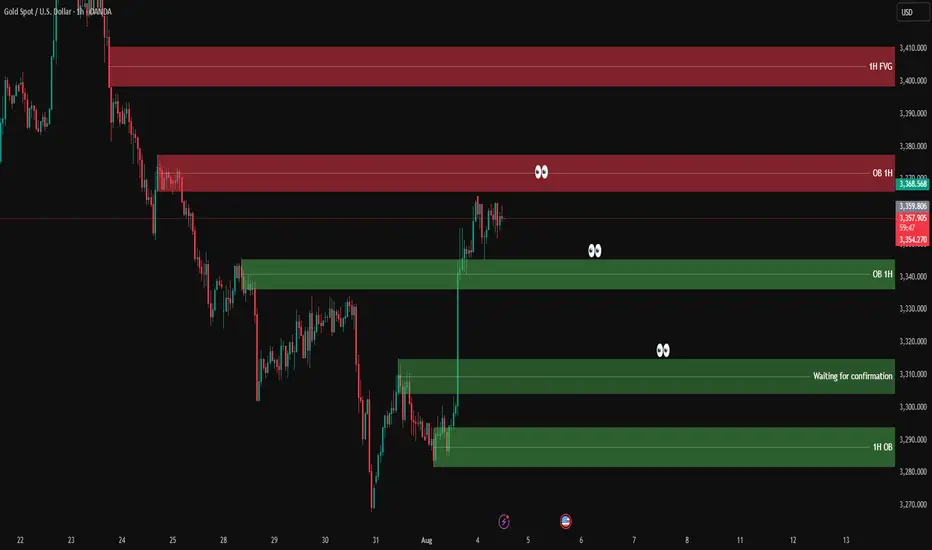
XAUUSD analysis - 1H FVG and OB setupsOn the 1H chart, price has made a sharp bullish move from the lower 1H OB zone (3,275 – 3,285) and is now hovering just below the 1H supply zone.
🔴 1H Supply Zone (OB):
3,354 – 3,368 → Price is consolidating here with no strong rejection yet.
🟢 1H Demand Zone (OB):
3,337 – 3,344 → First area to watch for potential bullish reaction.
👁 Mid-level support zone (waiting for confirmation):
3,310 – 3,320 → If price pulls back here and gives confirmation on lower timeframe, we’ll look for long setups.
📌 Trade scenarios:
1️⃣ Bullish: Wait for a retracement into 3,310 – 3,320, and if confirmed on LTF (3M–5M), go long.
2️⃣ If price drops deeper into the lower OB zone 3,275 – 3,285 and gives strong bullish reaction → potential long setup again.
3️⃣ Bearish: If price rejects the current OB zone (3,354 – 3,368) with confirmation → short entry targeting the green zones below (~3,320 or 3,310).
✅ Entry only after confirmation on lower timeframe
❌ No confirmation = no trade
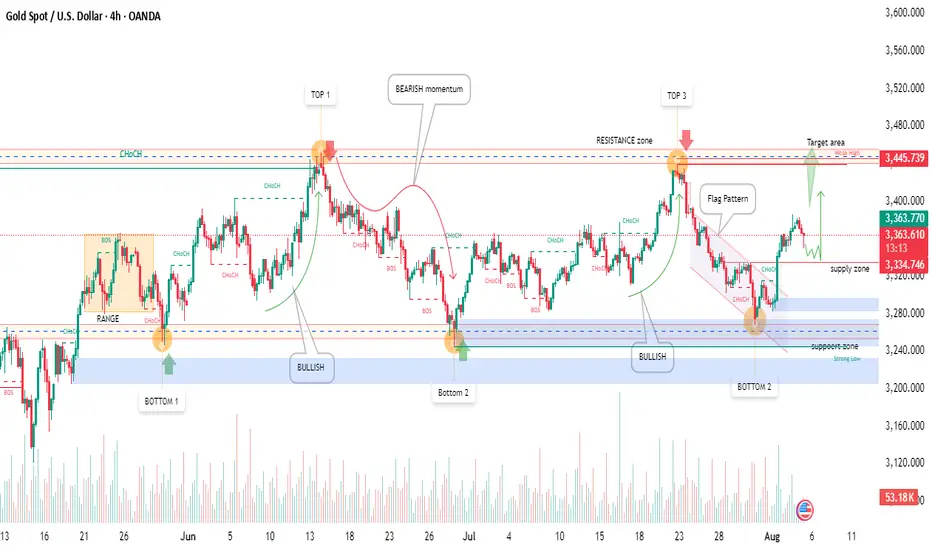
Gold(XAU/USD) 4H 5Aug2025 Price Analysis-Bullish Setup in Play!🧠 Technical Overview:
Gold has shown a solid bullish structure after rebounding from a strong support zone marked around the $3,250 area. We witnessed a textbook flag pattern breakout followed by a Change of Character (ChoCH) confirming bullish momentum.
🔹 Support Zones:
Strong demand near $3,250 – $3,280
Bullish reaction visible from Bottom 2
🔹 Resistance Zones:
Key supply zone at $3,334 – $3,356
Target area near the weekly high at $3,445
🏹 Trade Idea:
A bullish continuation is expected from the current zone after price retested the flag breakout.
🔸 Entry Zone: $3,334 – $3,356 (supply flip)
🔸 Target: $3,445 (Weekly High)
🔸 Stop Loss: Below $3,280 (support zone)
📊 Market Sentiment:
✅ Bullish momentum confirmed by multiple ChoCHs
✅ Strong buying volume at support
❗ Watch for price action confirmation at current supply zone
🏁 Summary:
Gold is currently respecting bullish structure with a clear path toward the $3,445 target. Traders can look for long opportunities after confirmation within the supply zone.
💬 What’s your outlook on Gold? Bullish or Bearish? Comment below!
The idea of shorting on rallies below 3315 remains unchanged.Gold remains generally weak, with multiple rebounds showing signs of fatigue. The upward moving average continues to suppress prices, indicating that the bearish trend remains intact, and the short-term market outlook remains bearish. Trading strategies remain bearish today, with a key focus on the 3300-3315 area, a key short-term resistance zone. If the market rebounds before the US market opens and approaches this area, or if a clear topping signal appears near this range, consider entering a short position. Today will see the release of the non-farm payroll data, which may influence the market's trajectory. We recommend prioritizing short-term trading before the release, and reconsidering the market's direction based on market feedback after the release. Structurally, gold continues to exhibit a volatile downward trend, with lower highs and lower lows. Today's low is expected to be lower than yesterday's. Short-term short positions are focused on 3285-3280, with a break below this level potentially allowing for further declines. Please carefully time your entry, strictly implement risk management, and avoid emotional trading.
Impact of the Non-Farm Payrolls? Latest Analysis.Information Summary:
Most traders are turning their attention to the crucial US labor market report, which is being closely watched as the market actively searches for new clues regarding the timing of the next interest rate cut this year.
The July non-farm payrolls report will be released at 8:30 AM US time. US non-farm payrolls increased by 110,000 in July, seasonally adjusted, lower than the 147,000 increase in June. The US unemployment rate is expected to rise from 4.1% to 4.2% in July.
If the non-farm payrolls figure falls below 100,000 and the unemployment rate rises, it could signal a weakening job market, undermining the Fed's rekindled hawkish outlook and dampening the dollar's upward momentum. In this scenario, gold prices could re-cross the 3,400 mark. However, if the non-farm payrolls unexpectedly exceed 150,000, it could support the dollar's continued rise and hurt gold. Strong US employment data could rule out two rate cuts from the Fed this year.
Market Analysis:
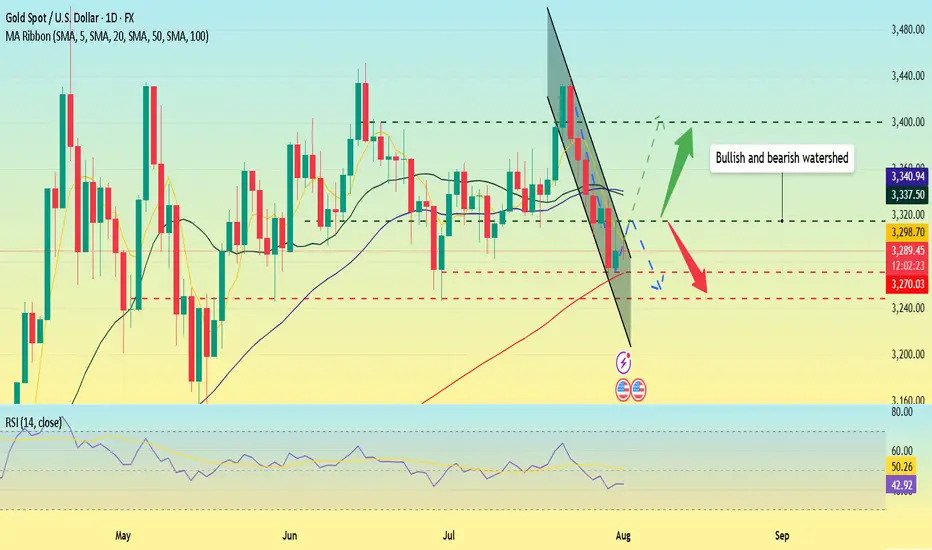
Quaid believes that the current moving average crossover is trending downward, and downward momentum is still in play. The RSI remains at 42.7, hovering below the midline, indicating that gold's downward trend remains intact. The 20-day moving average fell below the 50-day moving average on Wednesday, confirming the bearish momentum.
Therefore, if gold closes below the key support level of the 100-day moving average at $3,270 on a weekly basis, a new downtrend could begin, potentially leading to a drop towards the June 30 low of $3,248.
Quaid believes that the current bull-bear watershed needs to focus on around 3315, which is the previous intensive trading area and is also the first resistance position for short-term upward movement.
On the last trading day of Super Data Week, Quaid hopes that everyone has gained something and has a happy weekend; I wish you all good luck.
XAUUSD: Market Analysis and Strategy for August 6th.Gold Technical Analysis:
Daily Chart Resistance: 3430, Support: 3300
4-Hour Chart Resistance: 3400, Support: 3334
1-Hour Chart Resistance: 3390, Support: 3350.
Gold bottomed out and rebounded yesterday. After hitting 3350, the price quickly rebounded to 3390, then traded sideways. Keep an eye on the bullish trend and buy on dips. Wait for a breakout above 3390.
After reaching 3390 yesterday, the price fluctuated downward today, currently trading near 3365. A short-term pullback does not signal a change in the trend; it remains bullish. Yesterday's low of 3350 forms the bull-bear divide. If gold prices remain above this level, the bullish trend remains. Pullbacks are buying opportunities. Any stop-loss around the 3350 support level is a good time to buy. During the uptrend, there's no need to speculate on the top; for now, focus on 3390. A breakout above 3390 could target 3400-3415 for bulls.
For the NY market plan, you can buy when it stabilizes in the 3350-3356 area. The SL plan is set at 3345, and the rising target is 3385-3400.

The rebound is weak, short orders intervene#XAUUSD
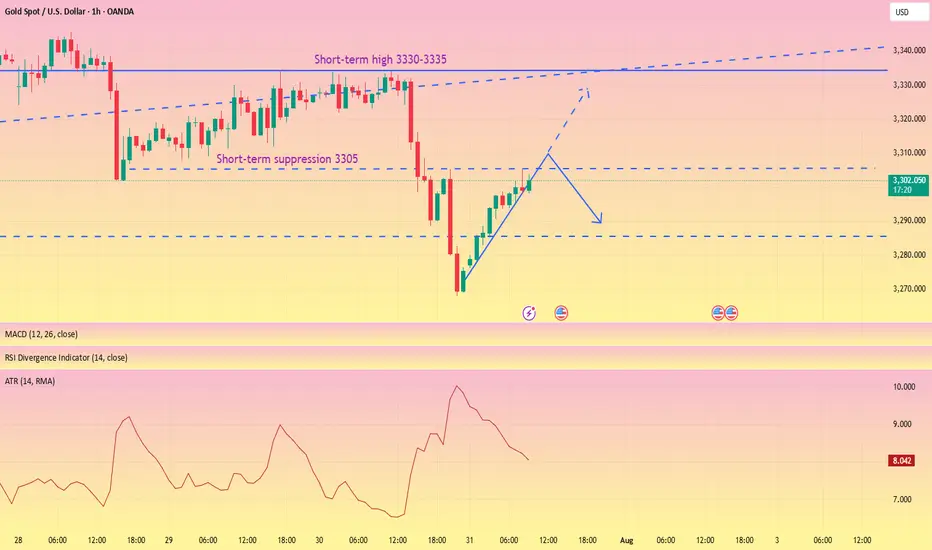
After two consecutive trading days of volatility, gold finally began to fall under pressure near 3335. After breaking through the 3300 mark, the price of gold accelerated its decline, reaching a low of around 3268, and yesterday's daily line closed with a large negative line. 📊
Today's rebound is more likely to be based on the buffering performance of the impact of news. The ATR data also shows that the bullish momentum is slowly weakening in the short term. 🐻After digesting the impact of yesterday's news through rebound during the day, it may fall again in the future.📉
📎The primary focus today is 3305 above, which was also the high point of yesterday's pullback correction. If the gold price rebounds to 3305-3320 and encounters resistance and pressure,📉 you can consider shorting and look towards 3290-3270.🎯
If the short-term gold rebound momentum is strong and breaks through the 3305-3320 resistance area, it will be necessary to stop loss in time. Gold may be expected to touch yesterday's high resistance of 3330-3335, which is the second point to consider shorting during the day.💡
🚀 SELL 3305-3320
🚀 TP 3290-3270
XAUUSDSince we are bullish on XAUUSD, Price made a new high and now back on the discount of the 1hr range. I expect up down candle to send price to the buy side.

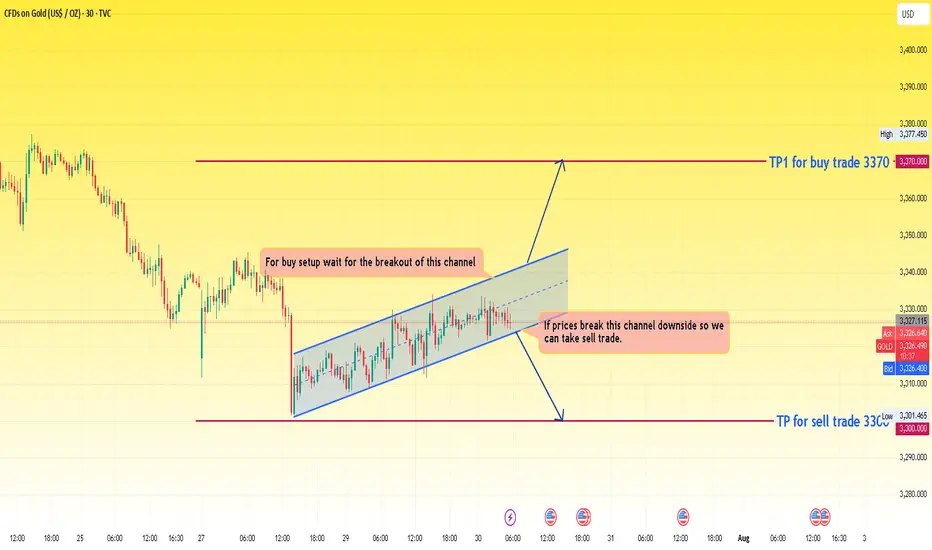
XAUUSD prices current scenario This chart presents a range-bound price action within an ascending channel and offers two potential breakout trade opportunities depending on price direction.
🔍 Chart Summary:
> Current Price: Around 3326-3328
> Pattern: Ascending channel
> Bias: Neutral (waiting for breakout)
📊 Channel Analysis:
> Price is moving inside an ascending channel, marked by two parallel trendlines (support and resistance).
> This suggests gradual bullish pressure, but the price is still within a consolidation/ranging structure.
> Buyers and sellers are currently indecisive, waiting for a clear breakout direction.
🧠 Trade Scenarios:
✅ Buy Setup:
: Condition: Breakout above the upper channel resistance
: Confirmation: Break and close above channel, ideally with strong bullish candles and volume
: Target: 3370 (marked as TP1 for buy trade)
> Reasoning: Breakout confirms buyer dominance and momentum continuation
❌ Sell Setup:
: Condition: Breakdown below the lower channel support
: Confirmation: Break and close below the channel with a bearish engulfing or volume spike
: Target: 3300 (marked as TP for sell trade)
> Reasoning: Break below structure indicates loss of buyer control and return of bearish trend
⚠️ Key Notes:
: The ascending channel suggests short-term bullish strength, but no strong trend has been confirmed yet.
: Avoid entering within the channel—this is a no-trade zone due to market indecision.
: Wait for confirmation of breakout/breakdown before entering trades.
✅ Conclusion:
> The price is currently in a rising consolidation channel.
> Breakout above = buy opportunity toward 3370
> Breakdown below = sell opportunity toward 3300
This is a classic wait-for-breakout setup—ideal for breakout traders looking for defined risk and reward zones.
GOLD Potential Bullish Fallowing the PullbackGold is currently forming a trading range, with recent price action indicating a test of support, which may mark the end of the recent pullback. Yesterday, gold retraced toward the 3391 level, showing signs of short-term recovery.
Key Market Focus
The market is closely watching developments around the Federal Reserve appointment, including the potential replacement of Chair Powell. Trade-related comments from Donald Trump are also creating uncertainty. These geopolitical and macroeconomic factors may trigger a new correction or volatility phase in gold.
Resistance: 3400 / 3425
Support: 3355 / 3350
Price action confirmed a false breakout to the downside, with strong buying interest near the 3350–3355 support zone. If the price holds above this support, it strengthens the case for a bullish continuation. A break and close above 3400 could pave the way toward 3425 and potentially higher Growth.
You may find more details in the chart.
Trade wisely Best of Luck Buddies.
Ps: Support with like and comments for better analysis Thanks

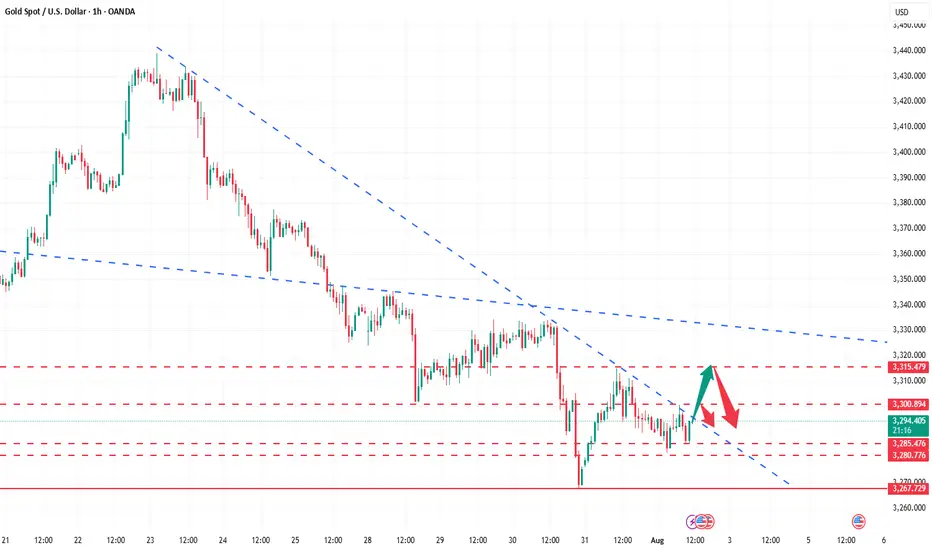
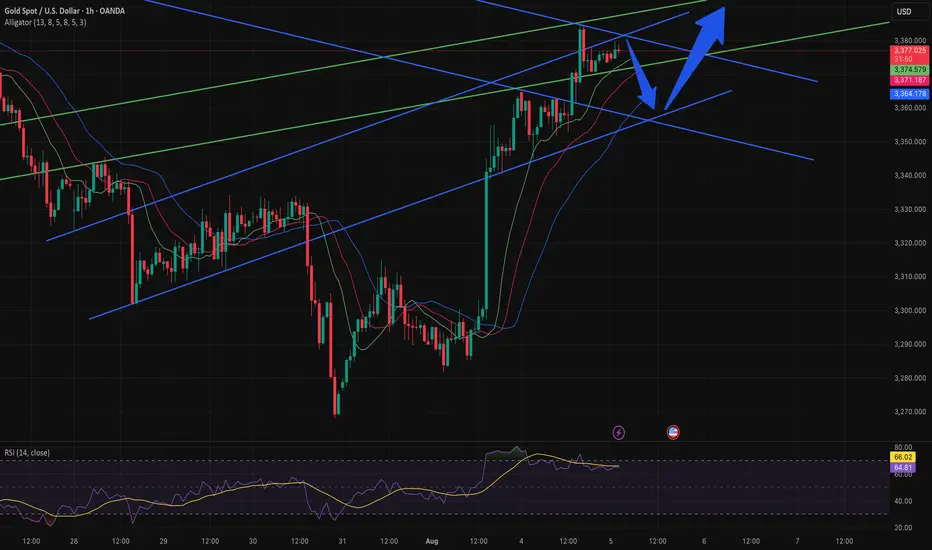
XAUUSD H1 - TRADING I’m quickly analyzing the turquoise trendlines on D1 and the others on H1, and I can determine that there will be a brief short reaction before continuing with the bullish trend.
Gold trading rhythm is perfectly matchedIn the previous strategy, we recommended maintaining a high-selling and buying-low strategy for gold. We accurately predicted the high point near 3397 and arranged short positions near 3395. It then fell steadily to around 3371. Judging from the current gold trend, gold rose and then fell in the European session, touching around 3397, which is exactly the pressure level of the upward channel trend line. The Bollinger Bands in the 4H cycle closed, and the indicators temporarily showed signs of differentiation, but the overall market was resistant to declines at high levels. The current short-term support is around 3375-3370. If it does not break the short-term, it will still be volatile. If it falls below, the strong support of 3360 will be seen. The upper pressure levels are 3385, 3398-3400. In terms of operation, we still maintain a high-altitude, low-multiple short-term strategy. I will give the specific operation ideas at the bottom, remember to pay attention in time!

Xau Usd Neyork time buy set up (05/08/2025)XAU USD Can buy with below level as swing as well as intraday
BUY FROM 3352/58
tp1- 3272
tp-2-3284
tp3-3393
tp4- 3410
SL- 3347/45 (for swing i prefer to hold
i use SMC/ fib tools. and truly a price action method for this entry
Gold short opportunityGold completed its mini bull flag target and re-entered a micro rising channel, a potentially bearish structure.
With price now testing a key supply zone, we’re watching for rejection to initiate a short, targeting the major demand zone below.

Gold Price Analysis August 5#XAUUSD – Gold continues to increase in wave 3, BUY strategy continues to be prioritized
The D1 candle continued to close with strong increase, confirming that the uptrend is dominant and there are no clear signs of correction. Gold is currently moving in wave 3 - a period with strong amplitude and few recovery beats, so the main trading strategy is still to wait to buy at important support zones.
In the Asian session this morning, the price is reacting at the 3385 zone - an area that can act as a confirmation point for the next recovery. If the buyers maintain their position in this zone, the price will likely continue to move towards higher resistance zones.
🔹 Support zone to watch: 3363 – 3346 – 3332
🔹 Potential resistance zone: 3385 – 3407
👉 Strategy: Prioritize waiting for confirmation signals at support zones to open BUY orders in the direction of the trend. Need to carefully observe the price reaction at the 3385 zone to assess the strength of the buying force during the day.

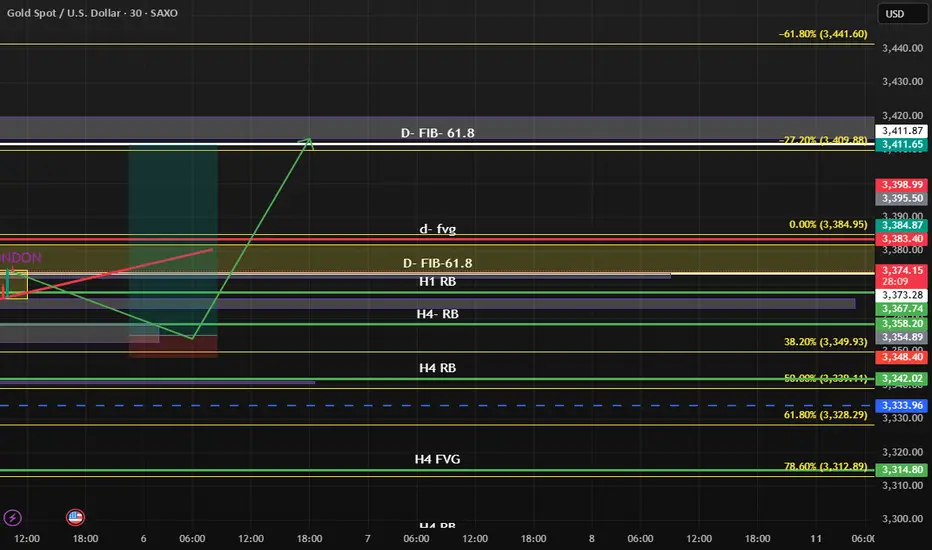
Gold market outlook on the H4 chart. Possible BUYWeekly storyline bullish
Daily storyline bullish
H4 storyline bearish
Two POV observations
Sell side: Price reacted from a daily obstacle ( DSs ) but still has a long way to break its confirmation swing on the H4 ( ? ). We hope to see H4 storyline change to bullish around the swing low area without breaking it ( ? )
Buy side: price rejects from a daily SnR level ( DBs ) and breaks its confirmation swing on the H4 ( + ) so we hope to join price on the 60% discount level.
Nb: Even though we’re still bullish on the weekly and daily, price refused to break PDC on the H4 chart right after a daily obstacle touch. Could be messy. Stay safe and always afford your risk

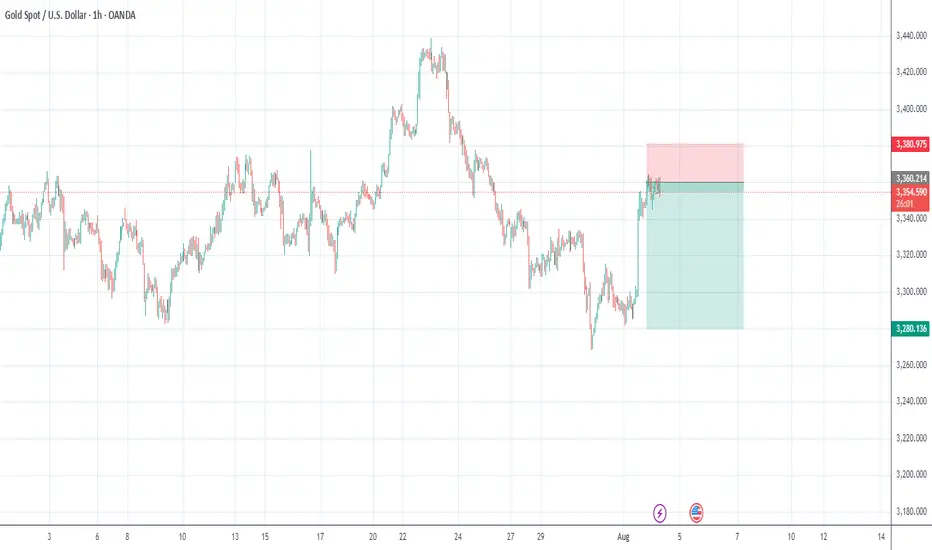
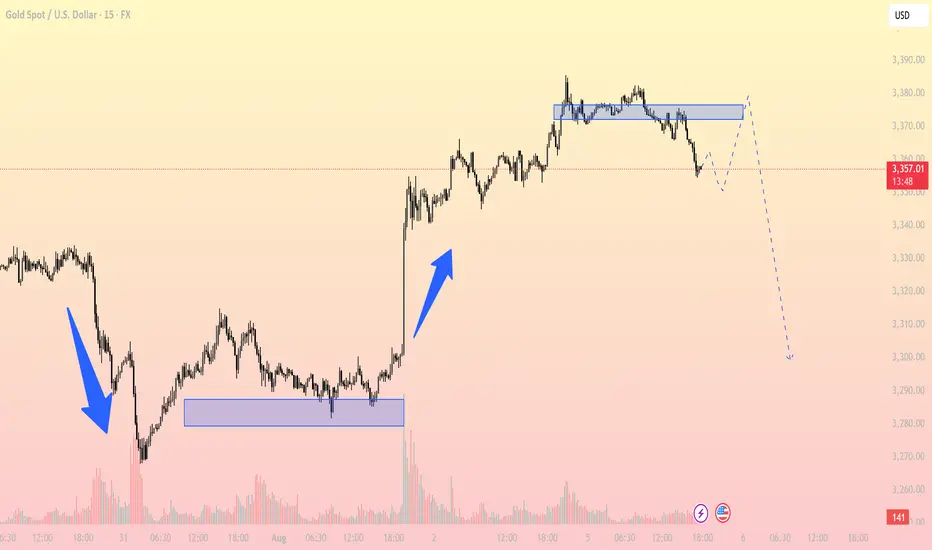
Gold Showing Distribution Signs – Is a Bearish Reversal in Play?Technical Analysis
1. Key Support & Resistance Levels
Short-term Resistance: 3,375–3,380 USD (previous consolidation zone now acting as supply)
Major Support: 3,300 USD (prior breakout base, possible Fibonacci target zone)
Intermediate Support: 3,335 USD (intraday low during the current correction)
2. Structure & Trend
The chart shows a strong bullish impulse on August 2, breaking out of a prolonged consolidation base.
After the breakout, price entered a distribution phase around 3,375 where momentum stalled and volume declined.
A clear breakdown from the distribution zone is now underway, suggesting increased selling pressure and a possible retest of lower demand areas.
3. Price Action Behavior
Price is currently attempting a pullback retest toward the broken structure near 3,370–3,375.
There’s potential for a small head and shoulders pattern, with the neckline near 3,335. A confirmed break below this level could accelerate the move down to 3,300.
4. EMA & RSI Outlook
EMA20 is beginning to turn downward and may soon cross below the EMA50, hinting at a short-term bearish trend shift.
RSI (not shown but worth watching) is likely cooling off from overbought levels, providing space for further downside.
Trading Strategy Ideas:
Sell on pullback to resistance:
Entry zone: 3,370–3,375
Target: 3,335 and 3,300
SL: 3,382
Short-term Buy if RSI oversold + bullish price action: 3,335
Target: 3,370
SL: 3,325
Gold is showing signs of weakness after a sharp rally. The breakdown from the distribution zone indicates a shift in sentiment. If price fails to reclaim 3,375 and confirms below 3,335, the 3,300 support could be the next key destination.
Follow to receive more high-quality trading strategies in upcoming sessions. Save this idea if you found it useful!
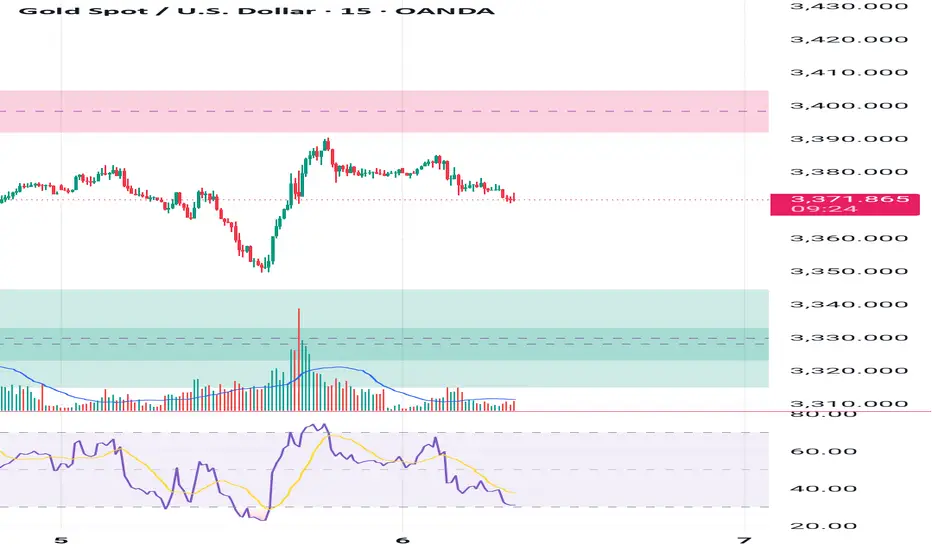
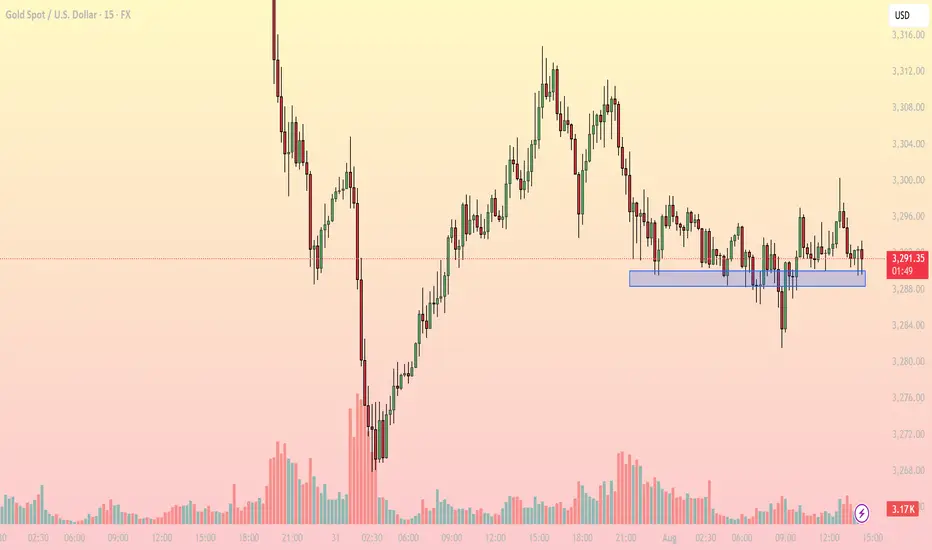
Gold consolidates near key support – What's next for?1. Market Overview
On the 15-minute chart, XAUUSD is trading around 3,290–3,292 USD, hovering just above a critical intraday support zone at 3,287–3,289 USD (highlighted in blue). This area has repeatedly provided a bounce in recent sessions, indicating persistent buying interest.
The current price action reflects sideways movement within a narrow range (3,287–3,296 USD), and notably, declining volatility, as shown by reduced candle range and trading volume.
2. Technical Breakdown
EMA: Price is moving around the EMA20 and EMA50, reflecting indecision and lack of directional momentum.
RSI (inferred): Likely hovering near the neutral 50–55 zone, confirming a balanced market.
Trendline: A descending series of lower highs from the 3,312 peak suggests bearish pressure, though buyers still defend key support.
Fibonacci: The 3,287 USD zone aligns with the 61.8% Fibonacci retracement level, reinforcing its strength as a bounce area.
3. Key Levels to Watch
3,287–3,289: Support - Repeated reactions here – key demand zone
3,296: Immediate resistance - Needs breakout to confirm bullish move
3,302: Next resistance - Breakout target – short-term top
3,275: Deeper support - Retest level if support breaks
4. Trading Strategy Scenarios
🔹 Scenario 1 – Long setup at support
Entry: 3,287–3,289 (wait for bullish reaction like pin bar or engulfing)
Stop Loss: Below 3,284
TP1: 3,296 | TP2: 3,302
🔹 Scenario 2 – Short setup on breakdown
Entry: Below 3,284 (after clear bearish candle close)
Stop Loss: 3,288
TP1: 3,275 | TP2: 3,268
5. Conclusion
Gold is in a tug-of-war at a sensitive support zone. Whether bulls defend or bears break below will set the tone for the rest of the session. Focus on price reaction around 3,287 to determine direction – avoid blind predictions.
Make sure to follow for more live strategies as the New York session unfolds – and save this post if you find it helpful!
What’s your view on this support zone? Let’s discuss below!
1 hrs BPRClear Buying area is near BPR
Look in the 1 hr BPR area, once it is tapped make to check for confirmation in small time frame for entry