GOLD increased in the short term: Break down expectedThe Gold market has been very strong for some time, but I don’t think this will continue to be the case going forward. As we’ve seen, the price has rallied a bit on Friday with Trump’s EU tariff threats.
Market structure starts to hint exhaustion, as such overbought conditions often lead to generous pullbacks, supporting needed corrections.
That being said I do think that on Monday we might see a short term pullback.
We can see that gold is currently being rejected just above the higher zone of the 4h ascending channel. The zone aligns with a low-volume node as well. Therefore, at this zone around the 3,350, I wouldn't recommend to chase high. Before this zone is clearly broken considering long entries here would be buying blindly.
Right now I think you have to look at this as a market that may just simply be a buy on the dip and hold till we get to the $3,500 level again type of situation.
The other scenario is that the market will consolidate for a while.
If we were to break down below the $3,290 level, then $3,200 is next support.
In the long run though the bias remains bullish with potential to challenge the 3,435 and as well as 3,500 in the big picture.
But if you're watching for buys:
wait to see how price behaves on Monday
watch for sustained bullish structure before getting involved
don’t chase, wait for a clean break + candle confirmation pattern
For sells:
Watch for bearish rejection in the next couple of candles (4H or Daily)
Don’t enter unless it’s confirmed!
GOLDCFD trade ideas

GOLD increased in the short term, approaching an important levelFrom a recent price action standpoint, the move on Gold may have offered cues of encountering weakness, and could serve as a key trigger for bearish traders. This is why I’m anticipating further short-side follow-through. The negative outlook is not confirmed yet, however a bounce off the trendline could once again attract sellers, for a decent move to 3,240 support zone . This latter zone, could be a key turning point that if broken, would lead to a good opportunities for buyers looking to get involved on the dips, anticipating a potential shift in momentum.
But a strong move up and break of trendline at around 3335-3340, would allow Gold to reclaim the 3400 mark and climb even further.
On Monday in my last analysis I predicted that the price gold would fall as low as 3290, after which the price has rebounded short term. All this being said, I am closely watching how price will react when it encounters the trendline as shown and I will wait for any confirmation clues.
Please note that I will not get involved without proper confirmation

Lingrid | GOLD Weekly Outlook: Flag BREAKOUT Eyes April HighOANDA:XAUUSD is currently forming a textbook flag pattern at 3,358, following the sharp rally from March lows. This consolidation represents a pause in bullish momentum rather than a reversal, with price oscillating between well-defined boundaries in a rectangular formation. The 4H chart shows a completed corrective wedge pattern after April's 3,500 high, while the daily timeframe clearly displays the flag structure - a classic trend continuation pattern. The downward trendline containing recent price action appears increasingly vulnerable as gold approaches the flag's upper boundary.
Key technical levels include immediate resistance at 3,400, with the more significant battle at 3,500 where April highs converge with the flag's upper boundary. A decisive break above this zone could trigger rapid acceleration toward measured move targets around 3,680 - 3,720. The major support at 3000 has held firm throughout consolidation, providing a solid foundation for renewed buying. The primary uptrend remains intact with consistent higher lows despite periodic weakness.
The broader macro environment continues supporting gold's fundamental case through geopolitical uncertainties, currency concerns, and diversification needs. Combined with this compelling technical setup, the current consolidation likely represents accumulation rather than distribution. Next week we should monitor the flag's upper trendline closely, as any breakout above 3,380 - 3,400 could trigger rapid acceleration toward new all-time highs.
Traders, if you liked this idea or if you have your own opinion about it, write in the comments. I will be glad 👩💻

GOLD → Correction before possible growthFX:XAUUSD entered a liquidation phase (rally) within the trading range at the opening of the session. The dollar's rise is to blame. The focus is on supporting consolidation...
Investors remain interested in gold as a safe haven asset amid geopolitical risks and declining demand for US assets.
The key drivers remain news about tax reform in the US, trade negotiations, and upcoming macro data.
Gold is consolidating, but since the opening of the session, the price has been heading towards support. Against the backdrop of an upward trend, a trigger for bearish liquidity is likely to form before growth.
Against the backdrop of the dollar's growth, gold is entering a correction phase. At the moment, all attention is on support and the liquidity zone of 3265. A false breakdown will trigger a price buyback.
Resistance levels: 3322
Support levels: 3282, 3265
Since the price is still within the range and a countertrend correction is forming in the market, in our case, it is worth considering an intraband trading strategy. A false breakdown of support could trigger growth to intermediate resistance or to the upper border of the channel.
Best regards, R. Linda!

Gold (XAU/USD) – Inverse Head & Shoulders Breakout Setup🧠 Chart Pattern Identified: Inverse Head & Shoulders
🟡 Left Shoulder ➡️ Formed at a local dip.
⚫ Head ⬇️ Deepest low around 3,274.103.
🟡 Right Shoulder ➡️ Bouncing near the same zone.
🔁 This is a classic bullish reversal pattern — a break above the neckline could signal a strong upside move.
📊 Key Levels & Zones
🔵 Support Zone:
🟦 Area: 3,274 – 3,294
✅ Strong bounce seen here (highlighted by the head and shoulders base)
🔵 Resistance Zone:
📏 Just below 3,305 (marked as neckline)
✋ Price must break this to confirm the reversal
🔵 Target Point:
🎯 3360 📈
📏 Based on the height from head to neckline
🔵 Stop Loss Zone:
❌ 3,274.526
🔻 Below the head for safe risk control
⚙️ Trading Setup Summary
🔹 📍 Entry Point:
📌 Around 3,294.449
🚪 Enter on breakout above neckline
🔹 🎯 Target Point:
🏁 3360
🔹 🛑 Stop Loss:
🚫 3,274.526
🔹 Risk-Reward Setup:
🔍 Targeting a move of ~65 points
⚖️ Risk of ~20 points → solid R/R ratio
📈 Indicator:
🧮 EMA 70 ➡️ 3,305.005
⏳ Price currently testing it — a break above EMA would boost bullish confirmation.
📅 Economic Events:
📆 Multiple event icons suggest upcoming news — expect volatility!
⚠️ Be cautious during these times.
✅ Final Thoughts:
📊 Pattern suggests a bullish breakout is near 🚀
🔒 Use stop-loss and enter after breakout to manage risk effectively
🎯 Keep an eye on volume during breakout — it confirms strength

Lingrid | GOLD Key SUPPORT Zone Bounce OpportunityOANDA:XAUUSD is consolidating after a rejection from the descending resistance trendline near 3345, with price now approaching the prior demand zone around 3265. If this support holds, a bullish reaction could propel price back toward the 3345–3350 zone for another retest. The broader pattern reflects a potential higher low forming against the downward trendline. A bounce here would confirm bullish interest and set the stage for continuation higher.
📈 Key Levels
Buy zone: 3265
Buy trigger: bullish reaction from support or breakout above 3300
Target: 3345
Sell trigger: break below 3265
💡 Risks
Failure to hold 3265 support could trigger sharp downside
False breakouts near 3345 remain a threat
Market-sensitive data could increase volatility
Traders, if you liked this idea or if you have your own opinion about it, write in the comments. I will be glad 👩💻

GOLD → Consolidation ahead of news. Retest of resistanceFX:XAUUSD remained above the key support level of 3280 and is testing intermediate resistance. Against the backdrop of the dollar's decline, the metal has a chance to continue its growth...
Gold is trading in consolidation ahead of the Fed meeting minutes. Easing trade risks and the dollar's recovery triggered a correction from the recent peak of $3366. Against the backdrop of the dollar's correction, the metal is entering a phase of local rally and testing resistance at 0.5f
The Fed is maintaining a cautious tone, and the market is waiting for signals on interest rates. The escalation of the conflict in Ukraine and the threat of new sanctions from Trump did not cause significant concern in the markets. Investors are waiting for drivers
Resistance levels: 3322, 3348, 3363
Support levels: 3290, 3282, 3265
A small correction may form from 3322 before growth continues. The market is interested in liquidity in the 3348-3363 zone, and the price is likely to test this zone. However, further developments depend on the fundamental background. Rising economic risks or hints of interest rate cuts could support the price of gold.
Best regards, R. Linda!

XAUUSD.. gold 4H charts pattern I'm outlining a short (SELL) trade setup for XAU/USD (Gold). Here's a breakdown of your trade idea:
Entry: 3308 (SELL)
First Target (FVG): 3250
(FVG likely refers to a Fair Value Gap – a liquidity target in imbalanced price zones)
Final Target: 3140
Let’s assess the setup:
Key Points to Consider:
1. Risk Management:
Have you set a stop-loss? For this short, a logical SL might be above recent highs or structure – perhaps around 3330–3340.
Position sizing is critical depending on account size and risk tolerance.
2. Market Context:
Is this based on a higher time frame imbalance, a bearish trend continuation, or news catalyst?
Are you following a liquidity sweep strategy or reacting to a key resistance rejection?
3. Technical Confirmation:
Confirmation from order blocks, bearish divergence, or break of market structure (BOS) could strengthen your setup.
Would you like me to:
Analyze the chart if you provide a screenshot?
Provide a technical breakdown of current XAUUSD levels?
Help calculate risk-to-reward or position size for this trade?
Let me know how you'd like to proceed.

Gold at Key Rejection Zone: Will the Drop Resume from $3310?By examining the gold chart on the 4-hour timeframe, we can see that after some consolidation between $3294 and $3302, the price finally began a sharp drop, correcting down to $3245. This area was a key demand zone on lower timeframes, which triggered a rebound, and gold is now trading around $3310. If the price gets rejected from the $3310–$3313 zone, we can expect another potential decline.
Please support me with your likes and comments to motivate me to share more analysis with you and share your opinion about the possible trend of this chart with me !
Best Regards , Arman Shaban

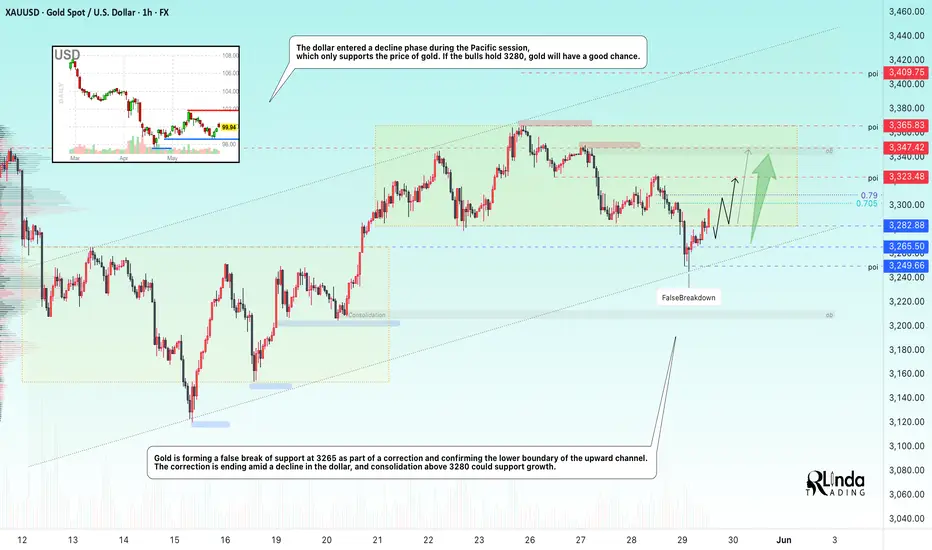
GOLD → False breakdown and support from the falling DXYFX:XAUUSD , as part of a correction, confirms the upward trend line and returns to the consolidation (range), making a false breakdown of support amid the dollar's correction...
The US dollar remains stable thanks to the Fed's hawkish minutes and the court's decision to block Trump's tariffs. Investors are waiting for Friday's inflation data (PCE), which could weaken the dollar and give gold a chance to rebound. Additional influence will come from US GDP data, jobless claims, and geopolitical news.
On D1, gold is rebounding from strong support and heading towards resistance at the rising trend line. If economic risks remain high, gold could continue its rally despite conflicting bearish patterns...
Resistance levels: 3300, 3310, 3325
Support levels: 3290, 3285, 3265
Gold is forming a false breakdown of support at 3265 as part of a correction and confirming the lower boundary of the upward channel. Consolidation above 3280 will confirm that bulls are holding the market amid high economic risks. Gold may test 3300-3310 and form a correction before continuing its growth towards 3325.
Best regards, R. Linda!
Gold long again: Completion of Double CombinationYesterday's long gold idea was invalidated and turns out that Gold has decided to do a double combination instead of a single A-B-C correction.
Now that I've seen a completion of a Double Combination, I think it is time to try to long gold again.
The stop is below $3240.

GOLD → Consolidation. Retest of support before growthFX:XAUUSD is strengthening due to a complex fundamental backdrop. A false break of support at 3285 allows the price to update its local high to 3365.
Gold fell moderately from a high of $3365 amid weak activity due to holidays in the US, despite the weak dollar. Investors are taking profits ahead of US inflation data.
Pressure is also linked to hopes for a trade agreement between the US and Japan. However, the decline in prices is limited — geopolitical tensions, US budget problems, and instability in the Middle East are keeping demand for gold as a safe-haven asset.
Support levels: 3321, 3308, 3300
Resistance levels: 3363
Technically, gold is making a false breakout of consolidation resistance and is entering a correction phase, during which the price may test liquidity below 3320-3303 before continuing to rise.
Best regards, R. Linda!

XAU/USD) Bearish trand analysis Read The ChaptianSMC trading point update
Technical analysis for Gold (XAU/USD) on the 4-hour timeframe. Here's a breakdown of the key ideas and strategy behind it:
---
Key Elements of the Chart:
1. Descending Channel Pattern:
Price is moving within a descending channel (downward sloping resistance and support lines).
The red arrows mark previous rejections from the upper boundary of the channel.
2. Supply Zone / Resistance Area:
Highlighted in yellow, the price has entered a supply zone (between 3,412.00 and 3,440.42), historically where selling pressure has emerged.
The analysis suggests sellers may dominate again in this zone.
3. Price Action Projection:
Expected to reject from the supply zone, possibly forming a lower high.
Price is projected to break the short-term upward trendline, then fall sharply.
4. Target Points:
First target: 3,206.96 – likely aligned with a minor support level or Fibonacci retracement.
Second target: 3,085.56 – near the lower boundary of the descending channel.
5. EMA 200 (3,238.55):
Price is currently above the 200 EMA, but the projection anticipates a breakdown below it, confirming further bearish sentiment.
6. RSI Indicator:
RSI is at 67.56, near overbought territory, suggesting limited upside and a possible correction.
---
Trade Idea Summary:
Bias: Bearish
Entry Zone: Between 3,412 – 3,440 (supply zone)
Confirmation: Rejection at the trendline + RSI divergence
Targets:
TP1: 3,206.96
TP2: 3,085.56
Invalidation: Break and hold above 3,440.42 (channel breakout)
Mr SMC Trading point
---
Risk Management Note:
Ensure stop-loss is placed above the resistance zone (e.g., around 3,450) to mitigate false breakouts. Monitor fundamentals like upcoming US economic data, as they can heavily impact gold.
Pales support boost 🚀 analysis follow)

XAUUSD..gold 4H chart pattern I’m sharing a trading signal or idea for XAU/USD (Gold vs. US Dollar):
• Buy at 3358
• Target: 3500
• Rationale: Expecting price to touch recent highs again
Let me break it down and offer some considerations:
1. Price Context
• 3358 is a very high level for gold — if this is a real-time signal, it’s likely based on a future bullish momentum expectation or perhaps referring to a forecasted level.
• The all-time high for gold (as of mid-2024) was around $2,450. If you mean 3358, it might be a typo or you’re referring to something else like a gold-related index, synthetic pair, or specific contract (e.g., in another currency or leveraged ETF).
2. Technical Analysis Tips
If you’re anticipating a move to 3500, here are a few things traders typically confirm:
• Strong uptrend with no major resistance between 3358 and 3500
• Volume confirmation on bullish candles
• Fundamental backing like economic weakness, high inflation, or geopolitical tension
3. Risk Management
• Entry: 3358
• TP: 3500
• SL: You should have a clearly defined stop loss to manage downside risk — perhaps based on a recent support level (e.g., 3310 or 3280)
• Risk-reward: Make sure the reward (3500-3358 = 142) is at least 2x the risk

Lingrid | GOLD potential LONG trade From the SWAP zoneOANDA:XAUUSD is testing the SWAP zone, aligning closely with the rising trendline support near 3244. If bulls defend this level again, a move toward 3400 remains in play, with the downtrend line offering resistance on the way up. A higher low formation here would signal renewed bullish interest. We should watch for a breakout or rejection to confirm next direction.
📈 Key Levels
Buy zone: 3244–3255
Buy trigger: break and retest above 3287
Target: 3400
Sell trigger: drop below 3244
💡 Risks
Rejection from descending trendline
Failure to form a higher low structure
Breakdown of channel support near 3240 would invalidate the bullish thesis
Traders, if you liked this idea or if you have your own opinion about it, write in the comments. I will be glad 👩💻

THE KOG REPORT Bank Holiday tomorrow so we'll keep it simple and update the KOG Report on Tuesday ready for the week ahead. Please have a look at the last few KOG Reports to see how it went, wasn't a bad week at all.
This week, immediate red boxes are on the chart, there is a red box active above and the indicator is suggesting a potential retracement on the move. So we'll look for price to attempt the high, if failed we can expect the move downside into the order region where we may settle.
RED BOXES:
Break above 3365 for 3370, 3376, 3381, 3390 and 3403 in extension of the move
Break below 3350 for 3343, 3335, 3330, 3323 and 3310 in extension of the move
Please do support us by hitting the like button, leaving a comment, and giving us a follow. We’ve been doing this for a long time now providing traders with in-depth free analysis on Gold, so your likes and comments are very much appreciated.
As always, trade safe.
KOG

GOLD 1H CHART ROUTE MAP UPDATE & TRADING PLAN FOR THE WEEKHey Everyone,
Please see our updated 1h chart levels and targets for the coming week.
We are seeing price play between two weighted levels with a gap above at 3389 and a gap below at 3352. We will need to see ema5 cross and lock on either weighted level to determine the next range.
We will see levels tested side by side until one of the weighted levels break and lock to confirm direction for the next range.
We will keep the above in mind when taking buys from dips. Our updated levels and weighted levels will allow us to track the movement down and then catch bounces up.
We will continue to buy dips using our support levels taking 20 to 40 pips. As stated before each of our level structures give 20 to 40 pip bounces, which is enough for a nice entry and exit. If you back test the levels we shared every week for the past 24 months, you can see how effectively they were used to trade with or against short/mid term swings and trends.
The swing range give bigger bounces then our weighted levels that's the difference between weighted levels and swing ranges.
BULLISH TARGET
3389
EMA5 CROSS AND LOCK ABOVE 3389 WILL OPEN THE FOLLOWING BULLISH TARGETS
3428
EMA5 CROSS AND LOCK ABOVE 3428 WILL OPEN THE FOLLOWING BULLISH TARGET
3478
EMA5 CROSS AND LOCK ABOVE 3478 WILL OPEN THE FOLLOWING BULLISH TARGET
3517
BEARISH TARGETS
3352
EMA5 CROSS AND LOCK BELOW 3352 WILL OPEN THE FOLLOWING BEARISH TARGET
3317
EMA5 CROSS AND LOCK BELOW 3317 WILL OPEN THE FOLLOWING BEARISH TARGET
3282
EMA5 CROSS AND LOCK BELOW 3282 WILL OPEN THE FOLLOWING BEARISH TARGET
3233
EMA5 CROSS AND LOCK BELOW 3233 WILL OPEN THE SWING RANGE
3185
3146
As always, we will keep you all updated with regular updates throughout the week and how we manage the active ideas and setups. Thank you all for your likes, comments and follows, we really appreciate it!
Mr Gold
GoldViewFX

XAU/USD) 3 top technical analysis Read The ChaptianSMC trading point update
Technical analysis (XAU/USD) on a 4-hour timeframe, with key elements and potential price scenarios illustrated. Here's a breakdown of the idea behind this analysis:
---
1. Key Levels and Zones
Resistance Zone (~3,320–3,330):
Marked with red arrows indicating multiple rejections.
A crucial supply zone that the price failed to break several times.
Support Zone (~3,280–3,290):
Labeled as “nak support level” (likely means "neckline" support in a possible head-and-shoulders structure or just a key level).
Important for bullish structure continuation.
Lower Target Zone (~3,205):
A demand zone if the support fails.
Labeled as another “target point” indicating a bearish projection.
---
2. Trend Context
The price was in an upward channel (highlighted as "up trend"), which has now been broken.
EMA 200 (~3,251) is acting as a dynamic support.
---
3. Potential Scenarios
Bullish Scenario (Red/Blue Arrows Up):
If the price holds the “nak support level” and breaks back above resistance (~3,320):
A bullish move toward 3,367 and even 3,435 is expected.
The blue arrow shows a projected upside target of ~105 points.
Bearish Scenario (Black Arrow Down):
If the price breaks below the neckline/support and EMA 200:
A drop toward the 3,205 area is anticipated.
Target aligns with previous structure lows and a clean demand zone.
---
4. RSI Indicator (Bottom Panel)
RSI is hovering around neutral (~45–50), offering no strong momentum bias.
Could support either a bounce or a breakdown, depending on upcoming moves.
Mr SMC Trading point
---
Conclusion / Idea Summary
This chart presents a conditional trade setup:
Above 3,320: Long toward 3,367–3,435.
Below 3,280–3,250 (and EMA 200): Short toward 3,205.
The market is currently at a decision point, and traders should wait for confirmation (breakout or breakdown) before entering a trade.
Pales support boost 🚀 analysis follow)

Will Trump's Tariffs Propel Gold Past 3,500 ? Again ? On May 23rd's U.S. trading session, Trump's tariff announcements on the EU and Apple roiled markets like a tempest 🌪️. He proposed a staggering 50% tariff on EU products starting from June 1st, citing unfair trade practices. Meanwhile, he threatened Apple with a 25% tariff if iPhones sold in the U.S. weren't manufactured domestically.
This sent gold prices soaring sky - high 🚀. As a reliable safe - haven, gold spiked as investors, deeply worried about the potential global economic impacts, rushed to safeguard their wealth. The 3280 support level for gold, which had been holding firm in the preceding days, became even more crucial as the upward momentum strengthened, like a sturdy anchor in stormy waters ⚓.
If the tariff issue remains unresolved and tensions continue to simmer between the U.S., the EU, and major corporations like Apple, the upward trajectory of gold prices is likely to persist. Analysts predict a good chance it could break the 3,500 mark, as if a new peak is waiting to be conquered 🏔️. Tariffs disrupt global supply chains and raise U.S. inflation fears, driving investors to gold for protection against economic and currency risks, much like sailors seeking a safe port in a typhoon 🌊.
⚡️⚡️⚡️ XAUUSD ⚡️⚡️⚡️
🚀 Buy@ 3340 - 3360
🚀 TP 3400 - 3450
Accurate signals are updated every day 📈 If you encounter any problems during trading, these signals can serve as your reliable guide 🧭 Feel free to refer to them! I sincerely hope they'll be of great help to you 🌟 👇

Gold: Bullish Flag Formation Suggests Further Upside Potential Hello guys, let's dive into Gold analysis!
Gold is currently forming a bullish flag pattern, a continuation formation that typically follows a strong upward impulse (flagpole). After a sharp rally, the price consolidated within a downward channel, creating the classic flag structure.
🔍 Technical Breakdown:
Flagpole: The strong bullish rally in early April marks the beginning of the uptrend.
Flag (Channel): Price has corrected in a downward-sloping channel, respecting both upper and lower bounds, creating a textbook flag pattern.
Breakout Zone: Price is now testing the upper boundary of the flag. A confirmed breakout above this resistance would signal a continuation of the prior uptrend.
🎯 Price Targets:
First Target: Around $3,445, which aligns with the measured move from the breakout point.
Second Target: Around $3,725, representing full flagpole projection from the breakout zone.
📌 Key Levels to Watch:
Breakout Confirmation: A strong 4H close above the flag’s upper boundary (~$3,260) with volume confirmation would validate the pattern.
_____________________________________
Invalidation: A rejection from the resistance and a fall below the channel may delay the bullish scenario, potentially retesting lower support around $3,090.
📊 Conclusion:
This setup favors bulls, but patience is key. Traders may consider waiting for a clear breakout and retest for safer long entries, aiming for the outlined targets.

GOLD NEXT MOVE (expecting a mild correction now)(26-05-2025)Go through the analysis carefully and do trade accordingly.
Anup 'BIAS for the day (26-05-2025)
Current price- 3336
"if Price stays below 3350, then next target is 3326, 3315, 3300 and 3285 and above that 3370 ".
-POSSIBILITY-1
Wait (as geopolitical situation are worsening )
-POSSIBILITY-2
Wait (as geopolitical situation are worsening)
Best of luck
Never risk more than 1% of principal to follow any position.
Support us by liking and sharing the post.

GOLD ROUTE MAP UPDATEHey Everyone,
Please see the update on our 1H chart route map - playing out exactly as analysed.
We started the week with a bearish gap at 3352 being hit, followed by an EMA5 cross and lock below 3352, which opened up the next level at 3317, also hit perfectly.
Yesterday, we found support above the 3282 retracement level, leading to a solid bounce into 3317. However, there was no EMA5 lock above 3317, and price faced rejection today once again, pushing it back toward 3282.
We are now looking for support to hold above 3282 to give us fresh bounce opportunities and upper Goldturn tests. However, a lock below 3282 will open up lower levels as we move deeper into the retracement range.
We are expecting continued reactions within this retracement range, in line with our plan to buy dips. Our updated levels and weighted levels help us track downward movements and catch bounce setups.
We'll continue to buy dips using our key support levels, targeting 20 to 40 pip moves. As always, each level structure provides consistent bounce zones, offering great opportunities for both entry and exit. If you backtest the levels we’ve shared every week over the past 24 months, you’ll see how effectively they work with or against short to mid term swings and trends.
Remember:
Swing ranges yield bigger bounces than weighted levels — that’s the key difference.
BULLISH TARGET
3389
EMA5 CROSS AND LOCK ABOVE 3389 WILL OPEN THE FOLLOWING BULLISH TARGETS
3428
EMA5 CROSS AND LOCK ABOVE 3428 WILL OPEN THE FOLLOWING BULLISH TARGET
3478
EMA5 CROSS AND LOCK ABOVE 3478 WILL OPEN THE FOLLOWING BULLISH TARGET
3517
BEARISH TARGETS
3352 - DONE
EMA5 CROSS AND LOCK BELOW 3352 WILL OPEN THE FOLLOWING BEARISH TARGET
3317 - DONE
EMA5 CROSS AND LOCK BELOW 3317 WILL OPEN THE FOLLOWING BEARISH TARGET
3282
EMA5 CROSS AND LOCK BELOW 3282 WILL OPEN THE FOLLOWING BEARISH TARGET
3233
EMA5 CROSS AND LOCK BELOW 3233 WILL OPEN THE SWING RANGE
3185
3146
As always, we’ll keep you all updated with real time analysis and management of active setups throughout the week. Thank you for your continued support, your likes, comments, and follows mean a lot!
Mr Gold
GoldViewFX

HelenP. I Gold may break trend line and continue to fallHi folks today I'm prepared for you Gold analytics. The trend line on this chart has consistently acted as a dynamic support for price, with multiple clean rebounds confirming its strength. As the price continued respecting this diagonal line, the structure gradually began tightening, forming a large symmetrical triangle. This pattern suggests a buildup of pressure between buyers and sellers. Once inside the triangle, the price action turned more volatile, with higher lows pushing against a strong resistance zone around the 3365 - 3390 range. Despite multiple attempts to break through, the market failed to sustain any move above this level. Each rally was met with rejection, and bearish momentum slowly started to emerge. Recently, the price reached the upper boundary of the triangle and touched the resistance zone again, but it quickly pulled back without breaking out. Currently, Gold is trading close to the intersection of the resistance zone and the trend line, where a decisive move is likely to occur. Given the weakening bullish momentum and the triangle’s narrowing formation, I expect the price to exit the pattern to the downside. A break of the trend line may trigger stronger selling, leading to a move toward the 3225 level - my current goal based on this potential bearish breakout. If you like my analytics you may support me with your like/comment ❤️
Disclaimer: As part of ThinkMarkets’ Influencer Program, I am sponsored to share and publish their charts in my analysis.

GOLD About To Develop a WXYXZ PatternGOLD About To Develop a WXYXZ Pattern
GOLD it's a very risky trade as we have seen it often rising in days without news or without volume in the market.
However, the previous week gold reached 3365 and looks like the top was already completed.
Trump's decision to impose 50% tariffs also for Europe made gold bouce on Friday.
The current situation looks more stable. As we have seen already, Trump doesn't want to increase tariffs but to reach deals that are better for the US.
US and Europe will resume talks soon and this news improved the market sentiment for a slight sell-off on GOLD.
The chances are that this was the first movement, and a bigger wave may happen. I don't like gold shorts too much due to the price that moves up often without any clear reason.
The pattern this time is showing the possiblitity that it may expand in a large WXYXZ pattern and we could be on the Z wave as shown on the chart.
Targets: 3285 ; 3250; 3170 and 3100
You may find more details in the chart!
Thank you and Good Luck!
❤️PS: Please support with a like or comment if you find this analysis useful for your trading day❤️
