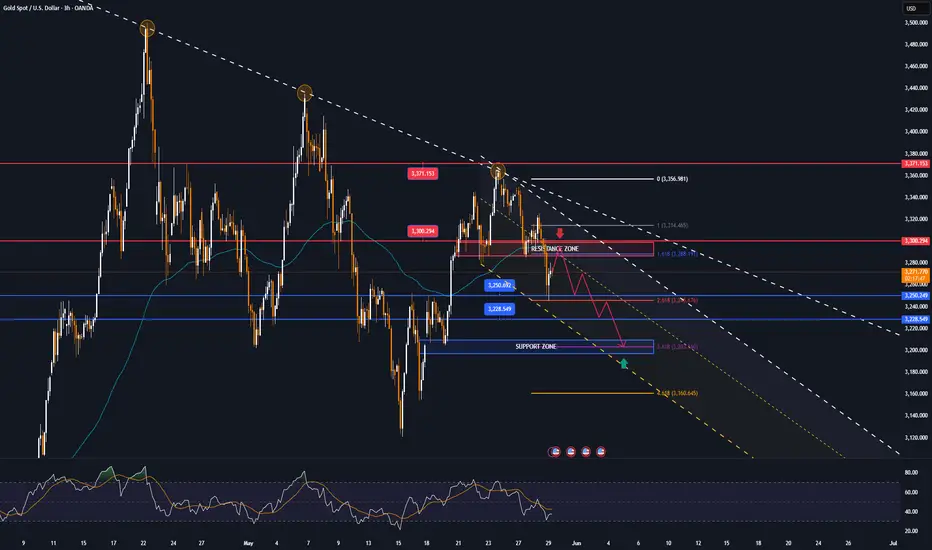
GOLD potential Reversal Structure in SightGold has completed a 5-wave impulsive structure and is currently trading within the supply zone around its all-time high ($3,500). Price action suggests exhaustion, and unless a new ATH is formed, a macro correction is likely to begin soon.
Key levels to monitor remain the Immediate Demand Zone $2,750 – $2,900 and this may offer short-term support with Main Demand Zone (Strong Buyback Area) $2,530 a critical level for potential re-accumulation and long-term re-entry. Moreover, the invalidation occur when Bullish bias resumes only if price breaks and closes above $3,500.
Break of the ascending trendline will confirm a deeper corrective leg, likely toward the main demand. This structure offers a clear medium to long term roadmap watch for confirmation before positioning.
GOLDCFD trade ideas

THE KOG REPORTTHE KOG REPORT:
In last week’s KOG Report we said we would be looking for the price to attempt the higher resistance level shown on the chart which was slightly higher than the red box. We wanted this level to reject price and give us the move down into the level which was shown on the chart. As you can see this move worked from the open, respecting the red box active level instead and completing all the bias level bearish targets in one swoop after the break.
We then updated the KOG Report with the move we wanted in order to then long into immediate resistance to again test the short trade, which again worked while we suggested traders look for the lower red box levels to attempt the long trades.
There was slight stretch again downside, but those red boxes played their part giving us the move on confirmation for the longs towards the end of the week, ending the week on a high.
It was a difficult week to trade with aggressive movement across the markets, however, the levels are reacting well and although there is a stretch on price, we’re getting the movement we want.
So, what can we expect in the week ahead?
We have key level now on the daily also aligning with the EMA50 at 3162 on the daily chart, while that 4H shows us a possible reversal on the flip. For this reason we have given the immediate red box levels of 3225-30 resistance and 3190-85 support. We have also plotted the potential range of play for the early part of the week, where we feel price may stabilise until a further move.
We’re looking for two possible moves here, one in order to continue to short and then look for the longer trade lower down, or, a break of the red box and bias level into higher resistance upon which we’ll trade level to level and then look higher for a potential short again. The bias level for this week has a huge extension of the move so it will be tradeable both directions. We have applied filters to the algo which is under test so we’ll also want to see if that works in our favour.
So, for now, support below can give us the move into the 3225-30 region which is the level to watch for the break, if rejected there may be an opportunity to short but that short must break below the 3185 level to continue and complete the move downside into the 3150-55 and below that 3130 levels. That’s where we feel the opportunity to long for the swing may come from but please remember, it’s changed structure until we break and hold above the 3265 level. That will be this week’s key level.
KOG’s bias of the week:
Bearish below 3235 with targets below 3196, 3185, 3177, 3165 and 3155
Bullish on break of 3230 with targets above 3242, 3250, 3255 and 3262
RED BOXES:
Break above 3210 for 3118, 3220, 3225, 3230, 3235 and 3247 in extension of the move
Break below 3195 for 3187, 3179, 3165, 3155, 3150 and 3137 in extension of the move
Please do support us by hitting the like button, leaving a comment, and giving us a follow. We’ve been doing this for a long time now providing traders with in-depth free analysis on Gold, so your likes and comments are very much appreciated.
As always, trade safe.
KOG

XAUUSD Monthly Outlook – May 2025👋 Hey GoldMindsFX!
🕰️ Timeframe: Monthly
📍 Current Price: 3,204
📈 Bias: Cautious Bullish-to-Neutral
📏 Trend: Strong long-term bullish, but in monthly exhaustion/cool-off mode
🔍 STRUCTURAL OVERVIEW
BOS (Break of Structure): Confirmed above 2,075 (2020/2022 key resistance).
Rally: Sustained higher highs and strong bullish candles since October 2023.
Current Candle: Huge wick into FIB extension (1.618–2.0) = 3,440–3,500 (top-out risk).
🧠 KEY MONTHLY LEVELS TO WATCH
Type/Zone Price Range Quick Note
🔴 Premium Supply 3,440–3,500 FIB extension (1.618–2.0), big rejection wick, bull exhaustion
🟠 Resistance 3,222–3,242 Prior OB + last BOS area, possible retest zone
⚠️ Mid-Zone 3,160–3,185 Equilibrium, liquidity trap, key short-term support
🟢 Demand 3,050–2,960 Big monthly OB + FVG, unmitigated base, strong support
🔵 Discount 2,950–2,800 Previous reaccumulation, structure demand from 2023 rallies
🗺️ MACRO & MARKET CONTEXT
Geopolitical Tension: Wars, inflation, and Fed confusion (CPI/UoM).
Market Mood: Sentiment weak, uncertainty high after May FOMC & Powell.
Central Bank Flow: Dips bought, but profit-taking near highs — “wait and react” mode.
🧭 SCENARIOS FOR MAY
Bullish Plan: If price holds above 3,160–3,185 ➔ look for re-entry toward 3,240 and possible retest of upper wicks (3,440+).
Needs H4 CHoCH + volume for confirmation.
Bearish Plan: Lose 3,160 ➔ look for a drop toward 3,050–2,960. If that fails, watch for deeper retrace to 2,800–2,950.
⚙️ FIBONACCI EXTENSION SUMMARY
1.272: ✅ Hit
1.618: 3,440 (Tapped)
2.0: 3,500 (Wick/Exhaustion)
🧠 FINAL WORD
Gold’s monthly “moonshot” stalled at 3,500 — don’t chase, just watch how price reacts to the 3,160–3,185 key range.
Lose it? Expect deeper cool-off.
Hold it? Reload for one more push toward the highs.
Stay focused, trade smart, and let structure guide your next moves!
Drop a comment if you want the weekly/daily breakdowns.
— GoldFxMinds (GoldMindsFX)

GOLD 1H CHART ROUTE MAP UPDATEHey everyone,
Please see update on our 1h chart idea.
After completing our Bullish targets yesterday, at 3236 and 3278; we stated that we would look for ema5 to lock above 3278 to open 3308.
- We got the lock above 3278, confirming 3308, which was hit perfectly today. We now have a ema5 cross and lock above 3308, opening the range above. Any rejections in this zone and we may see a retest of lower Goldturns for the usual weighted level bounces, inline with our plans to buy dips.
We will keep the above in mind when taking buys from dips. Our updated levels and weighted levels will allow us to track the movement down and then catch bounces up.
We will continue to buy dips using our support levels taking 20 to 40 pips. As stated before each of our level structures give 20 to 40 pip bounces, which is enough for a nice entry and exit. If you back test the levels we shared every week for the past 24 months, you can see how effectively they were used to trade with or against short/mid term swings and trends.
The swing range give bigger bounces then our weighted levels that's the difference between weighted levels and swing ranges.
BULLISH TARGET
3236 - DONE
EMA5 CROSS AND LOCK ABOVE 3236 WILL OPEN THE FOLLOWING BULLISH TARGETS
3278 - DONE
EMA5 CROSS AND LOCK ABOVE 3278 WILL OPEN THE FOLLOWING BULLISH TARGET
3308 - DONE
EMA5 CROSS AND LOCK ABOVE 3308 WILL OPEN THE FOLLOWING BULLISH TARGET
3343
EMA5 CROSS AND LOCK ABOVE 3343 WILL OPEN THE FOLLOWING BULLISH TARGETS
3373
EMA5 CROSS AND LOCK ABOVE 3373 WILL OPEN THE FOLLOWING BULLISH TARGETS
3418
BEARISH TARGETS
3184
EMA5 CROSS AND LOCK BELOW 3184 WILL OPEN THE FOLLOWING BEARISH TARGET
3146
EMA5 CROSS AND LOCK BELOW 3146 WILL OPEN THE SWING RANGE
3103
3069
EMA5 CROSS AND LOCK BELOW 3069 WILL OPEN THE SECONDARY SWING RANGE
3030
2981
As always, we will keep you all updated with regular updates throughout the week and how we manage the active ideas and setups. Thank you all for your likes, comments and follows, we really appreciate it!
Mr Gold
GoldViewFX

Selling pressure, gold price continues to fall below 3285?⭐️GOLDEN INFORMATION:
Gold prices declined by nearly 2% on Monday, slipping below the $3,300 mark, as investor sentiment improved following U.S. President Donald Trump’s decision to postpone tariffs on European Union imports. The renewed risk appetite, coupled with a modest rebound in the U.S. Dollar from last week’s losses, placed pressure on the non-yielding precious metal.
The move came after a weekend call between President Trump and European Commission President Ursula von der Leyen, which resulted in the U.S. deferring the planned 50% tariffs on EU goods until July 9. The development eased global trade concerns, prompting a shift away from safe-haven assets—excluding the Greenback—and helped propel global equity markets higher.
⭐️Personal comments NOVA:
Accumulated price zone around 3300, under selling pressure, mainly waiting for important economic news this week: GDP, FOMC
⭐️SET UP GOLD PRICE:
🔥SELL GOLD zone : 3363- 3365 SL 3370
TP1: $3352
TP2: $3340
TP3: $3325
🔥BUY GOLD zone: $3266- $3268 SL $3261
TP1: $3277
TP2: $3286
TP3: $3300
⭐️Technical analysis:
Based on technical indicators EMA 34, EMA89 and support resistance areas to set up a reasonable SELL order.
⭐️NOTE:
Note: Nova wishes traders to manage their capital well
- take the number of lots that match your capital
- Takeprofit equal to 4-6% of capital account
- Stoplose equal to 2-3% of capital account

Gold price accumulates above 3300, new week⭐️GOLDEN INFORMATION:
Gold (XAU/USD) faced some selling pressure around the $3,335 mark during Monday’s early Asian session, as easing trade tensions slightly dampened demand for the safe-haven asset. The recent softening in rhetoric surrounding global trade disputes has contributed to the metal’s pullback, though upcoming economic events could shift momentum.
On Sunday, US President Donald Trump announced a delay in imposing the proposed 50% tariffs on the European Union until July 9, easing fears of an imminent escalation in trade hostilities. This development has weighed on bullion prices by reducing immediate risk aversion in the markets.
Nonetheless, investor attention now turns to Wednesday’s release of the FOMC Minutes, which could offer further clarity on the Federal Reserve’s monetary policy outlook. Meanwhile, market participants will continue to monitor trade negotiations between the US and Japan, as well as other major economies. Any renewed tensions or setbacks in these discussions could quickly revive demand for gold as a protective hedge.
⭐️Personal comments NOVA:
Gold prices reacted slightly lower after the official announcement of tariff postponement. Accumulated above 3300
⭐️SET UP GOLD PRICE:
🔥SELL GOLD zone : 3388- 3390 SL 3395
TP1: $3376
TP2: $3363
TP3: $3350
🔥BUY GOLD zone: $3301- $3299 SL $3294
TP1: $3312
TP2: $3325
TP3: $3338
⭐️Technical analysis:
Based on technical indicators EMA 34, EMA89 and support resistance areas to set up a reasonable BUY order.
⭐️NOTE:
Note: Nova wishes traders to manage their capital well
- take the number of lots that match your capital
- Takeprofit equal to 4-6% of capital account
- Stoplose equal to 2-3% of capital account

GOLD consolidated below a key level on FridayGold is in a downtrend forming a counter-trend correction. Friday's trading session closes below the key level of 3203-3205. Buyers are weaker than sellers.
But, before the continuation of the fall MM is quite likely to test the resistance to provoke ordinary buyers before the fall
Scenario: the growth attempt may turn out to be false. A retest of 3203 resistance, a false breakout and price consolidation below 3203 is a sell signal.
Additional scenario: MM trap to provoke buyers to buy. A retest of the far resistance 3230, a false breakout and a price fixing below 3223 could start a decline

XAUUSD Weekly Outlook (May 26–30, 2025)👋 Hey GoldMindsFX Fam!
📍 Current Price: 3,358
🗓 Timeframe: Weekly
Bias: Bullish-with-caution, looking for first signs of real pullback or fresh squeeze.
🔍 REFINED WEEKLY STRUCTURE ZONES
Zone Type Price Range Context / Confluence
🟥 Premium Supply/FVG 3,480–3,515 Fibo 2.0 extension wick high, supply unmitigated, strong rejection risk if spiked.
🟪 Upper Trap / Reversal 3,415–3,440 FVG+OB combo, previous bull trap zone, micro liquidity sweep.
🟦 Mid-Resistance / S/R Flip 3,375–3,388 Weekly PA reaction (last close rejection zone), possible magnet for news-driven retests.
🟩 Demand/Support #1 3,250–3,265 Clean OB + FVG, demand that sent price to new high, SMC structure confirmed here.
🟩 Demand/Support #2 3,172–3,188 Weekly demand, liquidity sweep (post-CPI), reaction base before latest impulse up.
🟦 Discount Block 3,065–3,100 Last unmitigated OB + FVG combo, only reached if sentiment reverses heavy or big news shock.
📈 Trend, PA & RSI Insights
Trend: Bullish, but big wicks + RSI divergence suggest a pause is near.
Price Action: Last impulse is losing steam; lots of rejection wicks above 3,400. PA signals “distribution” up top.
RSI: Still overbought – ideal for fade setups if price enters supply.
Fibo Extensions:
1.618 tapped and rejected (3,440 zone)
2.0 = 3,515 (major upper limit for May unless new shock)
🌍 Macro/News Context
Geopolitics: Ongoing tension (Ukraine, Middle East), central bank gold demand, China accumulating, hot US inflation.
Market feels nervous: Powell’s last speech + CPI/UoM confusion = chop and volatility spikes possible.
Watch for fakeouts on news spikes into upper zones.
🧠 Key Takeaway
Bulls: Only strong above 3,388 close, but risk of traps grows with each spike.
Bears: Look for rejection/CHoCH above 3,440–3,480. If 3,250 breaks, 3,170–3,100 opens fast.
⚡️ Weekly Gameplan (No SL/TP)
Premium POIs:
3,480–3,515: Extreme supply, reversal watch zone
3,415–3,440: Main liquidity trap for NY news
3,375–3,388: Magnet zone for intraday retests
Discount POIs:
3,250–3,265: Best bullish support on structure
3,172–3,188: Secondary demand, high bounce probability
3,065–3,100: Deep liquidity block for max FOMO shakeout
Stay sharp, don’t chase FOMO wicks. Let price come to your POI — and as always, flow with structure, not the hype.
Drop a 🔥 if you’re riding this weekly flow!
— GoldFxMinds (GoldMindsFX)

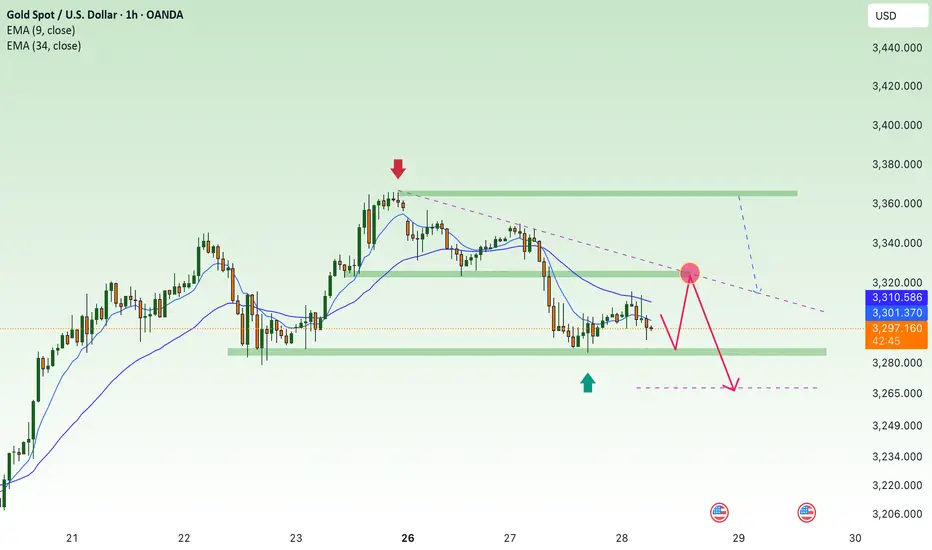
DeGRAM | GOLD under the $3300 level📊 Technical Analysis
● Third touch of the channel’s upper rail near $3 330 printed a shooting-star and price is now riding back under the internal trend-pivot $3 315, restoring a sequence of lower-highs.
● Intraday support from the short-lived wedge has flipped to resistance; acceptance below the $3 284 line exposes the mid-band $3 210 and, if momentum persists, the channel floor/April pivot at $3 120.
💡 Fundamental Analysis
● US 5-yr yield hit a five-week high after Fed’s Williams said policy is “not restrictive enough yet”, while the DXY held near 105 as May jobless claims surprised on the downside. Higher real rates and a firmer dollar keep ETF outflows running.
✨ Summary
Sell rallies ≤$3 315; breakdown under $3 284 targets $3 210 then $3 120. Shorts negated on a 4 h close above $3 350.
-------------------
Share your opinion in the comments and support the idea with a like. Thanks for your support!

Lingrid | GOLD Potential Near-Term BULLISH MomentumOANDA:XAUUSD is attempting to stabilize just above the $3,208 zone after forming a lower low inside the downward channel. Price is compressing between the support base and descending trendline, signaling potential for breakout if buyers reclaim $3,225. A successful retest and push above this level could trigger a rally toward $3,285. Bulls will likely remain in charge if the structure holds above $3,208.
📈 Key Levels
Buy zone: 3,208 – 3,225
Buy trigger: breakout and hold above descending trendline
Target: 3,285
Sell trigger: drop below 3,208
💡 Risks
Fed comments or rate surprises may jolt gold direction.
Sharp rebound in USD could undermine gold recovery.
Rejection from trendline may resume the bearish structure.
Traders, if you liked this idea or if you have your own opinion about it, write in the comments. I will be glad 👩💻

Gold isn't breaking out — it’s breaking down.What we're seeing in gold right now is not a temporary pause — it's a calculated, smart money-driven transition from impulsive expansion into controlled redistribution. The rally from 3120 to 3357 wasn’t organic or trend-based — it was mechanical, steep, and uncorrected. And that’s the first red flag. When price travels that far without building any real base or demand, it’s often not aiming for continuation, but to reach a liquidity target. This was a liquidity run, not a sustainable breakout.
Then comes May 24 — a pivotal moment. Price breaks above 3357, spikes volume +19% over average — but delivers a weak candle body. The next bar doesn’t confirm, doesn’t expand, doesn’t even push the high. Instead, we get a failed breakout followed by retreat. That’s textbook deviation — a classic trap where market makers dump inventory while retail rushes to chase the breakout.
This happens inside the derivation area — that thin, deceptive range between 3357 and 3370. It’s where distribution is masked as strength. But price behavior reveals the truth: after tapping that zone, it didn’t hold. Price fell back inside the range. No retest. No follow-through. And most importantly — price has now closed beneath the anchored VWAP from May 13, shifting the control of the tape.
Anchored VWAP matters — it's the average weighted cost of the dominant positioning from smart money. And once price falls below it and stays there, we know demand has dried up. Add to that: shrinking candle ranges, decreasing volume, soft closes — all signs of exhaustion. RSI has already pulled off from overbought levels, Stochastic is turning down, and ADX shows trend strength fading.
But those indicators are just the shadow of what price already told us. We’ve lost structure. A lower high is forming. Price was rejected from the same zone that was previously supposed to be the breakout. It’s not consolidation anymore — it’s redistribution.
The path forward is tactical and logical. Price is likely headed first toward 3275 — that’s the shallow liquidity pocket. From there, we might get a pullback to 3305–3315 — not a rally, but a retest of the old sell zone. That’s where another leg of short interest can build. Then comes 3250 — the bottom of the last structural block. If that fails to hold, gold opens the door to 3205–3215 — a historical volume shelf and the next real support.
There’s no guessing here. The breakout failed. VWAP is broken. Momentum is gone. This isn’t the start of something higher — this is the start of the unwind. And while retail waits for 3400, smart money is already loading their next leg short.

DeGRAM | GOLD reached the resistance line📊 Technical Analysis
● Twin rejections inside the 3 300-3 340 supply, exactly where the purple retest line and rising-channel ceiling intersect, have carved a lower high and completed a bearish flag.
● RSI confirms negative divergence and the candle body is back below the 3 284 pivot, favouring a slide toward the channel median at 3 172 and, if broken, the floor/September swing low near 3 100.
💡 Fundamental Analysis
● Upbeat US second-estimate GDP and stronger durable-goods orders pushed 2-yr Treasury yields above 5 %, raising gold’s carry cost, while WGC logs a sixth straight week of ETF outflows and the PBoC reportedly paused reserve buying in May.
✨ Summary
Short below 3 300; objectives 3 172 → 3 100. Invalidate on a sustained close above 3 350.
-------------------
Share your opinion in the comments and support the idea with a like. Thanks for your support!


Gold is under pressure in the short term, sell!This wave of large-range sweeps that started on April 17 formed a large channel, and the price once again touched the lower track of the channel, forming a bottoming-out recovery.
This is also the reason why I insist on selling at a high price recently. The space budget is about 200-300 US dollars, which is the weekly level sweep space
Go to the lower track of the channel to consider recovering the space of 200-300 US dollars
Go to the upper track of the channel to consider recovering the space of 200-300 US dollars
The most recent one is the rise formed by touching the 3120-3121 area. As of the current sprint to the 3366 area, the rise is about 245 US dollars
And it continues to hover at the upper track of the channel. Is it a new beginning? It also needs to break through the key support defense line
The corresponding is the hourly chart double line, the four-hour lifeline and the daily lifeline
Specifically:
1. The hourly chart double line position is now in the 3306-3270 area. After the price broke through the double line, it used the double line lower track (purple trend line) as suppression and continued to fall and break low
Then after breaking through the double line, it turned into support, especially after breaking through the repeatedly suppressed purple trend line position 3250, forming an accelerated sprint, and the space range exceeded 100 US dollars
Then the purple trend line position, as the space switching line position, the subsequent space breakthrough will achieve at least 100 US dollars of space switching
Now this position is 3270, the distance is a little far, mark it first!
2. The four-hour lifeline is now at 3323. After the price surged, there was no increase in volume and acceleration. Instead, it continued to surge and fall. The four-hour pattern also began to close. The lifeline position is the dividing line. The double-line lower track and the pattern lower track are superimposed in the 3283 area. Special attention should be paid to it. Together with the 3270 position of the hourly chart, it will become the space switching point for the subsequent market. 3. Interestingly, the daily lifeline is in the 3286 range, which is also the low point in the second half of last week and the final support point determined by the retracement. Multiple supports are superimposed here, which means that the subsequent price can fall below this point, and the space will be switched.
4. Sweep in the short-term blue channel range. After standing above 3330-3332 again last Friday, the upward increase was expanded to find the upper rail of the channel, which is also the upper rail of the large range, at 3366. After confirming the resistance, it fell back again.
The current channel range is 3366-3306, with the middle acceleration point at 3340 area. This is used as the boundary. The suppression is successful and falls back below 3330. The area to look for is 3306-3300, followed by 32 96 (the excess range is 3288)
Then we need to pay attention to the area below 3288 mentioned in the above three points. This area will either not be given, or when it is really given, it is likely to be directly broken through, and then find the purple trend line position 3270 range
In summary, for the next gold, first consider the small blue channel range of 3366-3306, and use 3340 as the dividing line to switch space
Secondly, if it rises again and breaks 3366, the next resistance is 3386 to continue to sweep the high range
Finally, it is possible to suppress the area below 3306, and gradually break through the low point area of 3286-3288. If it successfully breaks through, the bears will start to recover the lost ground.
Referring to this idea, choose to continue to maintain the idea of high altitude. The current short position of 3349-3347 is under pressure to fall to the 3332 area. It can be harvested in the short term. The small band continues to hold the principal loss and look down to the 3320-3310 area.
In the short term, continue to pay attention to the short position of 3340-3342, stop loss 3349, target 3320-3310!

DeGRAM | GOLD moving in the range📊 Technical Analysis
● Rebound has met triple confluence: the H4 rising-wedge apex, the red 3 300-3 350 supply, and the roof of the broader descending channel – the same zone that capped rallies on 7 & 9 May.
● Bearish divergence appears on RSI while the wedge’s base is rising toward 3 284; a 4 h close beneath it should unlock the channel mid-line/blue trend support at 3 172, then the floor near 3 100.
💡 Fundamental Analysis
● US data stay firm – weekly jobless claims held near 227 k and May flash PMIs beat consensus, keeping 2-yr yields parked just under 5 % and the dollar bid.
● World Gold Council notes a fifth straight week of ETF outflows as higher opportunity cost dents investment demand.
✨ Summary
Fade strength inside 3 300-3 350; wedge breakdown < 3 284 aims 3 172 → 3 100. Shorts invalidated on a sustained H4 close above 3 350.
-------------------
Share your opinion in the comments and support the idea with a like. Thanks for your support!

Gold rebound is weak, short at high levelYesterday, gold stabilized and rebounded in the 3290-3300 area as expected, and the rebound high reached 3325. Friends who bought in this area should have made money.
Judging from the situation of this rebound, the bullish momentum can be said to be relatively weak. With the current strength, the rebound will not go too far.
From the chart, the rebound high is gradually moving down, and the key support area of 3290-3300 below is very close, and there is a possibility of breaking through at any time. Once it breaks through, it will inevitably test 3250 and 3200.
I will not consider going long on gold. On the contrary, I think the risk of going short will be much smaller.

GOLD MARKET ANALYSIS AND COMMENTARY - [May 26 - May 30]This week, the price of OANDA:XAUUSD increased from 3,204 USD/oz to 3,365 USD/oz, and closed the week at 3,357 USD/oz.
The reason for the increase in gold price this week is due to:
🔹Moody's downgrades US credit rating, causing USD to fall.
🔹Unsuccessful US bond auction raises concerns about economic instability.
🔹President Trump threatens to raise tariffs on European goods, raising concerns about trade war.
🔹Escalating tensions in Ukraine, Middle East, increasing demand for safe haven gold.
Gold prices next week may fluctuate in both directions, meaning they will adjust and accumulate to wait for the results of US-China trade negotiations, US economic data, and whether Mr. Trump will decide to impose tariffs on Europe or not?
Next week, the US will release many important economic data, including:
➡️Durable Goods Orders (Tuesday),
➡️Minutes of the FED's May Policy Meeting (Wednesday),
➡️PCE Inflation Index (Friday).
With the Trump administration's tariff policy, inflationary pressures in the US have been under a lot of pressure. If the core PCE index in April increases more than expected, it may cause the FED to continue to keep interest rates unchanged at its July meeting. In this scenario, the USD may increase again, causing gold prices to be under pressure to adjust next week. However, gold prices next week will hardly decrease sharply if the PCE increases, because gold prices next week are still supported by other factors such as tariffs, geopolitical conflicts, etc.
📌Technically, on the H4 chart, gold prices are starting to break the Downtrend line and tend to move closer to the resistance level of 3432. Meanwhile, support is established around the dynamic resistance level of 3300. The gold price trend next week is likely to lean towards a slight increase scenario provided that the USD does not recover strongly and geopolitical tensions continue. However, investors need to be cautious with corrections due to profit-taking or sudden changes due to macroeconomic information. Gold prices next week may fluctuate in the range of 3300-3450.
Notable technical levels are listed below.
Support: 3,300 – 3,292 – 3,250USD
Resistance: 3,371 – 3,400 – 3,435USD
SELL XAUUSD PRICE 3451 - 3449⚡️
↠↠ Stop Loss 3455
BUY XAUUSD PRICE 3299 - 3301⚡️
↠↠ Stop Loss 3295

GOLD Trade Plan 27.05.2025Dear Traders,
The 3360 resistance was not broken, and gold dropped 800 pips from the top. I expect the price to fall to around the 3240–3260 area, and if the decline continues, we will enter a bearish phase with a target of 3000.
if you enjoyed this forecast, please show your support with a like and comment. Your feedback is what drives me to keep creating valuable content."
Regards,
Alireza

US court blocks Trump tax plan, GOLD falls sharplyOANDA:XAUUSD was sold off heavily in early morning trading on Thursday (May 29), with the price of gold falling to around $3,246/ounce, down more than $40 on the day.
Bloomberg reported that gold prices fell for the fourth consecutive day as the market digested news that a US trade court had blocked Trump's global tariff program. Gold prices fell 2% in the previous three trading days.
On Wednesday local time, a US federal court blocked the tariff policy announced by US President Trump on April 2, "Liberation Day", and ruled that Trump exceeded his authority and imposed comprehensive tariffs on countries that export more to the United States than they import.
The Court of International Trade in Manhattan said the US Constitution gives Congress the exclusive power to regulate trade with other countries, and the emergency powers the president declared to protect the US economy do not override those powers.
The lawsuit was filed by the Liberty Center for Justice, a non-profit, nonpartisan litigation organization in the United States, on behalf of small American businesses affected by the tariffs. It is the first major legal challenge to Trump’s tariff policies.
The U.S. Court of International Trade has ruled that most of Trump’s tariffs are illegal, sending the dollar even higher. A stronger dollar makes gold less attractive to buyers of safe-haven assets.
The Trump administration has filed a notice to appeal the ruling. The US Supreme Court is likely to have the final say in the landmark case, which could affect trillions of dollars in global trade.
The court's ruling dealt a blow to a pillar of the Republican Party's economic agenda and could reduce gold's appeal as a safe-haven asset.
Technical Outlook Analysis OANDA:XAUUSD
On the daily chart, gold will recover soon after falling to the important support level of 3,250 USD, note that you have read in the previous issues. However, falling below the Fibonacci 0.382% level with EMA21 is a negative signal for bullish expectations as this area becomes the nearest resistance.
But overall, gold is still in an uptrend with the channel as the main trend. Meanwhile, the Relative Strength Index (RSI) is approaching the nearest support at 50, an upward bend from this level would be considered a positive signal in terms of momentum.
As long as gold remains in/above the channel, I remain bullish and the notable positions are listed below.
Support: 3,250 – 3,228 USD
Resistance: 3,392 – 3,300 – 3,371 USD
SELL XAUUSD PRICE 3292 - 3290⚡️
↠↠ Stop Loss 3296
→Take Profit 1 3284
↨
→Take Profit 2 3278
BUY XAUUSD PRICE 3203 - 3205⚡️
↠↠ Stop Loss 3199
→Take Profit 1 3211
↨
→Take Profit 2 3217
Gold: supported by EU trade tariffsThe US-China tariffs tensions were settling down, however, new tensions emerged with a potential 50% tariffs on US imports from the European Union. Although news was negative for US equity markets and the value of US Dollar, it supported the price of gold to trade at higher grounds. The gold surged by 2% on Friday, ending the week at the level of $3.357. In addition, analysts are noting that the US House of Representatives adopted a tax and spending bill, which is supposed to add trillions of dollars to the US already significant debt. This is another reason why investors are eyeing gold as a safe-haven asset at this moment.
During the week the RSI again turned to the upside, ending the week at the level of 58. Based on charts, it seems that this indicator is eyeing again the overbought market side. Moving averages of 50 and 200 days are still moving without any change - as two parallel lines with an uptrend.
As long as the narrative over trade tariffs is active by the US Administration, the price of gold will be supported. As many times previously noted, markets are not happy with insecurity. Gold has for many centuries been a safe-haven asset, and it will continue to perform its basic role. As per current charts, there is some probability that the price might revert just a bit on Monday's trading session, which will mark a profit-taking from Friday's trading. The possible lower level is somewhere around $3.280. As long as uncertainty is active on the market, lower grounds of gold should not be expected. On the opposite side, the next potential level might be $3.430, marking highs from the beginning of May and mid-April this year.

XAUUSD How VIX points to a Gold Bear Cycle.Gold (XAUUSD) may be on a 5-week correction but on the long-term it remains within a Channel Up since the October 31 2022 Low. That was essentially when its Bear Cycle ended and the new Bull Cycle (Channel Up) started.
The previous Bull Cycle stopped 4.5 months after the Volatility Index (VIX) shown in blue, peaked during the March 2020 COVID flash crash.
We are now on a similar situation as VIX topped on the week of March 31 2025 during the Trade War and has already started to decline aggressively.
In symmetrical terms, we could be around the end of May 2020 on Gold's last short-term pull-back before the final rally to the August 03 2020 Top (where its Bear Cycle started).
As a result, according to this correlation, we may see Gold forming a Bull Cycle Top by the end of July (2025) and then start a new +2 year Bear Cycle.
-------------------------------------------------------------------------------
** Please LIKE 👍, FOLLOW ✅, SHARE 🙌 and COMMENT ✍ if you enjoy this idea! Also share your ideas and charts in the comments section below! This is best way to keep it relevant, support us, keep the content here free and allow the idea to reach as many people as possible. **
-------------------------------------------------------------------------------
💸💸💸💸💸💸
👇 👇 👇 👇 👇 👇

GOLD 1H CHART ROUTE MAP UPDATEHey everyone,
It’s been another piptastic day in the markets with our 1H chart setup playing out beautifully.
We began with our bullish target at 3236, which was successfully hit. This was followed by EMA5 cross and lock that opened 3278, also reached perfectly. The entire range played out smoothly, giving ample time after confirmation for entries.
Looking ahead, we’ll be watching for an EMA5 cross and lock above 3278, which could open the path to 3308. A further lock above 3308 would open the potential for extended upside.
However, if price fails to lock above these key levels, we may see a retest of lower Goldturns for a potential bounce.
We will keep the above in mind when taking buys from dips. Our updated levels and weighted levels will allow us to track the movement down and then catch bounces up.
We will continue to buy dips using our support levels taking 20 to 40 pips. As stated before each of our level structures give 20 to 40 pip bounces, which is enough for a nice entry and exit. If you back test the levels we shared every week for the past 24 months, you can see how effectively they were used to trade with or against short/mid term swings and trends.
The swing range give bigger bounces then our weighted levels that's the difference between weighted levels and swing ranges.
BULLISH TARGET
3236 - DONE
EMA5 CROSS AND LOCK ABOVE 3236 WILL OPEN THE FOLLOWING BULLISH TARGETS
3278 - DONE
EMA5 CROSS AND LOCK ABOVE 3278 WILL OPEN THE FOLLOWING BULLISH TARGET
3308
EMA5 CROSS AND LOCK ABOVE 3308 WILL OPEN THE FOLLOWING BULLISH TARGET
3343
EMA5 CROSS AND LOCK ABOVE 3343 WILL OPEN THE FOLLOWING BULLISH TARGETS
3373
EMA5 CROSS AND LOCK ABOVE 3373 WILL OPEN THE FOLLOWING BULLISH TARGETS
3418
BEARISH TARGETS
3184
EMA5 CROSS AND LOCK BELOW 3184 WILL OPEN THE FOLLOWING BEARISH TARGET
3146
EMA5 CROSS AND LOCK BELOW 3146 WILL OPEN THE SWING RANGE
3103
3069
EMA5 CROSS AND LOCK BELOW 3069 WILL OPEN THE SECONDARY SWING RANGE
3030
2981
As always, we will keep you all updated with regular updates throughout the week and how we manage the active ideas and setups. Thank you all for your likes, comments and follows, we really appreciate it!
Mr Gold
GoldViewFX

Gold Trade Plan 29/05/2025Dear Traders,
Gold has strongly broken through the 3290 zone and is currently fluctuating around the 3300 level. As long as the price remains below 3325, the bearish scenario toward 3200–3140 remains valid. However, if the 3325 zone is broken, we will enter a bullish wave aiming for the previous high.
if you enjoyed this forecast, please show your support with a like and comment. Your feedback is what drives me to keep creating valuable content."
Regards,
Alireza!
