XAUUSD 4H | Symmetrical Squeeze Breakout Incoming – Bearish Bias📉 Description:
Gold is currently consolidating at the apex of a descending triangle / symmetrical squeeze, hovering between dynamic resistance from the EMA 20 and a confluence of horizontal supply + trendline.
We’re seeing repeated rejections near $3,300, and price is now sitting below both the 20 EMA and the 68 EMA, showing a shift in short-term momentum.
I’m watching for a clean break and close below $3,285, which could trigger a sharp move toward the next demand zone around $3,203. That zone also aligns with the lower white trendline support, offering a possible bounce or continuation target.
⸻
🔧 Confluences:
• Trendline resistance + horizontal supply
• EMA 20 and 68 compressing price
• Lower highs forming with no bullish momentum
• Bearish engulfing candle rejection near $3,300
• Symmetrical wedge breakout setup
⸻
📍Bias: Bearish
📉 Entry Trigger: Break + close below wedge + MA zone
🎯 Target: $3,203
📛 Invalidation: Clean break back above $3,300 structure
GOLDCFD trade ideas

XAUMO Liquidity MAP🟡 XAU/USD Liquidity Map - June 2nd Battle Plan 🟡
Here’s my advanced liquidity projection for GOLD (XAU/USD) for Monday, June 2nd — fully aligned with institutional order flow, stop hunt zones, and smart money positioning.
⸻
💥 Key Zones Explained:
🔵 Deep Buy Liquidity Zone (3282.50 - 3285.50):
Where smart money is building long positions. If price dips into this zone, I expect aggressive buying to step in.
🟢 Buy Accumulation Zone (3286.50 - 3292.50):
Main support area — market makers accumulating positions while retail traders hesitate. This zone often acts as a springboard for upside moves.
🟡 First Trap Zone / Short Stop Hunt Zone (3300 - 3305):
The perfect bull trap zone — price may spike into this level during NY session to trigger breakout buyers, before smart money flips short.
🔴 Hard Resistance / Short SL Zone (3317.55):
The upper wall of liquidity — if price breaks above here, shorts are invalidated and bulls will likely dominate toward higher targets.
⸻
🎯 The Playbook:
✅ Long setups triggered inside the blue & green zones
✅ Short setups triggered inside the yellow trap zone
✅ All setups are built based on liquidity sweeps, Fibonacci extensions, and volume profile analysis.
⸻
⚠ Caution:
Monday sessions often begin with manipulative moves. Patience is key. Let liquidity do the work — don’t chase price, let price come to you.
⸻
🔥 Full chart breakdown courtesy of my advanced liquidity modeling. If you find this valuable — like, share & comment below 💬
👉 Let’s hunt the market, not follow it.

Elliott Wave Analysis – XAUUSD Trading Plan | June 2, 2025
🌀 Current Wave Structure
On the H1 timeframe, wave 2 (black) appears to have completed as a zigzag pattern, with price reacting strongly after touching the 3272 level — signaling that the abc corrective wave (green) may be finished.
Zooming into the M10 timeframe, the recent rally shows a 5-wave leading diagonal, indicating that wave 1 (red) is complete.
Currently, price is in the pullback phase of wave 2 (red).
📍 The ideal correction zone for wave 2 (red) is around 3281, which is our key area to look for Buy opportunities.
However, if price breaks below 3272, this wave count becomes invalid, and we’ll wait for a new setup aligned with deeper correction.
🔋 Momentum Outlook
• D1: Momentum is preparing to turn bullish ⇒ supports the start of wave 3 (black) and a bullish outlook for the week
• H4: Momentum is bottoming and about to reverse ⇒ supports wave 3 (red) forming in upcoming sessions
• H1: Currently declining ⇒ expect early-session pullback. Watch for bullish reversal signals as long as 3272 holds for potential entries
✅ Trade Setup
🎯 BUY ZONE: 3282 – 3279
🛑 Stop Loss: 3272
🎯 Take Profits:
• TP1: 3308
• TP2: 3324
• TP3: 3346
⏳ Note: Price action around the 3272–3281 zone will be key to confirming whether wave 2 (red) is complete.
If confirmed, wave 3 could begin with strong momentum — especially after breaking above 3296.

Trade Setup Idea (Gold - 4H TimeframeThis chart presents a potential long setup on Gold (XAU/USD) based on recent price structure and volume behavior. After a corrective phase, price is showing signs of recovery with a possible bullish continuation.
📈 Entry Level: Around 3,288
🎯 Take Profit 1: 3,350
🎯 Final Target: 3,405
🛑 Stop Loss: 3,250
The setup offers a favorable risk-to-reward ratio. Volume analysis also supports the potential for upward movement.
> This idea is for educational purposes only and not financial advice. Always do your own analysis before making trading decisions.

XAU/USD 29 May 2025 Intraday AnalysisH4 Analysis:
-> Swing: Bullish.
-> Internal: Bullish.
Analysis and bias remains the same as analysis dated 23 April 2025
Price has now printed a bearish CHoCH according to my analysis yesterday.
Price is now trading within an established internal range.
Intraday Expectation:
Price to trade down to either discount of internal 50% EQ, or H4 demand zone before targeting weak internal high priced at 3,500.200.
Note:
The Federal Reserve’s sustained dovish stance, coupled with ongoing geopolitical uncertainties, is likely to prolong heightened volatility in the gold market. Given this elevated risk environment, traders should exercise caution and recalibrate risk management strategies to navigate potential price fluctuations effectively.
Additionally, gold pricing remains sensitive to broader macroeconomic developments, including policy decisions under President Trump. Shifts in geopolitical strategy and economic directives could further amplify uncertainty, contributing to market repricing dynamics.
H4 Chart:
M15 Analysis:
-> Swing: Bullish.
-> Internal: Bearish.
Analysis and bias remains the same as analysis dated 22 May 2025.
In my analysis from 12 May 2025, I noted that price had yet to target the weak internal high, including on the H4 timeframe. This aligns with the ongoing corrective bearish pullback across higher timeframes, so a bearish internal Break of Structure (iBOS) was a likely outcome.
As anticipated, price targeted strong internal low, confirming a bearish iBOS.
Price has remained within the internal range for an extended period and has yet to target the weak internal low. A contributing factor could be the bullish nature of the H4 timeframe's internal range, which has reacted from a discounted level at 50% of the internal equilibrium (EQ).
Intraday Expectation:
Technically price to continue bullish, react at either premium of internal 50% EQ or M15 demand zone before targeting weak internal low priced at 3,120.765.
Alternative scenario:
Price can be seen to be reacting at discount of 50% EQ on H4 timeframe, therefore, it is a viable alternative that price could potentially print a bullish iBOS on M15 timeframe.
Note:
Gold remains highly volatile amid the Federal Reserve's continued dovish stance and persistent geopolitical uncertainties. Traders should implement robust risk management strategies and remain vigilant, as price swings may become more pronounced in this elevated volatility environment.
Additionally, President Trump’s recent tariff announcements are expected to further amplify market turbulence, potentially triggering sharp price fluctuations and whipsaws.
M15 Chart:

Up again for goldHi traders,
Last week gold made a bigger pullback for wave 2 (updated wavecount).
So next week we could see the next impulse wave 3 (blue) up.
Let's see what price does and react.
Trade idea: Wait for a change in orderflow to bullish and an impulse wave and correction down on a lower timeframe to finish and trade longs again.
If you want to learn more about trading FVG's & liquidity sweeps with wave analysis, please make sure to follow me.
This shared post is only my point of view on what could be the next move in this pair based on my technical analysis.
Don't be emotional, just trade your plan!
Eduwave

MARKET BIAS BEARISH IN RANGEBased on Chart :- Market bias SELL
Point :- H4 Structure Downtrend In Range TRIANGLE
D1 Bearish Engulfing
H4 Didn't Break Previous High
Based on Marked Zone : WAIT FOR CONFIRMATION IN LTF FOR ENTRY
Target TP : D1 1618 Fibo Level

GOLD📌 Current Bias:
Short-term Bias: Bearish retracement in progress.
Medium-term Bias: Still bullish, unless price breaks below the 0.5–0.618 zone and forms a CHoCH with continuation.
✅ Trading Opportunities:
1. Bullish Continuation
-Entry: Between 3,260–3,270 (demand + 0.382 zone)
-Confirmation: I-CHoCH or bullish BOS on lower timeframes (e.g., 1H)
-Target: 3,338–3,350 (supply), then HH zone
2. Bearish Rejection
-Entry: If price retests 3,338–3,340 and forms a bearish CHoCH again
-Target: 3,250 (imbalance) and 3,200 (0.618 Fib)

Analysis of gold trend next week, hope it will be helpful to yoThe U.S. deadline for imposing tariffs on the EU has been extended to July 9th, while Middle East tensions persist due to the ongoing confrontation between Israel and Iran. Historical data shows that gold volatility rises by an average of 25% during trade friction escalations, and gold prices can surge 3%-5% in a single day following geopolitical conflicts. If next week's tariff negotiations collapse or Middle East tensions deteriorate, gold prices could quickly rebound above $3,350 per ounce.
Pay close attention to the breakthrough of the support level at $3,270-$3,275 and the resistance level at $3,310-$3,320, and judge the shift of bullish and bearish forces by combining changes in trading volume.
Analysis of gold trend next week, hope it will be helpful to you
XAUUSD BUY@3270~3280
SL3260
TP1:3310~3320

Gold is trading within primary & secondary trendlineGold is trading within primary & secondary trendline and trying to consolidate-settle here.

XAUUSD SELL WAY xauusd is likely to move downward as last move matches with this as the chart demonstartes

30 of May 2025 Trading plan Our trading plan first was buying but the price change its direction and i also change to the selling in NY times
1- PDA:-bearish H4-FVG(narrative) to the target of swing low of the bullish candle where the (Reclaimed OB-H2)
2- Rejection Block bearish on 15min associated with CISD-15m
3- bearish CISD or MSS 2 times on the 5m-TF
4- (1-2-3 ) pattern :-3 violate 2 that support the bearish trend
5-TURTLE SOUP in area of CISD
6-AMD IS evident

XAUUAD UPDATE BUY ENTRY WEEK LAST DAYThe chart you’ve shared is for CFDs on Gold (XAU/USD) on a 30-minute timeframe. Here's a breakdown of what it shows:
Key Observations:
1. Support and Resistance Zones:
Support Zone: Around the 3,273.506 level, marked by the lower yellow box.
Resistance Zone: Around the 3,313.665 level, marked by the upper yellow box.
2. Price Action:
There was a significant dip followed by a bullish reversal from the support zone.
A zigzag pattern (possibly an Elliott wave or price structure) indicates a bullish outlook.
3. Trade Setup:
Entry Point: Around 3,292.270 (current price).
Take Profit (TP): Near 3,313.665 (resistance zone).
Stop Loss (SL): Around 3,273.506 (support zone).
4. Risk-Reward:
This setup offers a favorable Risk-to-Reward Ratio, suggesting a long (buy) position with a defined stop and target.
Conclusion:
This chart suggests a bullish trade idea based on price bouncing off the support and targeting the resistance. The highlighted zones provide clear invalidation and profit-taking levels. If you're considering entering, monitor for confirmation like strong bullish candlesticks or volume spikes near the support area.
Let me know if you’d like a deeper analysis or want to explore alternative scenarios (e.g., bearish reversal or range continuation).

Identifying and understanding FVGsGold has absorbed liquidity over the past two days, and there was high volume on the previous day. I expect a 'seek and destroy' move today. If that doesn't happen, the market is still in a 4-hour bullish Fair Value Gap (FVG). The market should move upward from here, potentially reaching the Daily High (DH). If this doesn't occur, then 'seek and destroy' is expected. Do your own research; this is not financial advice.
Detailed Explanation:
Liquidity Absorption: Over the past two days, gold has been consolidating, absorbing liquidity. This means that the market has been gathering orders, setting the stage for a significant price move.
High Volume on Previous Day: The previous day's high trading volume indicates strong market interest and participation, often preceding a substantial price movement.
'Seek and Destroy' Expectation: This term refers to a market behavior where price moves to eliminate stop-loss orders, often leading to a sharp price movement. Traders anticipate this to capture liquidity before a significant move.
4-Hour Bullish Fair Value Gap (FVG): A Fair Value Gap is an area on a price chart that represents an imbalance in the market caused by rapid price movements. A bullish FVG on the 4-hour chart suggests that the market has moved quickly upwards, leaving behind unfilled orders. Traders often expect the price to return to this gap, providing an opportunity to enter trades in the direction of the prevailing trend.
Daily High (DH) Target: The Daily High represents the highest price level reached during the current trading day. Traders often monitor this level as a potential target for price movement.
'Seek and Destroy' Revisited: If the anticipated price movement does not occur, traders may look for a 'seek and destroy' scenario, where the market moves to eliminate stop-loss orders, potentially leading to a sharp price movement.
Disclaimer: The statement advises conducting your own research and clarifies that the information provided is not financial advice.
Trading Strategy!
Liquidity Absorption: Recognizing periods of consolidation and liquidity absorption can help traders anticipate potential breakout points.
Volume Analysis: Monitoring trading volume can provide insights into market interest and potential price movements.
Fair Value Gap (FVG) Trading: Identifying and understanding FVGs can offer opportunities for entering trades in the direction of the prevailing trend.
Risk Management: Always conduct your own research and consider seeking advice from financial professionals before making trading decisions.
DYOR!

CHECK XAUUSD SIGNAL READ CAPTAIN(xauuud) buy zone
(trade setup)
entry point(3292)to(3297)
first target(3300)
2nd target(3304)
last target (3310)
stop loss(3291)
trade on your risk

GOLD ON 4hr gold is set on demand floor ,the break of that 4hr demand floor is a sell confirmation target 3200 on greedy take profit.

Gold Poised for a Breakout After Sideways ConsolidationGold has retraced to the 3300 level and remained range-bound for an extended period. This prolonged consolidation suggests that a sharp breakout may be imminent, with the next move — whether up or down — likely to be swift and volatile.
Looking at the 2-hour chart, the current price structure is complex. It could be interpreted as a potential double top, but it also resembles the early formation of an inverse head and shoulders, which makes trading decisions more challenging.
From a technical standpoint:
Moving averages are aligned in a bearish setup, and the area above remains densely packed with resistance.
MACD on the 2H chart shows a bearish crossover, signaling a potential continuation of the downtrend.
However, on the 30-minute chart, MACD shows some short-term bullish momentum, with the next resistance near 3306.
For bulls, if the price attempts to rise toward the 3306–3312 zone but then quickly pulls back, this would indicate weak buying pressure, and caution is advised.
In summary, short-term signals are bullish, but the medium-term trend remains bearish. With the market in a sideways range, it's best to remain patient and watch for breakout signals. The two trading opportunities shared yesterday remain valid and worth monitoring closely.


5.30 Gold Market5.30 Gold Market
This year's gold market is being reshaped by two forces: 1. Trump's erratic trade policy, 2. The approaching turning point of the Federal Reserve's monetary policy. If the US economy enters the "low growth + high inflation" trap, gold may usher in a structural bull market comparable to that of 2008.
After continuous shocks and tugs of war, you need to observe more and act less. It seems that the market is big, but it is difficult to do it. At this time, protecting the principal is the top priority.
The shock market needs to be arranged at key positions, with upper pressure of 3322-30 and intraday support of 3280-75
SELL: around 3320
SL: 3340
TP: 3270
Thank you for your attention, I hope my analysis can help you.

XAU/USD Wave CountWave (B) of ((ii)) suggested to have ended as Expanded Flat Correction ABC and right now price is to expected to decline to complete Wave (C) of ((ii)) before moving up again in at least 3 waves.

XAUUSD on inverse head and shoulder pattern As Market is still on Falling wedge on H4 and create at rangbound(3330-3290) area along with Inverse Head and shoulder pattern Although today we got 4 tps hit on 3 sell and 1 buy trades.
Whats Current scanario we have ?
At moment im holding my sell position at entry point of3328 .
-If H4 stays below 3315-3310 then we have again Bearish momentum towards 3280 again then 3250 milestone.
Secondly
-If H1&H4 candle closes above 3330-3335 then selling will be postpond and Inverse head&Shoulder pattern will be invalid.
#XAUUSD

How to Trade Gold Market with the 50% Retracement CandleHey Traders so today wanted to show why you don't really need indicators to trade. Price action is the best way to trade imo because it's easier. For the most part indicators lag and can give you false signals. So if you are looking for a way to trade that does not involve indicators check this out.
So we can see that Gold is in a strong uptrend the strategy is wait until market pulls back to trendline and buy but what if you miss that pullback?
So you can still get in the uptrend look for a strong bullish candle like the one I highlighted on May 20. Then place an order to buy when the market pulls back to 50% of that candle. Measure it with the Fibonacci tool. Place your stop below the low of the candle or under support so that way you most likely won't get stopped out. Now this trade was textbook but not all of them are check out how as soon as it hit the 50% retracement of that candle market rocketed higher!
There you go simple way to trade and no need for complex indicators! This strategy works in all markets!
Always use Risk Management!
(Just in case your wrong in your analysis most experts recommend never to risk more than 2% of your account equity on any given trade.)
Hope This Helps Your Trading 😃
Clifford

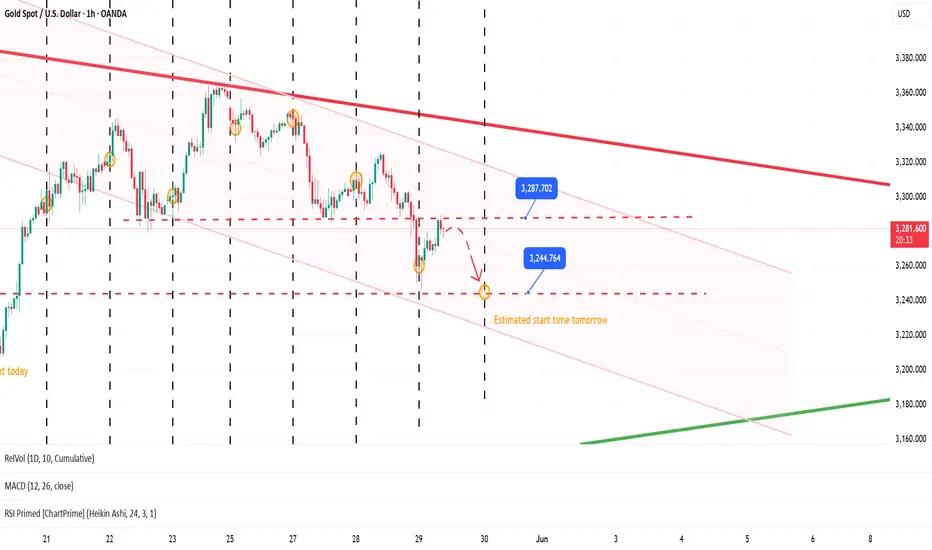
5.29 Gold Market5.29 Gold Market
"The US Federal Court ruled that Trump's tariff policy on April 2 exceeded his authority" The geopolitical risk trend eased.
The monthly line tends to close with a cross star. In the 4H cycle, after the triangle convergence range contraction and consolidation, it broke down, and the Bollinger turned downward. The intraday pressure continued to be bearish, and the moving average pressure was at 3285. In terms of operation, it mainly relied on this position to rebound and short.
Intraday support level 3245 resistance level 3285
SELL: 3285
SL: 3290
TP: 3250
Thank you for your attention. I hope my analysis can help you.
XAUUSD Analysis todayHello traders, this is a complete multiple timeframe analysis of this pair. We see could find significant trading opportunities as per analysis upon price action confirmation we may take this trade. Smash the like button if you find value in this analysis and drop a comment if you have any questions or let me know which pair to cover in my next analysis.
