GOLD (XAUUSD): More Growth Ahead?!
Gold violated a significant intraday horizontal resistance on Friday.
The broken structure and a rising trend line compose a strong
contracting demand area now.
It will be a perfect spot to try to buy Gold after a pullback.
Next goal for the buyers will be 3400.
❤️Please, support my work with like, thank you!❤️
I am part of Trade Nation's Influencer program and receive a monthly fee for using their TradingView charts in my analysis.
GOLDCFD trade ideas

Gold is in the bullish directionHello Traders
In This Chart GOLD HOURLY Forex Forecast By FOREX PLANET
today Gold analysis 👆
🟢This Chart includes_ (GOLD market update)
🟢What is The Next Opportunity on GOLD Market
🟢how to Enter to the Valid Entry With Assurance Profit
This CHART is For Trader's that Want to Improve Their Technical Analysis Skills and Their Trading By Understanding How To Analyze The Market Using Multiple Timeframes and Understanding The Bigger Picture on the Charts

Gold Bulls Taking a Breather?Gold has been in an overall uptrend since late January, steadily climbing with strong bullish momentum. After peaking around $3,440 in early April, price pulled back and found support near $3,171, bouncing from that level and now approaching resistance around $3,300.
Recently, price has shown signs of recovery, but the move still hasn’t broken the downtrend from the previous highs. The current area near $3,300–$3,365 is critical. If Gold can break and hold above this zone, it may retest the $3,440 high. But if price gets rejected again, a pullback toward $3,171 or even $2,972 is possible.
Technical indicators are sending mixed signals. The RSI is around 57, showing moderate bullish strength, but not overbought. However, the Stochastic is in overbought territory with a bearish crossover forming, which could mean a short-term dip is coming. Gold is still trading above all major moving averages, which supports a longer-term bullish outlook.
The bigger picture favors bulls, especially because of recent economic and geopolitical news. The U.S. Dollar has weakened after Moody’s downgraded the U.S. credit rating and concerns grew over a massive new tax-cut bill. Tensions between the U.S. and China, as well as ongoing conflicts in Gaza and Ukraine, have also driven safe-haven demand. Meanwhile, traders are betting on potential rate cuts later in 2025, which tends to boost Gold.
Key levels to watch:
Resistance: $3,300 and $3,440
Support: $3,171 and $2,972
Bias Summary:
Upward Bias: Weak USD, rising geopolitical risk, safe-haven demand, Fed rate cut expectations, price above major moving averages, aggressive central bank buying
Neutral Bias: RSI mid-range, price near resistance
Downward Bias: Stochastic overbought with bearish crossover, potential lower high formation, hidden bearish divergence.
Overall Bias: Bullish Long-term, Bearish potential short term – Fundamentals support further upside, but caution is needed near resistance for retracements.

Is gold's upward channel obviously blocked?
📊Technical aspects
Gold is still in the weekly adjustment pattern. The current rise is still running within a large range of fluctuations. It has not gone out of a clear unilateral market, nor does it have the conditions to go out of a unilateral market. In this oscillating situation, long and short positions switch back and forth.
Next, focus on the performance of gold under pressure in the 3350 area. If the secondary high point is formed near 3350, or if it breaks through 3350 again and then falls back, the short-term short signal is an opportunity to intervene and short. Gold will also face weekly adjustments in June. Therefore, near the 3350 area, do not chase high. Even if this round of rise continues and a complete breakthrough is formed, there will still be opportunities for callbacks to enter the market. Therefore, before this key area is broken or the direction is not clear, do not blindly enter the market to chase high. After the longs leave the market, once a short signal appears, it is an opportunity for shorts to enter the market.
💰 Strategy Package
Short Position:3350-3360

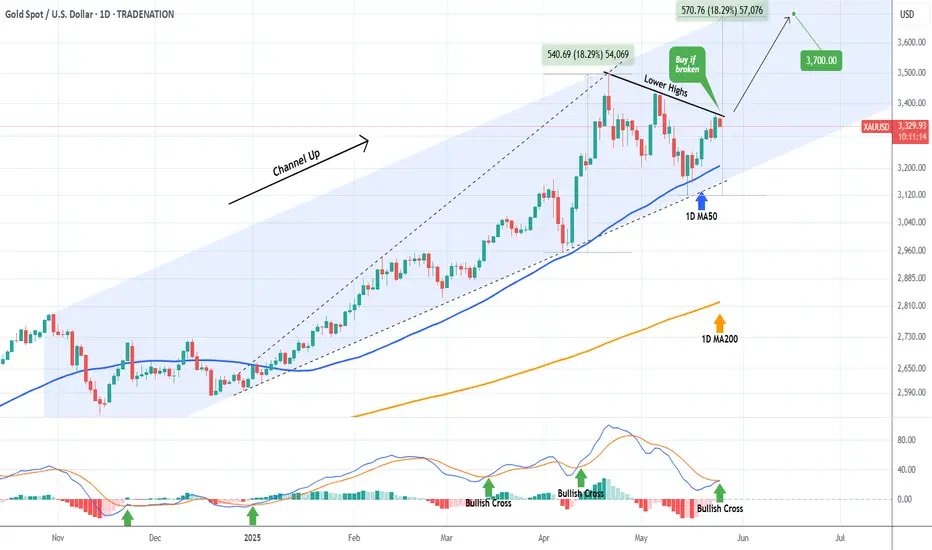
XAUUSD This is the level to look for a break-out.Gold (XAUUSD) has been trading within a Channel Up since the October 30 2024 High, which then transitioned inside it into a Bullish Megaphone. The recent May 15 rebound took place on the 1D MA50 (blue trend-line), which has been the pattern's Support since basically the start of the year (January 08 2025).
Today however we see this rebound taking a pause on the Lower Highs trend-line that started on the April 22 High and until it breaks we can't speculate on a bullish price action as it is more likely to test again the 1D MA50, if not break the pattern downwards.
If however Gold closes a 1D candle above the Lower Highs trend-line, we will turn bullish again, targeting 3700 (+18.29% from the bottom, similar to the previous Bullish Leg).
Notice also that the 1D MACD just completed a Bullish Cross, which favors the buyer's case.
-------------------------------------------------------------------------------
** Please LIKE 👍, FOLLOW ✅, SHARE 🙌 and COMMENT ✍ if you enjoy this idea! Also share your ideas and charts in the comments section below! This is best way to keep it relevant, support us, keep the content here free and allow the idea to reach as many people as possible. **
-------------------------------------------------------------------------------
Disclosure: I am part of Trade Nation's Influencer program and receive a monthly fee for using their TradingView charts in my analysis.
💸💸💸💸💸💸
👇 👇 👇 👇 👇 👇

Looks like a Bull Flag forming on Gold againDespite the RSI on the Monthly indicating gold being in over-bought territory, the daily chart on Gold is forming a bull flag pattern. The measured move up and target price for Gold if it breaks out of the $3400 area is $3900/oz.

XAUUSD ANALYSIS Gold h1 analysis we have strong POI with liqudity at 3340-43 and also have major liqudity to the sellside so wait for this level and we will trade together stay tuned

GOLD GOLD ,in other to add more buy position we need a break above 3364 double confluence sell zone.
the ascending trendline helped keep price in a bullish direction and supported 3323-3326 demand floor to where we are trading at 3341 as at time of reporting and the next impulse should embrace 3364 zone.
break and close more buy confirmation.
on the sell side a breakout from the demand ascending trendline will kiss 3304-3308 and break below will attract more sell position.

Hanzo / Gold 15m Path ( Confirmed Breakout Zones )🆚 Gold
The Path of Precision – Hanzo’s Market tactics
🔥 Key Levels & Breakout Strategy – 15M TF
☄️ Bullish Setup After Break Out – 3343 Zone
Price must break liquidity with high volume to confirm the move.
☄️ Bearish Setup After Break Out – 3332 Zone
Price must break liquidity with high volume to confirm the move.
🩸 15M Time Frame Confluence
————
CHoCH & Liquidity Grab @ 3366
Key Level / Equal lows Formation - 3331
Strong Rejection from 3356 – The Ultimate Pivot
Strong Rejection from 3288 – The Ultimate Pivot
🔥 1H Time Frame Confirmation
Twin Wicks @ 3343 – Liquidity Engineered
Twin Wicks @ 3332 – Liquidity Engineered

With Bullish bias into new Week - 2025/05/26Last week, I published my idea for a whole week with daily updates for the first time. You can read about it here:
🎯 The target of $3348 was reached on Friday due to the announcement of new tariffs against the European Union.
💡 Here is my idea for the week from May 26-30, 2025.
First things first, the Friday session last week ended with bullish momentum. Even though the gold price consolidated more at the $3366 mark, it was obviously to allow time to pass and calm down stressed values like EMA or MACD. This is a very good sign for the start of the week because if the Asia timezone takes the invite, the gold price has a good chance to rise. My expectation is a bullish GAP right at the beginning; if so, it's a clear sign for the rest of the day, in my opinion. These thoughts would support my goal from above $3500 during the week.
📰 Geopolitical News Landscape
India / Pakistan
The ceasefire from May 10 remains tense but intact. Both sides claim victory, while Pakistan strengthens ties with China. Cross-border attacks have ceased, but mutual distrust persists.
➡️ Situation remains fragile; renewed escalation is possible.
Gaza Conflict
Israel intensifies "Gideon’s Chariot" with ground forces in Khan Younis. Mass evacuations and high civilian casualties worsen the humanitarian crisis. Peace talks have stalled as the offensive continues.
➡️ No relief in sight; humanitarian conditions are deteriorating further.
Russia / Ukraine
On May 24, Russia launched its largest air assault yet with 367 missiles and drones—13 civilians were killed. Just before, both sides exchanged 1,000 prisoners. Peace talks remain suspended.
➡️ Violence is escalating; a ceasefire remains out of reach.
U.S.–China Trade War
The 90-day tariff pause triggered a rush to import from China. Shipping bottlenecks and high freight rates are straining businesses. Structural issues remain unresolved.
➡️ Short-term easing; long-term tensions persist.
Trade War on global view
The global trade war has escalated in May 2025, with the U.S. imposing a 50% tariff on EU imports and a 25% levy on foreign-made smartphones, citing trade imbalances. The EU has condemned these moves, warning of potential retaliation. In response to U.S. tariffs, China has restricted rare earth exports, impacting global supply chains. ASEAN nations, heavily affected by U.S. tariffs ranging from 10% to 49%, are urging deeper regional integration to mitigate economic disruptions. The IMF has downgraded global growth forecasts to 2.8% for 2025, citing trade tensions and policy uncertainty. Supply chains are being restructured, with companies shifting production to countries like Vietnam and Mexico. Financial markets are volatile, with increased inflationary pressures and investor anxiety.
➡️ Emerging markets face currency volatility and economic instability due to the ongoing trade conflicts.
⚖️Trump vs. Powell
President Trump increases pressure on Fed Chair Powell to cut rates. The Fed holds interest rates at 4.25–4.5% and warns of inflation. A 10% staff reduction is planned to boost efficiency.
➡️Political interference is increasingly destabilizing markets.
U.S. Inflation – April 2025
Inflation dropped to 2.3%, the lowest since February 2021. However, consumer inflation expectations remain high at 7.3%. The University of Michigan Consumer Sentiment Index fell to 50.8—a historic low.
➡️A clear gap is emerging between official data and public perception.
🔋 Technical Analysis – Short-Term
📊 Analysis: May 19–24, 2025
Weekly Low: $3,204 (May 20)
Weekly High: $3,366 (May 23)
Weekly Close (May 23): approx. $3,358
Total Gain: +5%
🟢 Trend: A clear uptrend is evident. After hitting a low of $3,204 on May 20, gold experienced a strong rally, forming consistently higher highs and higher lows. A brief pullback on May 22 was quickly bought up.
📈 Structure: A series of bullish flag patterns developed, each resolving to the upside. The high at $3,366 currently marks the most significant resistance level.
🔮 Outlook from May 26, 2025
Resistance: $3,366 (recent high)
Support: $3,310 (last local low), below that $3,280 (breakout zone)
Bias: Bullish as long as price holds above $3,310
📌 Scenario 1 – Bullish Breakout: A sustained breakout above $3,366 could unlock further upside potential toward the $3,390–$3,410 area. When Asia session starting with bull GAP the Scenario is the one i preffer.
📌 Scenario 2 – Pullback: A retracement to the $3,310–$3,280 zone would be a healthy correction within the trend, provided this zone holds.
🧭 Conclusion:
Gold remains in a steady uptrend. As long as support levels hold, a continuation toward $3,500 is likely. RSI may be overbought on higher timeframes, so short-term consolidations are possible, but structurally the setup remains bullish.
Anything to ad? Feel free to tell your thoughts.
-------------------------------------------------------------------------
This is just my personal market idea and not financial advice! 📢 Trading gold and other financial instruments carries risks – only invest what you can afford to lose. Always do your own analysis, use solid risk management, and trade responsibly.
Good luck and safe trading! 🚀📊

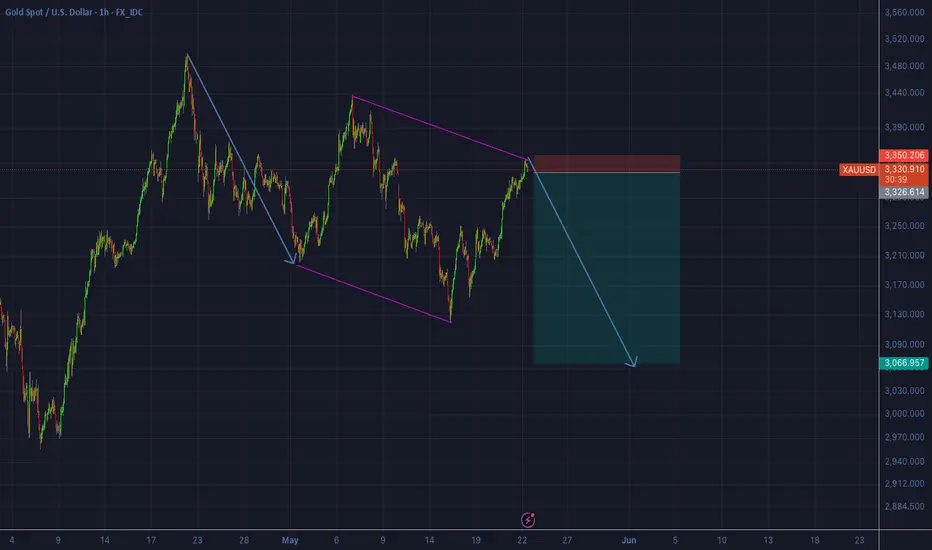
XAUUAD UPDATE 22-05-2025The chart you provided is a technical analysis for Gold (CFDs on Gold - US$/OZ) on a 1-hour timeframe. Here’s a breakdown of what it shows:
1. Price Action:
The current price is around $3,331.56.
The price has recently entered a resistance zone (highlighted in yellow-red near the top).
2. Resistance Zones:
Upper resistance: Around $3,389 (top yellow box).
Immediate resistance: Around $3,330–$3,340 (where price is currently reacting).
3. Support Zone:
Lower support: Around $3,142–$3,160 (bottom yellow box).
4. Bearish Outlook (as indicated by the blue arrow):
The chart suggests a potential rejection from the current resistance zone.
A projected drop toward the lower support area is illustrated.
There’s a red-shaded box likely representing a stop-loss zone, implying a short trade setup with entry near the current level.
5. Volume: There’s a moderate rise in volume recently, which could support the momentum shift.
Conclusion: The chart analysis suggests a short setup expecting gold to fall from the current resistance zone to the support zone around $3,140, assuming price fails to break above resistance.
Would you like a technical analysis or trading plan based on this idea?


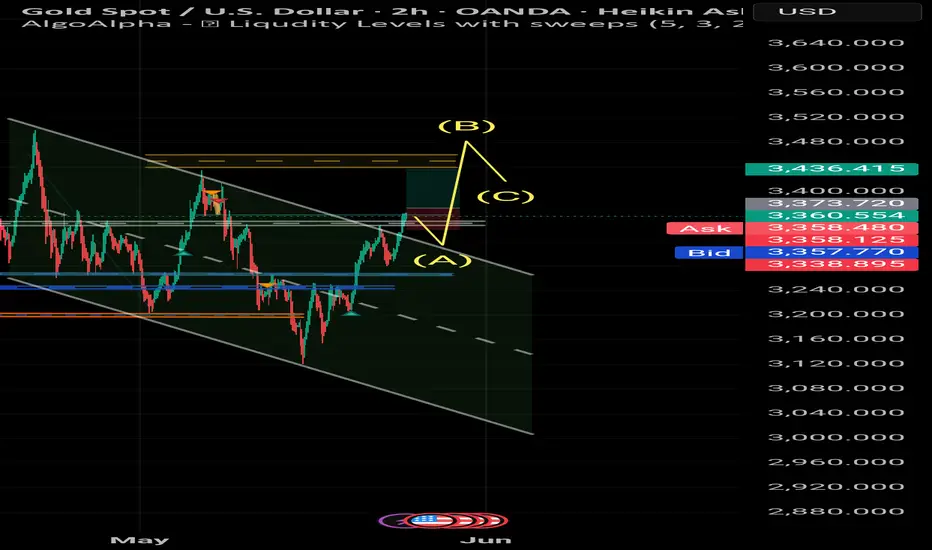
GOLD/USD Analysis – 2H Chart – Potential Bullish BreakoutOn the 2-hour Heikin Ashi chart for Gold (XAU/USD), we’re observing a flag formation after a strong upward movement. Price is currently hovering around 3360, showing consolidation inside a falling channel.
Resistance Zone: 3365–3375
Support Zone: 3345–3335
A bullish breakout is likely if price closes above the resistance area with strong momentum.
Current market volatility suggests potential for a $10–15 move in the next session.
Keep an eye on volume confirmation and possible liquidity sweep traps.
Signals:
Buy Entry: Above 3375 with confirmation
Stop Loss: Below 3335
Target 1: 3395
Target 2: 3410
Risk/Reward Ratio: ~2:1
Analysis by: mohsen mozafari nezhad
Gold prices steady in recovery above 3300⭐️GOLDEN INFORMATION:
Gold prices fell over 0.50% on Monday, weighed down by reduced demand for safe-haven assets after U.S. President Donald Trump announced a delay in the imposition of tariffs on the European Union (EU). Trading activity remained subdued due to market closures in both the United States and the United Kingdom for public holidays. At the time of writing, XAU/USD is trading around $3,336.
Sentiment improved following Trump’s Sunday statement, which postponed the implementation of the 50% tariffs on EU goods to July 9. As a result, gold came under pressure, retreating after last week’s impressive 4.86% surge—its strongest weekly performance since early April.
⭐️Personal comments NOVA:
Gold price continues to maintain the accumulation price range of 3300 - 3367, in recovery momentum
⭐️SET UP GOLD PRICE:
🔥SELL GOLD zone : 3389- 3392 SL 3396
TP1: $3380
TP2: $3368
TP3: $3350
🔥BUY GOLD zone: $3285- $3287 SL $3280
TP1: $3295
TP2: $3310
TP3: $3325
⭐️Technical analysis:
Based on technical indicators EMA 34, EMA89 and support resistance areas to set up a reasonable BUY order.
⭐️NOTE:
Note: Nova wishes traders to manage their capital well
- take the number of lots that match your capital
- Takeprofit equal to 4-6% of capital account
- Stoplose equal to 2-3% of capital account

THE KOG REPORT - UpdateEnd of day update from us here at KOG:
A decent day on the markets after the frustrating range being played early week. We said we expected the play to be between the 3210 and 3255 region with a break either side deciding the short term direction. We waited lower for the 3203-5 region early session, managed to get 3204 and then long on the red boxes which guided the way as well as our trusted algo Excalibur. Excalibur completed 4 Gold targets in a day with another insane pip capture. Well done team.
So now we have an open level above 3290-95 with our indicator starting to show the stretch upside. Rather than attempt long up here, we'll look higher for a potential RIP based on a clean set up, if we get that support is on the flip at 3255-60 which is the retracement level.
As always, trade safe.
KOG

Gold-----Buy directly near 3300, target 3320-3350Gold market analysis:
Yesterday's gold was basically a technical adjustment. Without the US market, the bulls could not rise. Today, the Asian market bottomed out and rebounded to form a small V. When we reach the position we announced, we will do it directly. The position is certain. There is no ambiguity in the range to buy. When we reach it, we will do it decisively. The order must be ruthless and fast. If you are indecisive, it means you are afraid that it will be difficult to hold it even if you enter. What we are afraid of is whether the order we enter has a loss. The order without loss is the most terrible. In this year's market, it is basically difficult to survive without loss. A technical adjustment is 60 points. If you don't carry 1 lot, it is basically 6,000 US dollars. Moreover, 60 points are basically a matter of a few hours in the recent market. Regression analysis shows that yesterday's daily line closed with a small negative line. The daily line still supports buying at the moving average. The general trend is still bullish. There are no holidays today, so buying should start.
The intraday support platform is 3330, which is also the previous support platform. Although it fell to 3323 yesterday, it quickly rebounded. The daily line is still a repair, so we continue to buy today's repair and continue to look at the continuation of the moving average. We consider looking for a small opportunity to go long at 3300. 3340 is a small support.
Support 3340, 3330, slightly stronger is 3323, the market strength is 3338
Fundamental direction:
Yesterday's two holidays made the market fluctuate less in the European and American markets. There is no major fundamentals this week. Pay attention to the news.
Operation suggestions:
Gold-----Buy directly near 3300, target 3320-3350

Gold Price Forecast: Bullish Breakout Targets $3360 ResistanceThis 1-hour chart of Gold (XAU/USD) highlights a bullish breakout from a consolidation zone, supported by a strong rebound from prior support levels. After testing resistance around $3,300, the price shows renewed upward momentum, aiming for the projected target of $3,360. The green shaded areas indicate bullish impulsive moves, while the red zones highlight temporary corrections. Key support and resistance levels are clearly marked, providing traders a technical roadmap for potential price action ahead.
Key Points – Gold (XAU/USD) Analysis:
1. Bullish Momentum: Price is trending upward, gaining +1.05% recently.
2. Resistance Break: Cleared key resistance near $3,300.
3. Target: Upside target set at $3,360.
4. Support Zone: Strong demand seen around $3,160–$3,180.
5. Higher Lows: Consistent higher lows indicate strong buying pressure.
6. Previous Rejection Flipped: Past resistance now acting as support.
7. Short-Term Outlook: Bullish bias remains valid above $3,300.

GOLD ends 3 consecutive days of increase, still positiveOANDA:XAUUSD fell on Thursday (May 22), ending a three-day winning streak and continued to decline slightly in early Asian trading today (May 23), mainly due to a recovery in the US dollar and profit-taking by investors after gold prices hit a two-week high.
However, the outlook for gold prices remains positive due to geopolitical conflicts. Sources revealed that Israel is preparing to attack Iran's nuclear facilities if negotiations between Iran and the United States fail. Readers can review these specific news in previous editions or regular short updates.
Data released by S&P Global on Thursday showed that the preliminary reading of the U.S. manufacturing Purchasing Managers' Index (PMI) rose to 52.3 in May from 50.2 in April, beating expectations of 50.1. The preliminary U.S. services PMI rose to 52.3 in May, compared to both the previous and expected readings of 50.8. Initial jobless claims in the United States were 227,000 in the week ending May 17, down from 229,000 in the previous week and below expectations of 230,000, suggesting the labor market remains solid.
The US House of Representatives passed President Trump's "big and beautiful" tax reform proposal on Thursday. According to the Congressional Budget Office (CBO), the proposal would increase US debt by $3.8 trillion over the next decade to $36.2 trillion.
Gold is often seen as a store of value during times of political and financial uncertainty.
Technical Outlook Analysis OANDA:XAUUSD
Although gold fell yesterday, its current position still has enough conditions to increase towards the target at $3,371, which is the price point of the 0.236% Fibonacci retracement.
The nearest support to watch is the confluence of the 0.382% Fibonacci retracement with the 21-day moving average (EMA21), and even if gold falls short-term below this confluence, it can still increase with the following supports at $3,250, followed by the 0.50% Fibonacci retracement.
The relative strength index (RSI) remains above 50, which is a positive signal for the bullish momentum.
For the day, the technical outlook for gold is tilted to the upside and the points to watch are listed as follows.
Support: $3,300 – $3,292
Resistance: $3,371
SELL XAUUSD PRICE 3367 - 3365⚡️
↠↠ Stop Loss 3371
→Take Profit 1 3359
↨
→Take Profit 2 3353
BUY XAUUSD PRICE 3274 - 3276⚡️
↠↠ Stop Loss 3270
→Take Profit 1 3282
↨
→Take Profit 2 3288

Will Gold Break Through 3366 or Collapse Before NFP? XAUUSD PLAN – MAY 26 | Will Gold Break Through 3366 or Collapse Before NFP?
Gold is approaching a key resistance zone as geopolitical uncertainty and shifting Fed signals add volatility to global markets. While recent bullish momentum has been strong, traders should prepare for potential shakeouts ahead of NFP week.
🌍 MACRO & FUNDAMENTAL CONTEXT
US–Iran Tensions on the Rise: Iran has warned the US it will bear full responsibility if Israel attacks its nuclear facilities. This comes just days before both sides are scheduled to resume nuclear negotiations, increasing the risk of escalation.
Goldman Sachs Signals a Safe-Haven Shift: With 20-year US bond auctions failing and yields surging, Goldman Sachs now recommends gold and Bitcoin as core hedge assets against fiscal instability and a weakening dollar.
DXY Losing Steam: The US Dollar Index is cooling off after a short-term rally, with Fed rate hike expectations becoming less certain.
📉 TECHNICAL ANALYSIS – XAUUSD (M30 – H1)
Gold is consolidating in a bullish structure, bouncing within a rising channel and showing signs of potential continuation.
EMA13/EMA34 have crossed above EMA200 on the M30 chart → a sign of trend strength building.
A large Fair Value Gap (FVG) remains unfilled near 3360–3395 → potential magnet zone if bullish breakout succeeds.
🎯 TRADE SETUPS FOR TODAY
🟢 BUY SCALP
Entry: 3304 – 3302
SL: 3298
TP: 3308 → 3312 → 3316 → 3320 → 3325 → 3330 → 3340
🟢 BUY ZONE
Entry: 3276 – 3274
SL: 3270
TP: 3280 → 3284 → 3288 → 3292 → 3296 → 3300
🔴 SELL SCALP
Entry: 3344 – 3346
SL: 3350
TP: 3340 → 3336 → 3332 → 3328 → 3324 → 3320
🔴 SELL ZONE
Entry: 3376 – 3378
SL: 3382
TP: 3372 → 3368 → 3364 → 3360 → 3350
🧩 STRATEGIC KEYLEVELS
Key SELL Zone: 3358–3360 → If broken, gold may rush toward ATH targets.
Key BUY Zone: 3276–3274 → If lost, a deep retracement below 3200 is likely.
⚠️ NOTES TO TRADERS
This is a geo-politically sensitive market. Sudden news or tweets can trigger explosive moves.
Always wait for confirmation near key zones. Don't chase breakouts without structure.
Risk management is critical.
✅ SUMMARY:
"Political risk is the fuel. Gold is the fire. Stay sharp around the key levels and don't get caught in false breakouts. Be reactive, not predictive."

GOLD Is Going Up! Buy!
Take a look at our analysis for GOLD.
Time Frame: 1h
Current Trend: Bullish
Sentiment: Oversold (based on 7-period RSI)
Forecast: Bullish
The market is testing a major horizontal structure 3,301.19.
Taking into consideration the structure & trend analysis, I believe that the market will reach 3,325.39 level soon.
P.S
We determine oversold/overbought condition with RSI indicator.
When it drops below 30 - the market is considered to be oversold.
When it bounces above 70 - the market is considered to be overbought.
Disclosure: I am part of Trade Nation's Influencer program and receive a monthly fee for using their TradingView charts in my analysis.
Like and subscribe and comment my ideas if you enjoy them!

XAU/USD...1H CHART PATTERN. GOLD (XAU/USD) long position:
🟡 Trade Setup
Buy Entry: 3234
Target: 3350
Stop Loss: (Not provided – see notes below)
🎯 Trade Summary
Metric Value
Entry Price 3234
Target Price 3350
Profit Target +116 points
Stop Loss ❓ (TBD)
Risk/Reward ❓ (depends on SL)
📊 Scenario Analysis (Assuming Some Example Stop Losses):
Stop Loss Risk (Points) R:R Ratio (vs 116pt target)
3184 50 pts ~2.3:1
3150 84 pts ~1.38:1
3100 134 pts ~0.87:1
Let me know your preferred stop loss, and I’ll finalize the table for you.
✅ Key Technical Notes:
Target 3350 is a logical round number and likely a psychological resistance. Confirm if there’s confluence (e.g., fib level, prior high, moving average).
If this is a swing trade, ideal to set SL below a recent swing low or strong support level.
Consider partial profit-taking or trailing stop if momentum is strong before 3350.

Gold Short: Completed 5 waves of wave 1 (higher degree)I believe that Gold has completed the 5th wave. Here are the evidence:
1. Drawn out 5-wave structure with breakdowns.
2. Fibonacci measurement: wave 5 is almost equals to wave 1.
3. RSI is lower at the 5th wave compared to 3rd wave although price is higher (price-rsi divergence).
Stop is $3272.
Take Profit is $3285.
